Skeptical Science, Posted on 7 July 2015 by Andy Skuce
The worst-case emissions pathway, RCP8.5, is a scenario that burns a huge amount of fossil fuels, especially coal. The model has sometimes been criticized as implausible because of its huge resource consumption and emissions of ~1700 billion tonnes of carbon (GtC) over the century. Those emissions are based in part on carbon-cycle model assumptions, which recent work suggests may be too optimistic. New research shows that future plant growth may be restricted by nutrient availability, turning the land carbon sink into a source. Also, permafrost feedbacks (not considered in IPCC CMIP5 models) may also add significant emissions to the atmosphere under the RCP8.5 pathway. In addition, the latest research on the Amazon Basin reveals that the tropical forest carbon sinks may already be diminishing there. Together, these feedbacks suggest that the greenhouse gas concentrations in the RCP8.5 case could be achieved with ~400 GtC smaller human emissions, making the RCP8.5 worst-case scenario more plausible.
The climate models referred to in the recent IPCC Fifth Assessment Report (AR5) are founded on one of four Representative Concentration Pathways or RCPs. The key word in RCP is concentration. In the RCPs, the concentration of greenhouse gases is fixed at different times in the future and the climate model (or general circulation model or GCM) uses those atmospheric concentrations to calculate future climate states. Underpinning the concentration pathways are socio-economic and emissions scenarios. There can be more than one underlying emissions scenario capable of producing the concentration pathway.
If you are unfamiliar with RCPs, check out the great guide that Graham Wayne wrote in August 2013 for Skeptical Science.
This way of modelling differs from previous approaches in which the starting point was a story or scenario about economic and social development that led to emissions. These emissions are run through a carbon-cycle model (which may be simple or complex) to produce atmospheric concentrations over time.

The schematic illustrates the differences in approach. The elements in red boxes are the prescribed inputs into the models, whereas the elements in blue ellipses are outputs. The advantage of the RCP prescribed-concentration approach is that the climate model outputs do not depend to the same degree on carbon-cycle models as they did in the emissions scenario method. The disadvantage is that there is no unique link between concentrations and emissions. The schematic is simplified in that there are feedbacks and loops in the processes that are not illustrated.
The worst-case scenario among the four Representative Concentration Pathways (RCPs) is known as RCP8.5. The number “8.5” refers to the radiative forcing level measured in W/m2 in the year 2100. RCP8.5, despite it often being called “business-as usual,” has been criticized as an unlikely outcome. While true, that’s more feature than bug, since, as one of the two extreme pathways, it is designed to provide climate modellers with an unlikely, but still just plausible “how bad could it be” scenario.
Let’s look briefly at some of the underlying socio-economic assumptions behind RCP8.5, then we’ll examine how the latest research on the terrestrial carbon cycle makes the GHG concentrations in the RCP8.5 model easier to reach.
RCP8.5
The socio-economic model chosen to underpin this pathway is described in Riahi et al. (2011). The model is one in which the following all occur:
- high population growth;
- little improvement in energy efficiency;
- no new greenhouse gas mitigation policy;
- heavy reliance on fossil fuels, especially coal.
Although economic growth is assumed to be moderate, the world economy will grow to over $200 trillion (in year 2000 dollars) and the average per-capita income will be about $20,000 per year, roughly equal to current levels in Portugal or the Czech Republic, about double today’s average world income per person.
Population and GDP: The assumption is that population will rise to 12 billion by 2100. This is higher than the UN’s medium estimate of about 11 billion, but within the range of the low and high fertility estimates (7 and 17 billion, respectively). GDP will grow, but modestly compared to some other pathways and is at the low end of the growth ranges used in the AR4 scenarios.

From Van Vuuren et al. (2011) as are the following figures. Note that Population and GDP figures are assumptions rather than outcomes of the models. The grey shaded areas are UN population models (left) and assumptions used in AR4 models (right).
Energy intensity and energy use: the assumption is that the energy intensity of the economy (the amount of energy needed to produce one dollar of output will fall, but modestly compared to projections of recent trends. This is one of the most extreme assumptions of the model and is very different from historical trends (this is hardly "business-as-usual"). This leads to a quadrupling of energy use over this century.


Fossil fuel resource use: the assumption is that the energy needs will be met mostly by fossil fuels. The graph below shows historic (since 1950) and projected supplies of primary energy. (The left-hand graph was taken from the Global Energy Assessment (Fig. SPM 3) and was squished to be at the same scales as the right-hand graph taken from Riahi et al, 2011, Fig. 5.) About half of the energy supply is provided by a gigantic increase in the use of coal: in 2100 coal consumption will be more than five times the usage in 2010. Coal will be used not only for electricity generation but for coal-to-liquids fuel processes to make up for oil production that that will peak in the 2060s at levels that are double the production rate in 2010.

Energy sources. Historical 1950-2008 and projected in RCP8.5 2008-2100. See text for references.
These staggering assumptions for fossil-fuel use naturally raise questions of resource adequacy. In terms of the estimates of reserves of fossil fuels, the RCP8.5 model uses (roughly, by my own calculations using the figures given in Table SPM-3 of the GEA report) twice the current coal reserves, two to three times the oil reserves and half of the gas reserves. This is not quite as unreasonable as it seems because resources are constantly converted to reserves through development. In terms of reserves + resources, the RCP model uses, by 2100, about 10% of the current coal resources, nearly all of the oil resources and around one-quarter of the gas resources. It should go without saying that this exploitation will involve aggressive development of the world’s unconventional and low-grade resources and it will have huge financial and environmental costs.

See text for data sources. Author's own calculations.
Dave Rutledge of Caltech has used logistic curve-fitting of production histories to estimate world coal resources, and he claims, contrary to the GEA, that coal resources are inadequate by a large factor to meet the demands of RCP8.5. (See, for example this PowerPoint presentation, slides 27-30.) There is a good discussions in GEA Chapter 7, pages 435-437, on the "Peak Debate" mainly focused on oil and further discussion on coal reserve and resource estimates following page 461.
Policy: The Riahi et al. model factors in no greenhouse gas mitigation policies. Despite this, the model does assume that effective action will be taken to reduce local and regional pollutants such as sulphur dioxide, NOx and black carbon, basically assuming that current practices in rich countries today will be adopted by developing countries as their economies grow.
This perfect storm of high population growth, slow improvements in energy efficiency, ruthless exploitation of fossil fuels, and non-existent climate policies leads to the dire climate outcomes of the RCP8.5 scenario. Perfect storms and worst-case scenarios like this are, by definition, unlikely.
So, can we forget about RCP8.5? Not so fast. For one thing, the economic growth forecast is relatively moderate, and a higher one could easily make up for, let’s say, actual lower population growth than assumed in the model. Secondly, and more importantly, nature could provide humans with a helping hand to reach those lofty CO2 concentration targets through the combination of natural terrestrial sinks becoming less effective, along with new sources of carbon emissions appearing as a result of rising global temperatures. Let’s briefly look at the latest research on carbon-cycle effects and see what difference they will make.
Land carbon storage
 All climate models incorporate some form of carbon- cycle component. Some are simple, some complex. The most sophisticated are the Earth System General Circulation Models (ES-GCMs). When it comes to modelling terrestrial storage of carbon, the models account for the increasing effect of carbon dioxide fertilization (C), but they do not (except for two models) account for the effects of nitrogen fertilization (N) and none of them, phosphorus (P).
As any suburbanite knows, lush green grass requires not only water, carbon dioxide and sunshine, but also a supply of nutrients, among which nitrogen and phosphorous are the most important.
A recent study in Nature Geoscience by Will Wieder and three colleagues performed modelling to determine what effect limiting N and P supplies would have on plant growth in an RCP8.5 scenario. Robert McSweeney at Carbon Brief has a good summary of the findings.
New inputs of N into the terrestrial ecosystem come from fixation of atmospheric N. New inflows of P are small and come from weathering of mineral soils and rocks. The nutrients can be moved around somewhat by wind and water, but the natural supply is generally limited to what can be found locally. Once local constraints on N and P supply are factored in, the rate at which plants can grow is limited to about one-third of the rate that has been predicted in the CMIP5 models reported in the AR5 IPCC report. This is shown in “a” in the graph below as the difference between the nutrient-unconstrained growth in black and the growth limited by N and N+P nutrient supply in pink and blue.
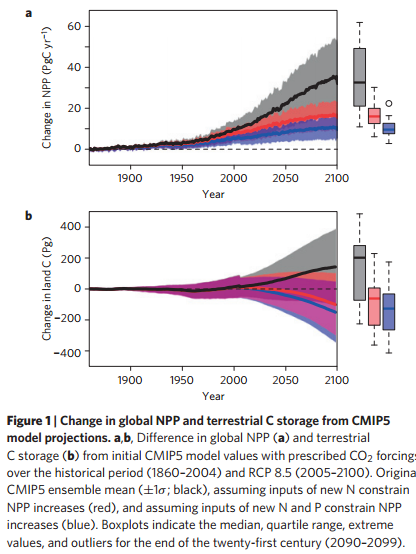
From Wieder et al. (2015).
There’s also a big difference in the cumulative amount of carbon stored in the terrestrial system, once N and P are limited. As shown in part “b” in Wieder et al.’s figure, the terrestrial carbon store over the 21st Century changes from a net sink of 125 GtC to a net source of 156 GtC once nutrient constraints are imposed. In other words, there’s a difference of about 280 GtC between what the AR5 models calculate will be locked up in the terrestrial biosphere compared to what might be the case if the supply of key nutrients is limited.
It is worthwhile pointing out that the uncertainties on all carbon-cycle models are very large. There are some cases where nutrient-constrained models still produce a net carbon sink and cases where the unconstrained AR5 models predict a carbon source. There is nothing hard and fast about any of these results, and a great deal more research is needed. For further reading on the research on the role of forests as carbon sinks and emerging research, I recommend "The hunt for the world’s missing carbon" by Gabriel Popkin in Nature News. Nature 523, 20–22 (02 July 2015) doi:10.1038/523020a
That 280 Gt of carbon has to go somewhere and will end up being divided between the atmosphere and oceans. An alternative way of looking at this would be, for a concentration-defined pathway, we could instead subtract that 280 GtC from the human inputs of carbon over the 21st Century to produce the same GHG forcing. The mean fossil-fuel emissions for RCP8.5 in AR5 models are 1,685 GtC, so those could be reduced to about 1,400 GtC in an N + P nutrient-limited scenario. That would significantly reduce the amount of coal we would need to mine to reach the RCP8.5 GHG forcing, making the pathway more easily achievable. That’s not good news, but it gets even worse once we incorporate permafrost feedbacks.
Permafrost
The carbon release from thawing of the Arctic permafrost are not included in the AR5 models. I wrote about the latest research in a Skeptical Science article in April 2015 "Permafrost feedback update 2015: is it good or bad news?" The review by Ted Schuur and colleagues estimated that on the RCP 8.5 scenario, some 145 ±15 GtC will be released over the rest of this century.
Some of this accelerated soil decomposition could add some N fertilization and alleviate some of the N constraints in Arctic plant growth. So, there is risk of some double counting if we were to simply add the 145 GtC from the Arctic to Wieder et al.’s 280 GtC from fertilization constraints. This would have to be calculated using a properly integrated model, but let’s assume for now that the combined effect of permafrost thaw and N and P constrained plant growth would be about 400 GtC.
That would reduce the amount of fossil fuel emissions required to produce the RCP8.5 GHG forcing to about 1,300 GtC from the AR5 figure of 1,685 GtC. For the sake of comparison, 400 GtC is approximately the total amount of carbon produced historically from fossil fuels and cement from 1750-2013.
To put it more plainly, if we follow the RCP8.5 business-as-usual pathway, nature may add to our emissions (relative to current IPCC expectations) as much additional carbon as we have emitted from fossil fuels since the Industrial Revolution began. To repeat, that carbon feedback is not factored into the latest IPCC assessment.
Alas, it doesn’t end there.
Tropical forest die-back
A recent paper by Roel Brienen and 90 or so co-authors examined the effectiveness of the Amazon rain forest as a carbon sink over the past 25 years. Again, Robert McSweeney has a good summary at Carbon Brief.
The key findings were:
• The Amazon is still acting as a net carbon sink, but its effectiveness has been diminishing over the past 25 years. Simple linear extrapolation of the rate of biomass change would predict that it could change to a net source of carbon over coming decades.
• The forest productivity measured on a per-hectare basis increased in the 1990s but levelled off in 2000-2010.
• Trees have been dying off more quickly over the 1990-2010 period.
• The forest productivity measured on a per-hectare basis increased in the 1990s but levelled off in 2000-2010.
• Trees have been dying off more quickly over the 1990-2010 period.
The reasons cited (see also the accompanying Nature article by Lars Hedin) for the tree mortality are: (a) the faster the trees grow, the quicker they die; (b) drought periods, as we saw in 2010; and (c) possible limitations of N and P nutrients.
What this amounts to is an additional divergence from prevailing assumptions that the biosphere will continue to provide a strong net sink of carbon throughout the century. This effect is largely, but perhaps not completely, independent from the processes described by Wieder and will provide an additional boost to carbon-cycle feedbacks to those from nutrient limitations and permafrost thaw.
The size of this tropical-forest effect over the 21st Century is unclear. The Amazon Basin contains about 150-200 GtC in living plants and soils. It is not known how much of this carbon will be lost over coming decades. Nor is it known how much carbon will be lost from other, less-well-studied tropical rainforests in Africa and SE Asia. Brienen et al. estimate that an increase of 3.8 GtC in necromass (dead wood) produced since 1983 has yet to reach the atmosphere. That's equivalent to more than two years of current US carbon emissions.
Summing up
Compared to the existing IPCC models, terrestrial carbon-cycle processes could provide an additional net feedback of 400 GtC or more over this century following the RCP8.5 scenario. This is a quantity roughly equivalent to historical human fossil fuel emissions to date. The implication is that the gigantic fossil fuel consumption envisioned in the RCP8.5 socio-economic model could be reduced by 25% or so, and we would still achieve the 8.5 W/m2 greenhouse gas forcing required in the model. This makes this worst-case scenario much more likely to be achievable. Nevertheless, humans would still have to demonstrate ingenuity and determination in exploiting even that reduced amount of fossil fuels, while at the same time remaining oblivious to the climate consequences.
We ought, of course, to be able to do much better than that, but our recent history shows that we are perfectly capable of demonstrating short-term, resource-exploitation ingenuity at the same time as being heedless when it comes to longer-term environmental consequences. The huge and unpredicted increase in the production of unconventional oil and gas resources in North America in just a few years has shown what we can do to exploit resources once we are motivated. We certainly should not console ourselves that RCP8.5 is beyond our reach just because the present estimate of fossil fuel resources appears insufficient. The recently quantified carbon cycle feedbacks that may occur if we follow the path of no mitigation make the achievement of the RCP8.5 greenhouse gas forcing level all too plausible.
References
Brienen, R. J. W., Phillips, O. L., Feldpausch, T. R., Gloor, E., Baker, T. R., Lloyd, J., ... & Marimon, B. S. (2015). Long-term decline of the Amazon carbon sink. Nature, 519(7543), 344-348.
Hedin, L. O. (2015). Biogeochemistry: Signs of saturation in the tropical carbonsink. Nature, 519(7543), 295-296.
Johansson, T. B., & Nakićenović, N. (Eds.). (2012). Global Energy Assessment: Toward a Sustainable Future. Cambridge University Press. PDF
MacDougall, A. H., Avis, C. A., & Weaver, A. J. (2012). Significant contribution to climatewarming from the permafrost carbon feedback. Nature Geoscience,5(10), 719-721.
Popkin, G. (2015) The hunt for the world's missing carbon. Nature 523, 20–22 (02 July 2015).
Riahi, K., Rao, S., Krey, V., Cho, C., Chirkov, V., Fischer, G., ... & Rafaj, P. (2011). RCP 8.5—A scenario of comparatively high greenhouse gas emissions.Climatic Change, 109(1-2), 33-57. PDF
Schuur, E. A. G., McGuire, A. D., Schädel, C., Grosse, G., Harden, J. W., Hayes, D. J., ... & Vonk, J. E. (2015). Climate change and the permafrost carbonfeedback. Nature, 520(7546), 171-179.
Van Vuuren, D. P., Edmonds, J., Kainuma, M., Riahi, K., Thomson, A., Hibbard, K., ... & Rose, S. K. (2011). The representative concentration pathways: an overview. Climatic change, 109, 5-31. PDF
Wieder, W. R., Cleveland, C. C., Smith, W. K., & Todd-Brown, K. (2015). Future productivity and carbon storage limited by terrestrial nutrient availability. Nature Geoscience, 8(6), 441-444.
Appendix: a note on the low-emission scenario
The carbon-cycle papers discussed above look only at feedbacks in the high-emissions scenario or, in the case of the Amazon paper, report recent trends. To try to estimate the effect that these phenomena will have under a lower-human-emissions scenario requires guesswork. What follows is just that, so reader beware.
According to MacDougall et al. (2012) permafrost feedbacks up to 2100 for the RCP2.6 scenario would be about 40% of those for the RCP8.5 case. Applying that percentage to Schuur's permafrost emissions for RCP8.5 gives 60 GtC of emissions from permafrost by 2100 under low human emissions.
The nutrition effect noted by Wieder will be small under a low-emissions scenario, and I will assume that it is zero for these purposes.
There are already 3.8 GtC of dead wood in the Amazon that has accumulated since 1983, according to Bienen et al. That carbon has not yet reached the atmosphere. Assuming this trend continues for several more decades, let's assume a 10 GtC feedback from the Amazon by 2100, noting also that similar processes may be playing out in other tropical forests.
The IPCC AR5 Summary for Policy Makers contains the following paragraph (my highlighting):

Using those numbers, updating them with actual emissions from 2012-2014 and subtracting the carbon cycle feedbacks gives this table:

On this estimation, the carbon-cycle feedbacks from permafrost and reduced tropical forest sinks could reduce our "safe" emissions by 20-30% (incidentally, about the same percentage as for the high-emissions scenario). The time period we have left at current emissions rates would be reduced by 6 years, to as little as 16 years, if we give ourselves a two-thirds chance of staying below two degrees, once we factor in carbon cycle feedbacks.
I should stress again that these are just my estimates, and they are intended for discussion purposes only. Properly integrated studies that incorporate all of the latest carbon-cycle feedback studies under different emissions scenarios have yet to be done.


No comments:
Post a Comment