by Tim Radford, Climate News Network, July 16, 2014
A landmark research study that shows one species of penguin is thriving while other populations are in rapid decline offers new insight into how climate change is affecting Antarctica.
LONDON - Good news from Antarctica: the continent may be warming, the ice shelf may be at risk, and the food chain may ultimately become precarious, but the Adélie penguin population – at least for the moment − is higher than ever before.
The news does not suggest that global warming and climate change are actually good for this important indicator species, which has certainly been in decline on the Antarctic Peninsula. But it does represent an advance: for the first time, a comprehensive study has concluded with a full census of the species.
Heather Lynch, assistant professor of ecology and evelotion at Stony Brook University in New York, and Michelle La Rue, research fellow at the University of Minnesota’s Polar Geopspatial Center, used high resolution satellite imagery to measure levels of penguin guano – the fertiliser industry’s preferred term for seabird excrement – on the continent.
They then used that as the basis for calculating the numbers of birds in a colony necessary to account for all that digested and evacuated seafood.
They report in a journal called The Auk: Ornithological Advances that they identified at least 17 populations of Adélie penguins not previously known to exist, but failed to pinpoint 13 already-recorded colonies, and declared 8 of them eradicated.
Their estimate for the total Adélie population in and around the Southern Ocean stands at 3.79 million, which is 53% higher than all previous estimates.
Useful evidence
The researchers call their work a “landmark” study, and see it not as evidence that climate change is going to work for the benefit of one particular species, but more as a useful piece of the great food-web puzzle in a changing climate.
Penguins have been in rapid decline in the West Antarctic Peninsula, which has become one of the fastest-warming regions on the planet. Warmer weather and increased rain have already started to take toll of Magellanic penguins in Argentina, and researchers recently predicted long-term decline for the iconic Emperor penguin on Antarctica itself.
But this is only long-term decline. As long as Antarctica stays cold and the ice shelf stays stable, the researchers say, the population could, in the short term, actually rise.
That is because what matters most to the species that nest in Antarctica is the supply of fish and krill around the continent’s edge. The health and resilience of the Adélie population – and the Emperor penguin, the leopard seal, the cetaceans, and so on – ultimately depend on how the krill and fish populations respond to climate change.
Humans, too, fish for commercial supplies of Antarctic krill, which provides a source of food for fish farms.
“Our finding of a 53% increase in Adélie penguin breeding abundance, compared to 20 years ago, suggests that estimates of krill consumption by this species may be seriously underestimated,” Dr Lynch said. “Leaving enough prey for natural krill predators is an important element in ensuring fisheries proceed sustainably.”
But a second team confirms in Nature Communications that there are strong links between climate and marine life, and that changes in factors such as wind speed and sea ice can have knock-on effects right around the Antarctic food web.
Since 1990, scientists aboard US research vessels have been conducting annual surveys along the western side of the Antarctic Peninsula, measuring populations of photosynthetic algae.
These peak every 4-6 years, according to changes in atmospheric pressure between the mid-latitudes and Antarctica itself.
Glacial meltwater
In winter, when cold southerly winds blow across the Peninsula, the winter ice extends. Winds drop from spring to summer, reducing the retreat of the ice. So the water column in summer then is stable, and the phytoplankton multiply, fed by iron-rich glacial meltwater.
The blooms of phytoplankton are what the krill need to multiply, and when the krill are around in huge volumes, the Adélie and other penguins, fur seals, baleen whales and albatross don’t have to go so far to find food.
But marine scientist Grace Saba, who did her research while with the Virginia Institute of Marine Science, before moving to Rutgers University, New Jersey, reports that these ideal conditions – negative phases of the Southern Annular Mode (SAM), to give it the technical terminology – are not guaranteed in future. If the world goes on burning fossil fuels, conditions will probably change.
“Projections from global climate models under business-as-usual emission scenarios up to the year 2100 suggest a further increase in temperature and in the occurrence of positive-SAM conditions,” Dr Saba said.
“If even one positive SAM episode lasted longer than the krill lifespan – 4-6 years with decreased phytoplankton abundance and krill recruitment – it could be catastrophic to the krill population.”
Showing posts with label Southern Annular Mode. Show all posts
Showing posts with label Southern Annular Mode. Show all posts
Wednesday, July 23, 2014


Sunday, May 25, 2014
"Evolution of the Southern Annular Mode during the past millennium," by N. J. Abram et al., Nature Clim. Change (2014); doi:10.1038/nclimate2235
Nature Climate Change (11 May 2014); doi:10.1038/nclimate2235
Link: http://www.nature.com/nclimate/journal/vaop/ncurrent/full/nclimate2235.html
Evolution of the Southern Annular Mode during the past millennium
Abstract
The Southern Annular Mode (SAM) is the primary pattern of climate variability in the Southern Hemisphere1,2, influencing latitudinal rainfall distribution and temperatures from the subtropics to Antarctica. The positive summer trend in the SAM over recent decades is widely attributed to stratospheric ozone depletion2; however, the brevity of observational records from Antarctica1—one of the core zones that defines SAM variability—limits our understanding of long-term SAM behaviour. Here we reconstruct annual mean changes in the SAM since AD 1000 using, for the first time, proxy records that encompass the full mid-latitude to polar domain across the Drake Passage sector. We find that the SAM has undergone a progressive shift towards its positive phase since the 15th century, causing cooling of the main Antarctic continent at the same time that the Antarctic Peninsula has warmed. The positive trend in the SAM since ~AD 1940 is reproduced by multimodel climate simulations forced with rising greenhouse gas levels and later ozone depletion, and the long-term average SAM index is now at its highest level for at least the past 1,000 years. Reconstructed SAM trends before the 20th century are more prominent than those in radiative-forcing climate experiments and may be associated with a teleconnected response to tropical Pacific climate. Our findings imply that predictions of further greenhouse-driven increases in the SAM over the coming century3 also need to account for the possibility of opposing effects from tropical Pacific climate changes.
At a glance


NewScientist: Antarctic wind vortex is strongest for 1,000 years

The winds ripping around Antarctica. (Image: earth.nullschool.net)
by Michael Slezak, NewScientist, May 11, 2014
Our greenhouse gas emissions are helping to spin up a giant vortex of winds around Antarctica.
Antarctica has been warming relatively slowly compared with the rest of the world. The explanation seems to be that the winds spinning clockwise around the continent have been getting stronger, preventing warm air from entering.
In a way, those winds have done us a favour by keeping warm air away from the South Pole. Otherwise it might be melting. But as this atmospheric maelstrom accelerates, it shrinks, leaving the most vulnerable parts of Antarctica out in the warm and dragging winter rain away from Western Australia.
In 2009, it seemed that the hole in the ozone layer above Antarctica was responsible for boosting the winds. Now Nerilie Abram from the Australian National University in Canberra and her colleagues have shown the ozone hole is only part of the story. Global warming is just as important.
Warming powers winds
The team reconstructed Antarctic temperatures over the past 1,000 years, using an ice core from James Ross Island near the Antarctic Peninsula. The temperatures correlated with how strong and tight the winds are, so they could construct a record of wind strength.
They found that the current strength of the winds is unprecedented over the past millennium. But the surge in strength started in the 1940s, decades before the ozone hole.
So Abram's team simulated the last millennium using 8 climate models, driven by actual greenhouse gas levels previously reconstructed from ice cores. All the models predicted that the winds would pick up by the 1940s, suggesting greenhouse gases were playing a role. That may be because the Northern Hemisphere is warming faster than the south – because it has more continents – creating a strong temperature gradient that boosts the winds.
Such historical data is vital, says Wenju Cai from the CSIRO, Australia's national research agency, in Melbourne. In as-yet-unpublished work, he estimates that ozone depletion has caused two-thirds of the impact on the Antarctic winds, with greenhouse gases responsible for the rest.
Futureshock
If greenhouse gases really are contributing to the winds, it changes our expectations for what will happen to the climate in Australia and Antarctica.
The ozone hole is expected to heal in the coming decades, and if it was the only factor controlling the winds they would weaken and expand. So Australia would get its rain back, while the western parts of Antarctica might get some more protection against warming.
However, Abram says rising global temperatures will counteract this weakening effect on the winds. That means Western Australia will stay dry and the western parts of Antarctica, stranded outside the winds, will keep melting.
Cai estimates that, on our current emissions pathway, the two factors will counteract each other until 2045, so the winds will stay constant. After that, without reducing our emissions, greenhouse gases will boost the winds further.
Journal reference: Nature Climate Change, DOI: 10.1038/NCLIMATE2235
Sunday, May 11, 2014
Australia: Wilder winds, less rain, as Roaring Forties become Furious Fifties
by Peter Hannam, Environment Editor, The Sydney Morning Herald, May 11, 2014

Photo: Fairfax Graphics
The Roaring Forties, the Southern Ocean winds which once bore European sailors to Australia and the East Indies, are becoming more like the Furious Fifties as climate change triggers a shift in key weather patterns poleward, an Australian-led team of scientists has found.
Using data derived from Antarctic ice cores and other sources, the researchers found Southern Ocean winds are now stronger than at any time in the past 1,000 years.
Greenhouse gases are what are causing the winds to intensify now and that’s really moving the system beyond the natural range,” said Nerilie Abram of the Australian National University’s Research School of Earth Sciences and lead author of the research, published on Monday in Nature Climate Change.
In the past half century, the westerly winds have quickened 10-15% and moved 2-5 degrees closer to the South Pole – meaning fewer storms are reaching as far north as Australia.
“That isn’t good news for farmers in the southern parts of Australia who are reliant on the winter winds that come out of the Southern Ocean,” Dr Abram said. Winter rainfall has dropped 20% in southwest Western Australia since the 1960s, with cool-season rain tallies also lower in Australia’s southeast.
The stronger winds also help resolve a climate-change conundrum – why Antarctica is not warming as fast as other continents and the Arctic. “Over a large part of Antarctica we don’t get much warming at all,” Dr Abram said. [This may be changing - temperature anomalies over Antarctica have become very significant this year.]
The reason for the discrepancy is that cool air is being trapped over Antarctica, resulting in increased snowfall for some regions. However, areas exposed to stronger winds and warming seas, such as the Antarctic Peninsula, are heating up faster than anywhere else in the Southern Hemisphere.
“The West Antarctic Ice Sheet [adjacent to the peninsula] is probably the bit of the Antarctic ice mass that we’ve been most concerned about for the longest time,” said Matthew England, from the University of NSW’s Climate Change Research Centre, and a co-author of the paper. If it all melted, that ice sheet could lift global sea levels by 4-5 metres, he said.
Professor England said the changes to atmospheric variability that see the band of westerly winds oscillate north or south – known in the Southern Hemisphere as the Southern Annular Mode – are driven roughly equally by the effect of rising greenhouse gases and the ozone hole.
The relative contribution, though, should alter as internationally agreed constraints on the use of chemicals that destroy the protective ozone layer take effect, potentially slowing the pick-up in wind speeds.
“Going forward, the greenhouse aspect will dominate as the ozone hole starts to repair and, of course, greenhouse gases are going terrifyingly upwards in their concentration,” he said.
Wenju Cai, an atmospheric scientist at the CSIRO who was not part of the research team, said the findings would assist the study of other key processes, such as whether the rate at which the Southern Ocean absorbs heat and carbon dioxide is changing.
The faster winds “may have a lot of influences that we do not know now,” Dr Cai said. “We may even solve some of the big issues that have been puzzling scientists for many, many years.”
Monday, March 24, 2014
"Australia's unique influence on global sea level in 2010–2011," by J. T. Fasullo et al., GRL 40 (2013); doi: 10.1002/grl.50834
Geophysical Research Letters, 40(16) (28 August 2013); doi: 10.1002/grl.50834
Australia's unique influence on global sea level in 2010–2011
Abstract
http://onlinelibrary.wiley.com/doi/10.1002/grl.50834/abstract
Australia's unique influence on global sea level in 2010–2011
Abstract
In 2011, a significant drop in global sea level occurred that was unprecedented in the altimeter era and concurrent with an exceptionally strong La Niña. This analysis examines multiple data sets in exploring the physical basis for the drop's exceptional intensity and persistence. Australia's hydrologic surface mass anomaly is shown to have been a dominant contributor to the 2011 global total, and associated precipitation anomalies were among the highest on record. The persistence of Australia's mass anomaly is attributed to the continent's unique surface hydrology, which includes expansive arheic and endorheic basins that impede runoff to ocean. Based on Australia's key role, attribution of sea level variability is addressed. The modulating influences of the Indian Ocean Dipole and Southern Annular Mode on La Niña teleconnections are found to be key drivers of anomalous precipitation in the continent's interior and the associated surface mass and sea level responses.
http://onlinelibrary.wiley.com/doi/10.1002/grl.50834/abstract
Wednesday, September 22, 2010
"Warming of global abyssal and deep Southern Ocean waters between the 1990s and 2000s: Contributions to global heat and sea level rise budgets by Sarah G. Purkey &
Journal of Climate,
Warming of global abyssal and deep Southern Ocean waters between the 1990s and 2000s: Contributions to global heat and sea level rise budgets
Sarah G. Purkey¹,² and Gregory C. Johnson²,¹,*
¹School of Oceanography, University of Washington, Seattle, WA 98195, U.S.A.
²NOAA/Pacific Marine Environmental Laboratory, Seattle, WA 98115, U.S.A.
Abstract
*Correspondence e-mail: gregory.c.johnson@noaa.gov
Link to full paper (pdf file): http://www.pmel.noaa.gov/people/gjohnson/Recent_AABW_Warming_v3.pdf
Warming of global abyssal and deep Southern Ocean waters between the 1990s and 2000s: Contributions to global heat and sea level rise budgets
Sarah G. Purkey¹,² and Gregory C. Johnson²,¹,*
¹School of Oceanography, University of Washington, Seattle, WA 98195, U.S.A.
²NOAA/Pacific Marine Environmental Laboratory, Seattle, WA 98115, U.S.A.
Abstract
We quantify abyssal global and deep Southern Ocean temperature trends between
the 1990s and 2000s to assess the role of recent warming of these regions in global heat
and sea level budgets. We compute warming rates with uncertainties along 28 full-depth,
high-quality, hydrographic sections that have been occupied two or more times between
1980 and 2010. We divide the global ocean into 32 basins defined by the topography and
climatological ocean bottom temperatures and estimate temperature trends in the 24
sampled basins. The three southernmost basins show a strong statistically significant
abyssal warming trend, with that warming signal weakening to the north in the central
Pacific, western Atlantic, and eastern Indian Oceans. Eastern Atlantic and western Indian
Ocean basins show statistically insignificant abyssal cooling trends. Excepting the Arctic
Ocean and Nordic seas, the rate of abyssal (below 4000 m) global ocean heat content
change in the 1990s and 2000s is equivalent to a heat flux of 0.027 (±0.009) W m–2
applied over the entire surface of the Earth. Deep (1000–4000 m) warming south of the
Sub-Antarctic Front of the Antarctic Circumpolar Current adds 0.068 (±0.062) W m–2.
The abyssal warming produces a 0.053 (±0.017) mm yr–1 increase in global average sea
level and the deep warming south of the Sub-Antarctic Front adds another 0.093 (±0.081)
mm yr–1. Thus warming in these regions, ventilated primarily by Antarctic Bottom
Water, accounts for a statistically significant fraction of the present global energy and sea
level budgets.
*Correspondence e-mail: gregory.c.johnson@noaa.gov
Link to full paper (pdf file): http://www.pmel.noaa.gov/people/gjohnson/Recent_AABW_Warming_v3.pdf
"Billions of blow dryers: Some missing heat returns to haunt us" by Doug Bostrom, Skeptical Science
Billions of blow dryers: Some missing heat returns to haunt us
"The heat will come back to haunt us sooner or later..." -- Kevin Trenberth, referring to our inability over the past 5 years to locate half a watt per square meter per year of energy accumulated on Earth as a result of anthropogenic warming of the planet, approximately half of the expected warming signal.
by Doug Bostrom, Skeptical Science, September 23, 2010
It's a sad fact that while Earth's oceans are expected to absorb the vast majority of anthropogenically induced imbalance of the global energy budget, our physical observations of the caloric state of the deep ocean are conspicuously sparse when compared to daily remote sensing revisitations enjoyed by research subjects amenable to orbital remote sensing platforms. In some ways our instrumentation of such far-flung places as Mars and Venus is better than what we deploy here on Earth in the abyssal depths. While we have solid theoretical grounding for predicting storage of excess heat in the ocean, without the means to directly measure and accurately quantify this effect we're left missing not only heat but also a useful means of testing and validating predictions of climate sensitivity to forcing.
As our technical capacities have risen to the challenge of dealing with an environment arguably more hostile to instrumentation than near-Earth orbital space, oceanographers at last are enjoying some of the same physical and scientific advantages as those long enjoyed by scientists working with space-based remote sensing platforms. The semi-autonomous Argo array represents a huge leap forward in our understanding of the characteristics of the upper ocean. With respect to anthropogenic climate change, of late we've been treated to increasingly dense and accurate measurements of upper ocean heat content, greatly refining our ability gather this important data.
Unfortunately the present Argo implementation is depth-limited, and we thus still have no automated systems in place for data retrieval from the slightly over one half of the ocean inaccessible to robotic probes. For this majority of ocean volume we still must rely on hardy investigators "going down to the sea in ships, that do business in great waters." We landlubbers wondering about "missing heat" and suspecting it may be found in the ocean can only be patient as we wait for salt-crusted mariner scientists to return to shore and write up their results.
The main reason for lamentation of "Trenberth's Travesty" is the declining upward pace over the past 5 years of the portion of ocean heat content (OHC) we're readily able to measure. We know that sea level rise (SLR) is principally caused by both thermal expansion of the oceans and water mass contributed by continued melting of terrestrial ice. Terrestrial ice alone cannot account for the continuing sea level rise we see in the face of the slackened pace of upper ocean warming. Juxtaposing continuing sea level rise against OHC we don't observe, we're left with a substantial technical mystery, an inability to "close the budget" of SLR as well as an inability to specifically account for the final destination of heat we know is accumulating on the planet (Willis 2008). Failing the unlikely emergence of some new mechanism able to cause SLR, we may say with reasonable confidence that continued SLR can at least partially be attributed to accumulating OHC we can't directly "see," but merely saying so is no substitute for direct measurements.
Now we may say some significant progress has been made in tracking down "missing heat." In the Journal of Climate, Sarah Purkey of the University of Washington and NOAA's Gregory Johnson report on an ambitious project to quantify heat being stored in the abyssal ocean ("Warming of Global Abyssal and Deep Southern Ocean Waters Between the 1990s and 2000s: Contributions to Global Heat and Sea Level Rise Budgets"). By revisiting abyssal stations included in the World Ocean Circulation Experiment (WOCE) conducted in the 1990s, about 20% of Trenberth's famous "missing heat" appears to have been tracked down, found to be slowly traveling north from the Southern Ocean.
While integrating these new measurements into the global heat budget does not entirely close our observational gap, by producing their results Purkey and Johnson have crisply demonstrated how vast amounts of heat may have been left out of the budget for the simple reason of previously being invisible. Their work is also a compelling case for improving our capability to routinely measure with less extraordinary effort the majority of ocean volume we're presently forced to ignore when accounting for accumulation of heat. Finally, it seems reasonable to conclude that these measurements bolster our confidence in SLR as a proxy for increasing OHC.
Purkey and Johnson's abstract:
We quantify abyssal global and deep Southern Ocean temperature trends between the 1990s and 2000s to assess the role of recent warming of these regions in global heat and sea level budgets. We compute warming rates with uncertainties along 28 full-depth, high-quality, hydrographic sections that have been occupied two or more times between 1980 and 2010. We divide the global ocean into 32 basins defined by the topography and climatological ocean bottom temperatures and estimate temperature trends in the 24 sampled basins. The three southernmost basins show a strong statistically significant abyssal warming trend, with that warming signal weakening to the north in the central Pacific, western Atlantic, and eastern Indian Oceans. Eastern Atlantic and western Indian Ocean basins show statistically insignificant abyssal cooling trends. Excepting the Arctic Ocean and Nordic seas, the rate of abyssal (below 4000 m) global ocean heat content change in the 1990s and 2000s is equivalent to a heat flux of 0.027 (±0.009) W m–2 applied over the entire surface of the Earth. Deep (1000–4000 m) warming south of the Sub-Antarctic Front of the Antarctic Circumpolar Current adds 0.068 (±0.062) W m–2. The abyssal warming produces a 0.053 (±0.017) mm yr–1 increase in global average sea level and the deep warming south of the Sub-Antarctic Front adds another 0.093 (±0.081) mm yr–1. Thus warming in these regions, ventilated primarily by Antarctic Bottom Water, accounts for a statistically significant fraction of the present global energy and sea level budgets.
In an interview, coauthor Gregory Johnson expressed the amount of heat identified in this study in amusingly prosaic terms: the newly located reservoir of energy is akin to what would be liberated by loading every man, woman and child on Earth with five 1,400-watt hairdryers each and running those appliances continuously for the 20-year interval between measurements.
Purkey and Johnson's results, mapped:

"Mean local heat fluxes through 4000 m implied by abyssal warming below 4000 m from the 1990s to the 2000s within each of the 24 sampled basins (black numbers and colorbar) with 95% confidence intervals and the local contribution to the heat flux through 1000 m south of the SAF (magenta line) implied by deep Southern Ocean warming from 1000–4000 m is also given (magenta number) with its 95% confidence interval." (Purkey & Johnson 2010)
How can Antarctic Bottom Water (AABW) influence abyssal temperatures so far north of the Antarctic? To understand this, it's helpful to grasp the huge role in deep ocean circulation played by the Southern Ocean and the Antarctic. AABW is derived from enormous quantities of chilled, relatively saline and thus dense water sinking at the extreme south of the globe, in Antarctic waters. This mass of dense water is relatively free to travel north, first plunging off the Antarctic continental shelf and then hugging the bottom as it displaces warmer water. AABW is steered by bottom topography and Coriolis forces and only ceases moving and thus influencing abyssal temperatures when it has reached equilibrium density with surrounding water. Even after traveling some 60 degrees north of its source, density differences are still large enough to drive substantial amounts of AABW past the circulation barrier imposed by the equator, thus permitting diminished but still measurable circulation effects of AABW to be measured in the abyssal depths of the Northern Hemisphere.
A pair of illustrations of Antarctic and Southern Ocean circulation may be helpful in understanding the process of AABW transport.
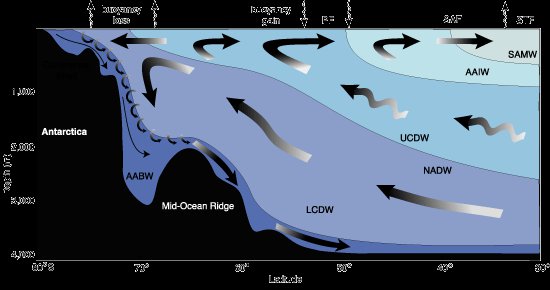
"South (left) to north (right) section through the overturning circulation in the
Southern Ocean. South-flowing products of deep convection in the North Atlantic are converted into upper-layer mode and intermediate waters and deeper bottom waters and returned northward. Marked are the positions of the main fronts (PF, Polar Front; SAF, Sub-Antarctic Front; STF, Subtropical Front) and water masses (AABW, Antarctic Bottom Water; LCDW and UCDW, Lower and Upper Circumpolar Deep Waters; NADW, North Atlantic Deep Water; AAIW, Antarctic Intermediate Water; SAMW, Sub-Antarctic Mode Water)" (Figure 1.9, SCAR "Antarctic Climate Change and the Environment" )
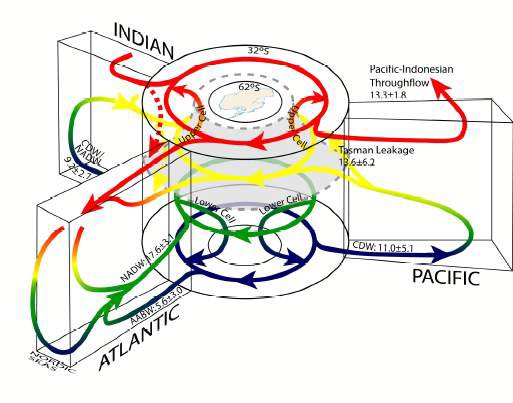
Role of Southern Ocean in global circulation ( Lumpkin & Speer 2007 )
One might wonder, if AABW circulation is driven partly by the relative density of water chilled in the Antarctic, won't distribution of this water change as deep waters warm in response to heating by AABW circulation, thus robbing AABW of some of its physical transport impetus? This does seem to be the case; for instance, the interface between AABW and North Atlantic Deep Water (NADW) has deepened over the past few decades, and as well there are indications of diminished abyssal circulation in regions of the North Pacific influenced by AABW, as would be expected in a scenario where density gradients are diminishing (Johnson 2008, Kouketsu 2008). Numerous other variations in circulation behaviors controlled by thermally induced density variances may be found in Purkey and Johnson. Taken together, these indicators are broadly consistent with changes in the thermal regime of the deep ocean connected with AABW and its source.
It's important to note that to a greater or lesser extent the Southern Annular Mode (SAM) plays some role in controlling changes observed in Purkey and Johnson, not to the exclusion of secular changes outside of the SAM but significant nonetheless. Complications abound in forming an exact assessment of the proportionality of natural versus forced variations; the SAM itself appears to be in a process of adjusting to two anthropogenic influences, ozone depletion and greenhouse gas proliferation.
Beyond shedding enlightenment on a specific research topic, Purkey and Johnson's work suggests some improvements we could make in the level of urgency we attach to exploring our planet. NOAA is working on upgrading our ability to sample deep and abyssal ocean water via robotic instrumentation. As is so often the case, the pace of instrumentation improvements is set in part by budgetary limitations involving amounts of money small in the grand scheme of things. Purkey and Johnson show beyond doubt how vital better observational ability is when it comes understanding our role in shaping the climate; we're effectively blind to enormous changes in the physics of our planet because we won't make paltry expenditures for better "optics," a lamentable and unnecessary condition. Our instrumentational inability to closely track climate change is a general problem; it's truly odd that such a important research topic so crucial to public policy should find itself lacking the equipment to quantify changes nearly everybody agrees present us with multi-trillion dollar risk and decision choices and outcomes.
Officially Off-topic: A Salute to Oceanographers
In terms of effective inaccessibility and remoteness, Earth's oceanic abyssal depths have aptly been compared unfavorably to extraterrestrial space.
For researchers investigating Earth's climate, orbital space is in some ways a far friendlier environment than the oceans. Instruments aboard satellites allow researchers to collect their data while lounging in shirtsleeve comfort, facing nothing more dangerous in the daily routine than slipping and falling while taking a morning shower.
Oceanographers often must wrest their primary information from the ocean, at personal risk, conducting their observations from the pitching, rolling decks of ships with course and speed set for instrument deployment as opposed to comfort and safety, directly exposed to the uncaring vagaries of fickle weather and heavy machinery. Errors in procedure, equipment or vessel failures or even inclement weather may exact the ultimate penalty on oceanographers seeing to the meticulous collection of data, career hazards not faced by many other scientists investigating climate-relate phenomena.
Quite apart from the kinetic drama of working from small ships on the surface of such storied locales as the notoriously stormy Southern Ocean, the sea is also extraordinarily costly in terms of the personal investment of time required to wrest every few hundred kilobytes of data from the cold dark of the bottom. After dealing with a commute of thousands of miles to their laboratory enviroment, scientists are rewarded with brief spurts of information separated by long intervals of plodding, akin to "crossing the ocean at a jogging pace" as NOAA's Gregory Johnson expresses the matter.
For all these reasons, it's worth pausing a moment in appreciation of the fanatical dedication and perseverance needed to collect data of the kind used to produce Purkey and Johnson's paper. The graphs and maps casually flung out in little essays such as the one above inadequately express countless thousands of cold and dripping hours spent in hostile conditions far from hearth and home. True enough it's an all-volunteer army, but recognition of this effort is still due.
Wednesday, March 17, 2010
J. B. Sallée, K. G. Speer & S. R. Rintoul, Nature Geoscience, Zonally asymmetric response of the Southern Ocean mixed-layer depth to the Southern Annular Mode
Nature Geoscience, published online 14 March 2010; doi:10.1038/ngeo812
Zonally asymmetric response of the Southern Ocean mixed-layer depth to the Southern Annular Mode
J. B. Sallée* (CSIRO-CMAR/CAWCR, Castray Esplanade, Hobart 7000, Tasmania, Australia), K. G. Speer (Oceanography, Florida State University, 900 Call St, Tallahassee, FL 32306, U.S.A.) and S. R. Rintoul (CSIRO-CMAR/CAWCR, Castray Esplanade, Hobart 7000, Tasmania, Australia)
Abstract
Interactions between the atmosphere and ocean are mediated by the mixed layer at the ocean surface. The depth of this layer is determined by wind forcing and heating from the atmosphere. Variations in mixed-layer depth affect the rate of exchange between the atmosphere and deeper ocean, the capacity of the ocean to store heat and carbon and the availability of light and nutrients to support the growth of phytoplankton. However, the response of the Southern Ocean mixed layer to changes in the atmosphere is not well known. Here we analyse temperature and salinity data from Argo profiling floats to show that the Southern Annular Mode (SAM), the dominant mode of atmospheric variability in the Southern Hemisphere, leads to large-scale anomalies in mixed-layer depth that are zonally asymmetric. From a simple heat budget of the mixed layer we conclude that meridional winds associated with departures of the SAM from zonal symmetry cause anomalies in heat flux that can, in turn, explain the observed changes of mixed-layer depth and sea surface temperature. Our results suggest that changes in the SAM, including recent and projected trends attributed to human activity, drive variations in Southern Ocean mixed-layer depth, with consequences for air–sea exchange, ocean sequestration of heat and carbon, and biological productivity.
*Correspondence e-mail: jbsallee@gmail.com
Jean-Baptiste Sallée: Southern Annular Mode -- winds over the Southern Ocean increasing in strength, shifting closer to Antarctica in recent decades
Southern Ocean winds open window to the deep sea
CSIRO, March 15, 2010 — Australian and US scientists have discovered how changes in winds blowing on the Southern Ocean drive variations in the depth of the surface layer of sea water responsible for regulating exchanges of heat and carbon dioxide between the ocean and the atmosphere.
The researchers' findings -- published in Nature Geoscience -- provide new insights into natural processes which have a major influence on the rate of climate change.
The surface-mixed layer is a crucial pathway between the atmosphere and the deeper layers of the ocean. Changes in the depth of the mixed layer can affect air-sea exchange, carbon and heat storage in the ocean, and the rate at which water sinks from the surface ocean into the deep ocean.
Changes in the mixed layer also affect biological productivity, by altering how much light and nutrients are available to support growth of plankton at the base of the food chain.
The paper's lead author, CSIRO Wealth from Oceans Flagship oceanographer Dr Jean-Baptiste Sallée, said the winds over the Southern Ocean had increased in strength and shifted closer to Antarctica in recent decades.
"The shift in winds is one of the strongest trends in southern hemisphere climate over the last 30 years," Dr Sallée said. "The key question is; 'How does the wind change affect the ocean?'
"Our knowledge of how the Southern Ocean changes in time is poor because of the lack of ship-based observations in this remote region. But we now have seven years of year-round observations from a fleet of profiling floats known as Argo, which allow us to see for the first time how the Southern Ocean changes with the seasons and from year-to-year."
The researchers, including Dr Steve Rintoul from the Antarctic Climate and Ecosystems CRC and CSIRO and Professor Kevin Speer from Florida State University, examined the relationship between changes in wind and changes in the surface-mixed layer.
"We found that the depth of the mixed layer was more sensitive than we expected to a wind pattern known as the Southern Annular Mode, the major mode of variability of the southern hemisphere atmosphere," Dr Sallée said. "Even more surprising was the fact that the response is very different in different regions."
When the winds strengthen and contract closer to Antarctica, the surface-mixed layer deepens in the eastern Indian and central Pacific oceans, and shallows in the western part of these basins. The reverse is seen when the winds weaken and migrate north.
The asymmetry can be explained by small deviations in the generally west-to-east winds and their effect on the heat exchange between ocean and atmosphere: when cold winds blow from the south, this causes heat loss from the ocean and deeper mixed layers.
"These changes in mixed layer depth affect how much light is available to support the growth of phytoplankton. We found that changes in the mixed layer depth driven by the winds are associated with changes in the amount of phytoplankton biomass," Dr Sallée said.
Link: http://www.csiro.au/news/Southern-Ocean-winds-open-window-to-the-deep-sea.html
Wednesday, September 30, 2009
Marco Tedesco & Andrew J. Monaghan, GRL (2009): An updated Antarctic melt record through 2009 and its linkages to high-latitude and tropical climate variability
Geophysical Research Letters, 36 (2009) L18502; doi: 10.1029/2009GL039186.
An updated Antarctic melt record through 2009 and its linkages to high-latitude and tropical climate variability
Marco Tedesco (Earth and Atmospheric Sciences, City College of New York, New York, NY, U.S.A.) and Andrew J. Monaghan (National Center for Atmospheric Research, Boulder, CO, U.S.A.)
Received 13 May 2009; accepted 12 August 2009; published 24 September 2009.
Abstract
A 30-year minimum Antarctic snowmelt record occurred during austral summer 2008–2009 according to spaceborne microwave observations for 1980–2009. Strong positive phases of both the El-Niño Southern Oscillation (ENSO) and the Southern Hemisphere Annular Mode (SAM) were recorded during the months leading up to and including the 2008–2009 melt season. The 30-year record confirms that significant negative correlations exist at regional and continental scales between austral summer melting and both the ENSO and SAM indices for October–January. In particular, the strongest negative melting anomalies (such as those in 2008 and 2009) are related to amplified large-scale atmospheric forcing when both the SAM and ENSO are in positive phases. Our results suggest that enhanced snowmelt is likely to occur if recent positive summer SAM trends subside in conjunction with the projected recovery of stratospheric ozone levels, with subsequent impacts on ice sheet mass balance and sea level trends.
(2009), An updated Antarctic melt record through 2009 and its linkages to high-latitude and tropical climate variability, Geophys. Res. Lett., 36, L18502; doi: 10.1029/2009GL039186.
Link to abstract: http://www.agu.org/pubs/crossref/2009/2009GL039186.shtml
Link to abstract: http://www.agu.org/pubs/crossref/2009/2009GL039186.shtml
Thursday, July 9, 2009
Australian Dept. of Climate Change report: Faster Change & More Serious Risks by Will Steffen
Dorothy Cutting, Director, West Coast Climate Equity, sent the link to this 60-page pdf file, which is a report by the Australian Government Department of Climate Change, entitled:
This is what she had to say:
"This is a stunning report. How unnerving it is to see climate data from a different perspective; there are so many slides so new to me. A picture being well worth what it is, I’m stalled on the shocking image of projected temperature anomalies in France, the Ukraine and the Sahel. I’ve seen the numbers, of course, but this slide gives this data so much more impact."
Page 5, Figure 1c shows sea level rise.
Page 6, Figure 2a shows rising CO2 correlated with decreasing sea ice.
Lots of figures showing increasing temperatures and droughts.
Figure 23 shows the projected summer temperatures for various geographic locations, like Europe and the Ukraine -- not pleasant reading at all.
From page 32:
"Some of the most striking advances in climate change science over the past three to four years have been made by taking a systems perspective, in which interactions among components of the climate system and feedback processes that highlight potentially important second-order effects have been elucidated.
An example is research on the links between climate change and the Hadley Circulation, and the
implications of these links for storm tracks, regional precipitation patterns, and modes of natural variability such as the El Niño – Southern Oscillation (Frierson et al. 2007; Lu et al. 2008; Seidel et al. 2008). Much of this new work points in the same direction – that as the 21st century progresses, system-level effects will increasingly amplify rather than dampen the human
perturbation of the climate system."
Page 33, Figure 37 shows the Northern Hemisphere and geographic concentrations of permafrost -- yikes!
Anyway, my words cannot describe all of the very well-portrayed information in the many figures. The report is highly readable -- just takes a bit to download, but well worth it.
This report tells it all, very clearly.
This is what she had to say:
"This is a stunning report. How unnerving it is to see climate data from a different perspective; there are so many slides so new to me. A picture being well worth what it is, I’m stalled on the shocking image of projected temperature anomalies in France, the Ukraine and the Sahel. I’ve seen the numbers, of course, but this slide gives this data so much more impact."
Page 5, Figure 1c shows sea level rise.
Page 6, Figure 2a shows rising CO2 correlated with decreasing sea ice.
Lots of figures showing increasing temperatures and droughts.
Figure 23 shows the projected summer temperatures for various geographic locations, like Europe and the Ukraine -- not pleasant reading at all.
From page 32:
"Some of the most striking advances in climate change science over the past three to four years have been made by taking a systems perspective, in which interactions among components of the climate system and feedback processes that highlight potentially important second-order effects have been elucidated.
An example is research on the links between climate change and the Hadley Circulation, and the
implications of these links for storm tracks, regional precipitation patterns, and modes of natural variability such as the El Niño – Southern Oscillation (Frierson et al. 2007; Lu et al. 2008; Seidel et al. 2008). Much of this new work points in the same direction – that as the 21st century progresses, system-level effects will increasingly amplify rather than dampen the human
perturbation of the climate system."
Page 33, Figure 37 shows the Northern Hemisphere and geographic concentrations of permafrost -- yikes!
Anyway, my words cannot describe all of the very well-portrayed information in the many figures. The report is highly readable -- just takes a bit to download, but well worth it.
This report tells it all, very clearly.
Subscribe to:
Posts (Atom)

 Posts
Posts






