On thin ice: The world's two greatest ice sheets are melting faster than anyone believed possible

Perito Moreno glacier at los Glaciares National park in Santa Cruz, Argentina.
by Ben Wallace-Wells, Rolling Stone, September 22, 2010
I. Ice
On July 18th, 2005, around four in the morning, a research ship called the Arctic Sunrise was slowly making its way south along the eastern coast of Greenland. It was already bright out, and very still. An ice scientist named Gordon Hamilton stood on deck, watching the rocks and eddies along the water's edge. The rest of the crew was still sleeping below. There was a helicopter on the deck, painted bright orange so it could be spotted easily if rescue were needed, and Hamilton saw its pilot, the only other person awake so early, coming down a nearby staircase. They had plans to fly to a massive glacier called Kangerdlugssuaq later that afternoon, to measure its speed and to see whether the warming climate had forced this part of the world into dramatic changes. The pilot asked if Hamilton wanted to take a quick flight over to the glacier now, to scout out a good landing spot. "Sure," Hamilton said. He went below deck to collect his maps.
Most of the ice in the world is contained in two great, ancient ice sheets, each of them the size of a continent: One covers Antarctica and the South Pole, and the other, not nearly as big, covers Greenland. Both of these formations slope gently from high interiors down to the coast, with ice edging outward in vast frozen rivers known as glaciers. Snowfall at the top of the slopes presses down on the glaciers, helping gravity propel them toward the edges of the continent. There, when it meets the warmer water, some of the ice melts slowly into the ocean. Until a few years ago, scientists like Hamilton thought of the ice sheets as changing only imperceptibly, on the time scale of centuries. But as the planet has warmed, they have come to see the ice as far more volatile and nimble. The ice sheets no longer seem static; they are mysterious, complicated dams that help hold back entire continents, keeping coastal cities free from flood. If you understand the ice sheets, and how they might melt, you can understand the future of the oceans — how much they might swell, and on what schedule. And if you understand the oceans, you might be able to get a more accurate fix on the future of the world's coasts, and of the civilizations they hold.
Hamilton and the pilot took off from the ship's deck and flew toward the coast, heading for the fjord where Kangerdlugssuaq empties into the ocean. At the time, ice scientists were trying to resolve a strange and disturbing anomaly. A glacier called Jakobshavn Isbrae — the largest in Greenland, on the other side of the continent from Hamilton's ship — had begun to thin rapidly, according to recent data collected by NASA, and to send far more ice into the sea than was normal. Nobody knew exactly what to make of this. If some change in the climate was responsible, then this accelerated melting should have shown up at other glaciers, but so far it hadn't. Hamilton had with him a sketch based on satellite images of Kangerdlugssuaq taken 10 months earlier, and it showed that the normal processes here were in balance. The glacier seemed to be at equilibrium.
As the helicopter headed toward the coordinates on the glacier where Hamilton wanted to land, he gazed out the window. His mind drifted absently across the landscape. The steep rock of the fjord rose above the dark, pooling water below, the glacier still miles upstream. Suddenly, Hamilton was startled out of his grogginess by a squawking in his headphones: The pilot was trying to tell him something. Hamilton asked the man to repeat himself. "We're here," the pilot said.
Hamilton looked down. They were over open water. The glacier had vanished.
Confused, Hamilton picked up the satellite image. Perhaps he had given the pilot the wrong coordinates. In the sketch, he could see two tributary glaciers that emptied into Kangerdlugssuaq right where he had wanted to land. He looked out the window. There were the two tributary glaciers. But they were emptying into the sea. In the few months since the image had been taken, the front end of Kangerdlugssuaq had disappeared. "It was here for more than 50 years," Hamilton says. "And now it was gone."
Returning to the Arctic Sunrise, Hamilton found the graduate student who was working with him, Leigh Stearns, and asked her to return to the glacier with him. On the way, he was purposely vague about what he'd seen; he still thought he might have missed something. Now, flying through the fjord a second time, Hamilton saw evidence of the disappeared glacier that he had missed earlier that morning. Along the sides of the fjord, like a ring on a bathtub, were icy smears that had been left on the rock when the glacier calved into the water. Higher up, he could see dirt mounds that suggested how high the missing glacier had risen. This section of Kangerdlugssuaq had vanished in only 10 months — a pace most scientists had thought impossible. Perhaps the ice sheets weren't battleships, massive and inert, but catamarans, nimble, bending to the wind. The question now was, how fast were the glaciers moving?
The answer, Hamilton knew, could have profound implications for the world's coasts. A report being put together at the time by the U.N.'s Intergovernmental Panel on Climate Change, a collection of the world's leading climate experts, estimated that global sea levels would rise no more than a foot and a half in the next century. But over the past five years, as more discoveries like Hamilton's have emerged, those numbers have come to seem obsolete. "The estimates are now clustering around a rise in sea level of three feet by the end of the century," says Richard Alley, a geoscientist at Pennsylvania State University — double the previous estimates. "Nature has begun to resolve some of these arguments for us." The new science indicates that by the end of the century, rising seas could turn as many as 153 million people into refugees. Most of New Orleans, and large swaths of Miami and Tampa, are likely to be underwater, along with some of the world's largest cities: Manila, Lagos, Alexandria. A full quarter of the developing world's coasts will be battered by more frequent hurricanes and tsunamis; roughly half of Bangladesh, a country of 160 million people, will be subject to regular flooding. If Hamilton was right, then within the ice sheets something truly cataclysmic had begun.
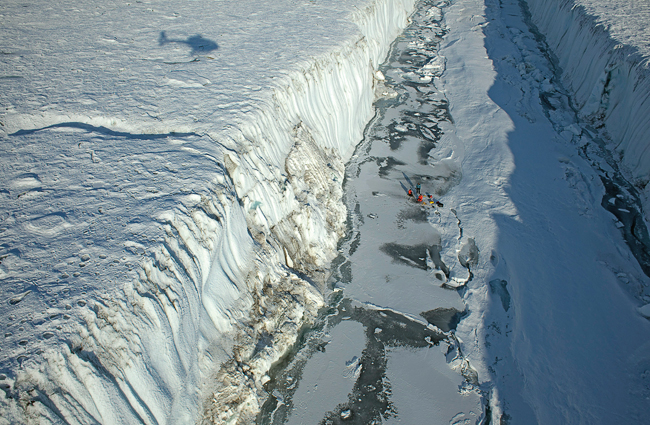
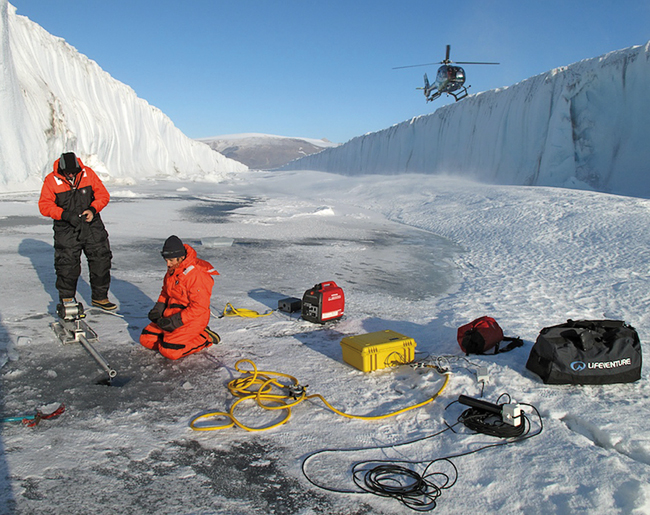
Flying over the water where Kangerdlugssuaq once stood, Hamilton and Stearns found the new edge of the glacier, sliding furtively down between a pair of hills. Once the pilot spotted a stable landing spot and touched down, they worked quickly. With an electric drill, they bored a hole into the ice and dropped a pole into it, with a small GPS receiver mounted on top. Then they flew off, found another steady landing spot and repeated the process. By the end of the afternoon they had installed six receivers along the glacier's edge, enough to get an idea of the ice's overall speed.
Back on the ship, Hamilton collapsed onto his bunk, exhausted. Stearns opened her laptop and started downloading data from the monitors. When she was done, the speed was so implausible that she checked her calculations five times to make sure she had the math right before she showed her boss. Kangerdlugssuaq, when it was stable, moved toward the sea at a rate of about three miles a year. Now, Stearns' calculation showed, it was moving nearly nine miles. "It was faster than any glacier had ever been measured," Hamilton says. "We hadn't thought glaciers could achieve those speeds." The continent was shifting, the planet shrugging its shoulders, sending the edges of the ice sheet racing into the sea.
II. Glacier
Over the next century, strange as it is to contemplate, the Earth's surface will be forcibly reshaped by those parts of the planet that remain the most inaccessible and the least understood. The ice sheets of Antarctica and Greenland are so barren and unbroken that they seem more like geometric abstractions than continents. They impose on visitors a near-total sensory deprivation. Because there is virtually nothing living — no trees, no grass, no animals — there is nothing to smell. Even time is distended at the poles: Scientists are generally able to come only at the height of summer, when it is light for nearly 24 hours a day, and they find their workdays slipping later and later into the night. From the interior of an ice sheet, the arc of the horizon is so long and so constant that you stop fully registering the empty landscape, and you focus on the only things that change, which are the clouds. When one drifts past, you imagine it as a more permanent formation — a rock outcropping or a distant mountain. Three weeks or so on the ice sheet is as much of this isolation as most glaciologists can take, and so they race against that limit, science against time.
Ice is a curiously fragile substance; the tiniest shifts in its surroundings — the temperature and pressure of the air, the salinity of the frozen water — can trigger fundamental transformations. "Much of the ice in the world is quite close to a phase change," says Joel Harper, a professor of geosciences at the University of Montana. "It doesn't take much to move it from solid to liquid." At times, these changes can seem the product of the ice's interior will. When a glacier, moving downhill, encounters a small obstacle — a rock a few inches across — it simply melts, allowing it to pass over the stone, then refreezes on the downstream side. When it encounters a large obstacle — perhaps a boulder the size of a house — the ice deforms so that it can move around the rock like a syrupy liquid would. Years later, you can still see in the ice the marks of this change.
Changes like these are almost never witnessed by humans; on the rare occasions when they are observed, they become legends, told and retold. Glaciologists still talk about the moment in 1983 when scientists on top of Variegated Glacier, in Alaska, watched the ice beneath their feet dissolving into a web of small stream in the space of a few minutes. In 1995, Harper and his team drilled a bore hole into the ice in Alaska's Worthington Glacier. A few nights later, they awoke to a rumble as loud as a 747; an unseen lake had quietly drained, migrated and then exploded through the bore hole, sending a geyser hundreds of feet into the sky.
The ice sheets are such unique workshops that glaciologists must invent their own tools and experiments each time they arrive. You can measure the speed of glaciers by tossing dark rocks onto moving ice and tracking them with surveying equipment from a nearby rock outcropping. You probe the interior of glaciers by jerry-rigging a jet of hot water (a home heater, a pressure pump and a long flexible hose) that drills down into the ice sheet, melting a perfect vertical bore hole. You track the snow that has accumulated, from one year to the next, by using a coffee can, a GPS and a length of wire. But technical discoveries like these were lucky accidents, and they provided only partial glimpses along a glacier's edge. No one knew what the entire ice sheet was doing; its most essential changes were hidden beneath those vast blocks of ice, unseen.
That began to change in 1978, when scientists sent a satellite hurtling around the Earth to map the extent of ice in Antarctica and Greenland — what was frozen and what was open sea. NASA engineers, working from a half- decommissioned rocket-launching base on a barrier island in eastern Virginia, also rigged an old naval patrol plane with lasers and GPS, to record how high the ice was at certain points and how far it extended. By mapping the ice grid by grid, and tracking any changes over the years, they could begin to see, for the first time, the workings of the ice sheets.
As the contours of climate change have started to come into focus, glaciologists — a tiny band of scientists in a long-neglected field — have suddenly found themselves briefing Congress, consulting with the United Nations. Perplexed graduate students, stuck in the field in Greenland, were asked to educate visiting dignitaries. The dawning realities of global warming made it evident that one of the gravest threats facing the planet depended upon a field of science that most people had never even heard of. "How fast will the ice sheets lose their mass into the sea?" asks Peter Clark, a professor of geosciences at Oregon State University. "That's the million-dollar question."
Searching for answers, scientists soon focused their attention on the largest glaciers, whose leading edges are hundreds of feet thick and many miles wide, floating mostly submerged in the water. Some glaciologists were beginning to believe that these ice shelves act like corks in champagne bottles, keeping the gigantic rivers of ice behind them from flowing into the sea. If an ice shelf was somehow removed, they argued, the glacier behind it could slide out into the ocean, far more quickly and catastrophically than had been imagined. The data from the thinning glacier in Greenland was particularly alarming. "It looked like we might be loosening the cork," says Bob Thomas, who ran the polar science research program for NASA.
But most scientists disagreed with the cork theory. The prevailing model held that if the ice shelves were removed, the glaciers behind them would stay in place, kept there by the friction between the ice and the rocky trough in which it sat. The question was impossible to resolve in the abstract, however, and so for years it just hung there as a hypothetical, a suggestion at the edges of science, a conversation point when glaciologists were in their second week in the desolate, frozen field and were looking for things to talk about. What was missing was a test case — a place where the cork had been removed. Scientists doubted that nature would ever provide a conclusive demonstration. Then one day — in a dramatic display at the southernmost reaches of the planet — it did.
III. Air
The Antarctic peninsula is a long, skinny curve of rock, and it reaches north toward the tip of Chile, like a gnarled finger beckoning you toward the pole. In October 2001, still spring on the peninsula, an Argentine glaciologist named Pedro Skvarca was on top of an ice shelf known as Larsen B doing fieldwork. Research in Antarctica imposes a special form of isolation; even in summer, scientists must surround their tents with snow banks to keep out the wind. The Argentines have a permanent base on the peninsula, and Skvarca had spent more time on Larsen B, and knew it more intimately, than nearly any other scientist.
Over the years, as he visited the ice shelf, Skvarca had watched the entire landscape change. Huge crevasses had opened up, rifts in the ice, the biggest among them visible from orbiting satellites. Skvarca found himself surrounded by meltwater, ponds of shimmering blue water up to 100 feet across. He could barely get any work done safely: Each time he pitched a tent it filled with water. This year, the melting was far more extensive. The ponds were most numerous in the north, where the weather was warmest, but they had spread out across the entire ice shelf. If Larsen B was a cork, then it looked like it was about to come unstuck. When he returned to the Argentine base, Skvarca e-mailed several of his colleagues in the United States and Europe. "I think this is it," he wrote.
Scientists had been worried about this portion of the peninsula for years. Over the past half-century, temperatures in this part of Antarctica have leapt by five degrees, and wind speeds have increased by 15 percent. Climatologists believe that the amount of carbon in the atmosphere and the size of the ozone hole control the winds like a dial: The more we've warped the climate, the faster the winds blow. At Larsen B, the combination operated like a convection oven, baking the ice each summer and melting it from above and below. "The stronger winds push more warm air over the peninsula," says John Turner, project leader for climate variability and modeling with the British Antarctic Survey. "It's been the nail in the coffin."
During the first week of March 2002, a few months after Skvarca sent his e-mail warning, Larsen B was obscured by clouds for several days; it was so overcast that orbiting satellites couldn't get a good image of the area. When the clouds parted, on March 5th, and the satellites could see through again, the scientists stared at the images in disbelief. Nearly two-thirds of Larsen B, an ice shelf the size of Delaware, had disappeared into the sea. The glaciers of the peninsula had come uncorked, altering the shape of Antarctica's map in only a few days. "How rapidly and completely Larsen B broke was beyond our imagination," says Ted Scambos, lead scientist at the National Snow and Ice Data Center in Boulder, Colorado.
Since then, scientists have pieced together an extremely detailed model of how Larsen B shattered, bit by painstaking bit. The ice shelf, they believe, was so profoundly weakened from years of melting that it would have taken only a small disturbance at the water line — likely a wave of precisely the right amplitude — to rock the shelf back and calve off a long, narrow iceberg, sending it toppling into the water. The splash of that first berg rebounded against the edge of the shelf, in waves as high as a tsunami, breaking off a second iceberg, along the cracks opened up by the water, and the second berg begat a third. "It's like what happens in a mosh pit, where you have a chain-reaction feedback of energy," says Doug MacAyeal, a geophysicist at the University of Chicago who has studied Larsen B. Before long, a huge semicircle of water was rushing into the opening left behind by the ice shelf — moving inland at a rate of more than a dozen miles a day. "It looked like a giant disintegration machine had started eating into the ice sheet," Scambos says. "Here was unequivocal evidence of something happening because of climate change — and I think it really scared a lot of people."
A few days later, at the end of March, a British research ship sailed to the edge of the harbor, still too choked with bergs to actually enter. From the deck, a group of oceanographers took in the scene: The collapse of Larsen B had left behind exposed ice cliffs hundreds of feet high, so blue and so precisely angled that they looked almost unnatural, as if they'd been cut by a giant buzz saw. The physics had been so intense that the ice was shattered into pieces as tiny as gravel. Humpback whales occasionally drifted into these waters, but the scientists, looking around, saw that the sea was packed with them, drawn by the reverberating energy of the collapse, breaching everywhere they looked. With Larsen B gone, it seemed that one of the most enduring questions in glaciology might now be solved: What happens when you remove an ice shelf? Would the large glaciers that had once snaked down to Larsen B from the continent rush into the sea, like uncorked champagne? Or would they stay put, held in place by the rocks below?
Satellites over Antarctica don't work well in the lightless winter, so it took until the next spring — late October, early November — for photos to appear. Soon scientists were rushing to get papers into print about the glaciers behind Larsen B. Satellites examining one of the main tributaries of the ice shelf, Crane Glacier, showed that not only had the edge of the glacier begun to race rapidly toward the ocean, but that the speedup was taking place much farther inland than expected. Even more remarkably, the Hektoria Glacier, the largest river feeding ice into Larsen B, the largest had dropped in height by more than 80 feet in just six months. The leading edge of the glacier had slid out into the sea, its front decomposing from smooth ice to crunched, crevassed fragments, like stretching toffee. In more normal times, a drop in elevation of just a few feet had been considered big news.
"What we were able to see at Hektoria and at Crane was that the ice shelves do, in fact, have a huge impact on the glaciers behind them," says Scambos, who led one of the two scientific teams analyzing the data. "They are the Achilles' heels of the ice sheet." Nature, as glaciologists say, had provided the perfect experiment at Larsen B and resolved the debate: Remove the ice shelves, and the glaciers behind them would go racing for the sea.
Larsen B was, by geological standards, a vast formation of ice, but it is dwarfed by much larger ice shelves farther south, on the main part of the Antarctic continent. Unlike Greenland, which holds a small society, Antarctica is a planetary lockbox, a third the area of the moon and nearly as remote; it only holds ice. The ice sheets on both sides of the continent contain huge amounts of ice that lay below sea level — in West Antarctica alone, enough to raise global seas by more than 10 feet. A single shelf — the Ross Ice Shelf, the world's largest — is the size of France. "The lesson of Larsen B," Scambos says, "is that if you remove an ice shelf, then you will quickly tap deep into the center of the ice sheet."
Still, scientists weren't too worried that the glaciers behind the biggest ice shelves would rush into the ocean. Larsen B had been removed by sustained melting from a warmed atmosphere, a process almost impossible to imagine further south, where air temperatures never warm past the freezing point. So Antarctica was safe. Or it was so long as nature, evolving, didn't find some other way to remove the remaining ice shelves.
IV. Ocean
You don't have to spend much time in the company of ice scientists before you notice a marked generational divide. Those older than 50 got into the field when you needed to be a mountaineer to conduct meaningful research — to travel to the globe's end, to stick a pole in the ground and to suffer through brutal weather while the data accumulated. But the most profound insights, over the past decade, have come from satellite data. "Remote sensing technology has become so powerful that it allows us to observe the ice sheets in ways that would be impossible to replicate in the field," Eric Rignot, senior research scientist at the Jet Propulsion Laboratory, says with a hint of triumph. The younger ice scientists seem less like explorers and more like mathematicians. The new aim is to build a computer model that more perfectly mimics the Earth; if you take 10 graduate students in glaciology, each of them will be eager to go into the field, but only two or three will have the mathematical brain to synthesize the data. The older ice scientists always thought about ice — where it forms, how it moves, its fundamental properties and underlying mechanics. The younger ones are trained to think in terms of climate. And if you are thinking about the climate, you consider everything.
David Holland, director of the Center for Atmosphere Ocean Science at New York University, falls firmly on the modern side of this divide. Holland started out as an academic by building mathematical models of the movements of oceans, but slowly, over time, he found himself drawn to the rhythms of fieldwork — the adventure and the engineering challenge. Holland, who has a clipped Canadian accent, is ironic and contrarian. He grew up in Newfoundland, raw country strafed by the storms of the Labrador Sea; there are holes along the cragged coast where the same molecules of water have lain for hundreds of years, too dense and salty to get out. It is a place that impresses upon you the power of the ocean to shape the land and the society built there.
In 2006, Holland got a call from Bob Thomas, who ran NASA's polar science division. Something was bothering Thomas about the Jakobshavn Glacier in Greenland. Since scientists had documented the glacier's speedup, the assumption had been that its cause was the warming climate, which had melted pools of water on top of the ice sheet. That meltwater, the theory went, had drained through to the bottom of the ice and lifted the glacier off its rocky bed, sending it rushing to the sea, as slick and purposeful as a python.
But Thomas had spent nearly a decade studying Jakobshavn, had noticed something else. The glacier hadn't just sped up. The edge of it that lay in the water, the floating ice tongue, had thinned dramatically. At the time, thinning of a few feet a year was considered remarkable. Jakobshavn was thinning by more than 250 feet a year. The meltwater alone couldn't account for that much thinning. Something else must be helping to melt the glacier. What separated the ice tongue from the rest of the glacier, Thomas observed, was that it lay in the ocean. What if the key change hadn't happened on top of the ice sheet but beneath it? What if the larger problem wasn't warm air attacking the ice sheet from above but the ocean swallowing it from below?
NASA's satellites can't penetrate salty water, so Thomas couldn't see what was happening underneath the glacier. Was there a way, he asked Holland, to get into the polar fjord off Disko Bay where Jakobshavn's thinning tongue was bathing, to measure the water there and to see if something had changed?
Holland and Thomas talked through the problem. Even in summer, the fjord is too clogged with icebergs for a ship to get in. Thomas suggested giving instruments to the natives who went out on the ice by dog sled, digging holes to fish for halibut.
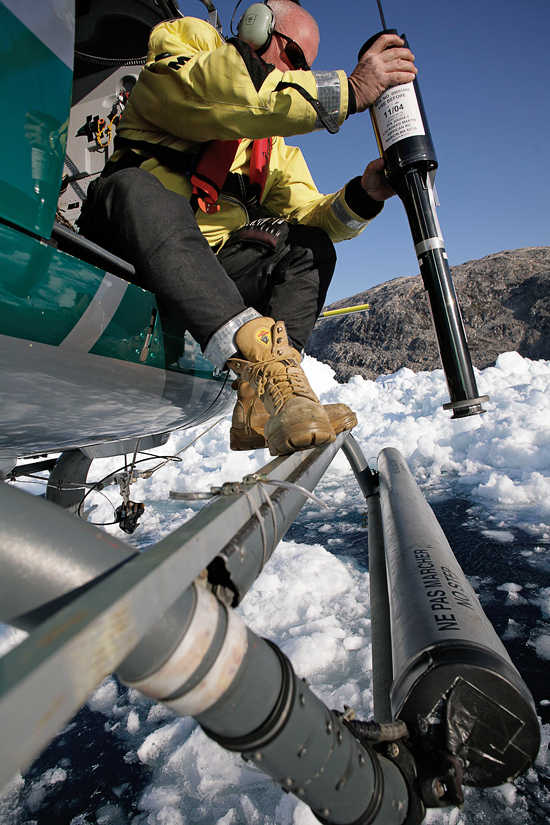
Holland had a better idea. In Ilulissat, a nearby town, he rented a helicopter and had the pilot fly over the fjord, dropping down low to clear a hole of ice with wind generated by the whirring rotors. Then, as the helicopter hovered 500 feet above the water, Holland leaned out the side and released a small metal probe, the size of a can of Coke. Sometimes he missed the hole, and the probe stuck in the surface ice, its small parachute flopping in the wind. But when he managed to drop the probe into the water, it left an FM radio transmitter on the surface before sinking to the bottom of the fjord, sending back temperature, salinity and depth readings as it went. Holland got the readings on his laptop instantly. In most places in Greenland, he knew, the water was about 34.7 degrees. But everywhere he looked in the fjord, it was 37.9 degrees. "For a glacier," Holland says, "that's absolutely intolerable."
The unexpected thing about the oceans is that their movements are as regular and fixed as subway lines. The physics of the atmosphere conspire to sort water into giant bands called currents — each hundreds of feet deep and thousands of miles long — which share the same temperature and salinity. Like subway lines, ocean currents may pass over or under one another, but the water inside one seldom mixes with another. When a buoy in Greenland detects that the water passing by is slightly saltier and slightly warmer than it has been for decades, it doesn't just mean that some water has sloshed around in the bay. It means that something more fundamental has changed: An entire subway line has moved. If Holland was right — if the ocean was responsible for melting Jakobshavn — then the threat extended far beyond Disko Bay. Warm air alone would never melt Antarctica. But if warmer water could find its way to Greenland and destroy the ice shelves, it could do the same in Antarctica, the world's great lockbox of ice.
When he returned from Greenland at the end of the summer, Holland and some colleagues built a computer model to try to predict how much ice the warmer water from Disko Bay might melt. In each experiment, the model produced melting rates of more than 250 feet a year — the same amount of thinning that Thomas had observed by satellite. "Now we knew that it was the oceans that were driving the ice," Holland says. "And the question became, what is driving the oceans?"
That winter, by e-mail and phone, Holland and a few other scientists tried to find all the data they could on the waters around Disko Bay. When, precisely, had it gotten warmer? They had little luck. Then a Danish oceanographer named Mads Ribergaard mentioned another source of data. For two decades, as fishermen trawled for cod and shrimp along the bottom of the continental shelf in Western Greenland, as much as 2,000 feet below the surface, they had attached small sensors to their nets that measured temperature and salinity, and then returned the sensors to the Greenland Institute of Natural Resources, which was using the data to build a record. When Ribergaard and Holland assembled the data, they noticed a single, stunning change. During the early years of the program, the temperatures at the mouth of Disko Bay were steady, at about 34.7 degrees. Then, in 1997, the temperature jumped, to 37.9 degrees, and stayed there. The next summer, the speedup at Jakobshavn had begun. "To see a graph like that is very rare in ocean science," Holland says.
Holland looked more closely at the data set. He could see in the records that this pulse of warm water had crept north during the summer of 1996. This was, he knew, a branch of the Gulf Stream called the Irminger Current — very heavy, very warm water that usually cycled back into the North Atlantic far south of Disko Bay. But in 1997 something had changed; instead of turning back, this pulse of warm water had crept along the Greenland Shelf, farther and farther north. In other places in the fisheries data, you could see oblique references to this pulse: One species of cod, which favored warmer waters, began appearing in unprecedented numbers up the coast, and another species, which prefers the cold, was retreating. Something had changed the Irminger Current.
There is an international set of weather data that has been building for 50 years, composed of wind patterns collected by ships crisscrossing the sea and weather balloons launched at airports. Scientists have subjected this data to a rigorous analysis, plugging it into massive computers to build a model of the Earth's wind field over time. It is a clean model, beautiful in its simplicity, the best that climatologists can construct. Among many other features, it provides a record of the North Atlantic Oscillation, a mysterious element of the climate that governs the power of the winds that blow across the North Atlantic, from west to east: For 10 years or so, those winds will be strong, and then in the course of a month, they will inexplicably shift to weak and may stay that way for another decade.
It took Holland only a few minutes of paging through the records to discover what he was looking for. In December 1995, the oscillation changed, and the winds suddenly shifted from strong to weak. By the next summer, the Irminger Current had crawled so far north that it was just outside Disko Bay. The summer after that, the ice at Jakobshavn was racing for the sea. "It's all right there," Holland says. "That's how it works. The atmosphere controls the ocean. The ocean controls the ice. You could see it right in front of you."
On a recent afternoon, Holland sat in his office at NYU, overlooking Washington Square Park. He had just come back from a month in Antarctica, where he had gone hoping to install a weather station and some GPS devices on Pine Island Glacier, one of the continent's largest rivers of ice, already moving rapidly through its basin, already thinning at its edges. It had been a frustrating trip. Antarctica is a complicated logistical operation, run by the National Science Foundation and the U.S. military, and day after day Holland had sat at an airfield, waiting for a flight to the glacier's edge. One day the planes couldn't fly because of the storms. The next, a fuel pump was broken, and they had to wait for new parts. Then the pilots had to take a rest day. After a month of waiting, Holland wound up spending only four hours on Pine Island Glacier.
The experience made him sensitive to the limits of polar exploration. As he sees it, the oceans themselves are resistant to clear descriptions of cause and effect, and some of the most essential questions remain shut inside black boxes: How fast does the wind blow in the seas that surround Antarctica? How will ocean currents respond to the changing climate? We don't know, because the effort to figure it out has been spotty; too many of the critical spots in Antarctica haven't even been mapped. If we took the problem seriously, Holland thinks, then science wouldn't be delayed a year because a plane in Antarctica had a broken fuel pump, the scientists stranded in a base camp, anxiously watching the winds.
"Let me show you this," Holland says. He has Google Earth up on his computer screen, and he rotates the satellite photos so we are looking at a tiny outcropping on the coast of Antarctica. "This is called Sulzberger Ice Shelf, after the publisher of The New York Times," he says. "We know there's warm water here, warm enough to kill an ice shelf." He traces his fingernail across the screen, to the right. "Thirty miles away is the Ross Ice Shelf — the largest in the world," he says. If it were to flow into the ocean, the Ross would release enough ice to alter the shape of the world's map.
There are two alternatives at the Sulzberger shelf, Holland explains. "Either the warm water stays where it is," he says, "or the warm water moves. You could say, 'The warm water's been there a long time, and it hasn't come in yet, so it's unlikely.' On the other hand, we are changing the ocean's circulation in ways that we don't understand and whose consequences we aren't prepared for." The unique feature of Antarctica, he points out, is that much of the ice lies on bedrock that has always been beneath sea level. "It's a question," he says, "of whether the ocean wants its territory back."
V. Coast
In 1981, a glaciologist at the University of Maine named Terry Hughes was examining the data that had emerged from the first, crude attempts to map Antarctica, and in particular its more vulnerable part. The West Antarctic Ice Sheet, these surveys found, contained three large drainage basins. Two of them ended in vast ice shelves, thick fists of ice as big as countries, which acted as corks, limiting the rate at which the interior of the continent flowed out into the oceans. But the ice shelf at the third portal, the Amundsen Sea Embayment, was very weak — not a broad fist of ice but a few skinny knuckles jutting out above the waterline. Hughes published a paper pointing this out, and he called the area the "weak underbelly" of West Antarctica. If climate change were ever to disintegrate Antarctica, he theorized, it would begin at the Amundsen Sea, by releasing the largest glacier that flowed into it, the Pine Island Glacier. This, he thought, this was the place.
For more than a decade, Pine Island has been accelerating, and it is now racing toward the sea: 2.6 miles a year, 38 feet a day, more than a foot an hour, 10 times the rate of the other large Antarctic glaciers. Because of these speeds, Pine Island is the first of the great Antarctic glaciers to begin disappearing. And so, slowly, glaciologists have begun to incline their attention here, to look, in Pine Island, for hints of how much of Antarctica might be at risk.
Pine Island Bay was named for an exploratory naval ship that was sent to Antarctica to help map the Amundsen Sea coast in 1947. The storms here are so regular and so violent that only one scientist has walked on the floating edge of the glacier: a NASA glaciologist named Bob Bindschadler, who touched down three Januaries ago on snow so tightly packed that the airplane's skis, as they carved a momentary runway, left almost no mark. ("As close to concrete as any snow I've ever stood on," Bindschadler recalls.) It was an impossibly still day, barely any wind at all. He spent 20 minutes on the glacier, then had to leave. The weather was too rough for another landing, and neither he nor anyone else has been back since. The basin that flows into the glacier is very deep and holds enough packed snow to raise global sea levels dramatically on its own, were the glacier to melt. Bindschadler thinks that much of Pine Island might "very well drain within our lifetime."
The accelerated melting in Antarctica has been discovered so recently, and its trajectory remains so hard to discern, that the estimates of sea-level rise still have a broad gap between the best- and worst-case scenarios. Some conservative predictions suggest that global seas will rise two feet by 2100. But if Pine Island Glacier drains completely, that alone will raise the seas another nine inches. Estimates that include other vulnerable glaciers in Antarctica put the total rise in sea levels at more than six feet. Pine Island is the pivot, the point at which the scenarios diverge into best and worst, and the future comes into clearer relief.
Every geographic section of ocean is composed of fat belts, different kinds of water layered neatly on top of one another, arranging themselves by gravity. In the Amundsen Sea, the shallowest water is very cold; some of it, which has just melted off the ice sheet, is nearly as fresh as stream water. But the deepest waters, more than 1,800 feet below the surface, are both saltier and warmer. Bindschadler says it is this water — at some places more than five degrees above the freezing point — that "is killing the ice sheet."
Some scientists believe that Pine Island Glacier has been thinning for 50 years; all that's known for sure is that it's been getting thinner for at least 15 years. "We knew the ice was thinning, and we knew the ocean water in front of it was warm," says Adrian Jenkins of the British Antarctic Survey. "But the ocean cavity beneath the ice was a black box, and to understand what is going to happen to the glacier, and what will happen to sea level, we needed to somehow see inside."
Few scientists have ever managed to get into Pine Island Bay; so much of the water remains frozen from one year to the next that it takes a warm and lucky summer to make the sea passable. But Jenkins got in two summers ago, on an American icebreaking vessel. He brought with him a torpedo-shaped remote-controlled submarine called the Autosub and, three miles from the edge of the glacier, lay it quietly into the cold sea. The sub dove and began to make its way toward the glacier, quickly losing contact with Jenkins and his team. Thirty hours later, they heard a series of beeps on their receiver — the Autosub had completed its circuit. Jenkins' team sent a signal directing it to resurface. A few tense minutes later, the sub breached the surface, like a tiny, sleek whale, and the crew brought it onboard.
When Jenkins downloaded the data from the seafloor, he discovered something startling. Scientists had thought that the ice on the underside of Pine Island Glacier was anchored to a ridge near the mouth of the bay. But the Autosub had made its way 30 miles inland, probing along the base of the glacier. The ice wasn't anchored to the ridge at all; the glacier had come unstuck, and was floating. That meant the warm water in the bay wasn't just lapping against the edge of the ice shelf but attacking the glacier's underbelly. What's more, Jenkins found, the water under the ice sheet was too warm to have been sitting there for years — it must be the result of warmer currents from the north being driven into the bay over and over again. "You couldn't just have had a one-time input of warm water onto the continental shelf, sometime long ago," Jenkins says. "We think this process is repeating itself regularly."
If you were to stand on a particular spot along the Antarctic coast for a day, or a week, you wouldn't always feel the wind blowing in any particular direction; the atmosphere is a chaotic system of storms, sudden and unpredictable, their dispersing energies sending air in every direction. But over time, it is possible to see a trend emerge, a subtle preference of the wind to move around the continent from east to west and to push the ocean currents in the same direction. As the winds go faster — energized by humans turning the dials, raising temperatures in the atmosphere and destroying the ozone layer around Antarctica — the ocean currents grow stronger and more turbulent and more likely to send fingers of warm water up over the sill of the continental shelf, grasping for and then gripping the ice.
In the past few years, scientists have begun to worry that the world's glaciers have entered what they call a "runaway feedback mode," in which the dramatic changes to the water and wind and ice caused by global warming have not only accelerated but have themselves begun to alter the climate, creating a dynamic that could be irreversible. Both Antarctica and Greenland are now losing ice at twice the rate they were in 2002 — as much as 400 billion tons each year. In July, after the planet's six warmest months on record, a giant crack opened up overnight in the Jakobshavn Glacier; for the first time ever, scientists monitoring satellite data were able to observe in real time as an iceberg covering 2.7 square miles broke off and floated into the sea. Three weeks later, an even larger iceberg — four times the size of Manhattan — cleaved away from another glacier to the north of Jakobshavn, stunning scientists who study the ice sheets. "What is going on in the Arctic now," says Richard Alley, the geoscientist at Penn State, "is the biggest and fastest thing that nature has ever done."
Scientists say that oceans have long memories. The water reflects the slow-spreading response to events that took place a month, a year, a hundred years ago. An earthquake in the Arctic. A cyclone in the Bay of Bengal. A particularly strong El Niño summer, a decade and a half in the past. These memories are not all known, and their physics are not perfectly mapped, so the movements of the oceans are not well understood. "The ice sheet," Bindschadler says, "really is just the tail of the dog." There remains the chance that cutting carbon emissions might, in the long term, prevent more warm water from getting into the Amundsen Sea, where it is melting the ice shelves. If the atmospheric system really does have dials, in other words, then perhaps they can be turned to more comfortable settings. "That may be the saving grace," Bindschadler says. But even if we reduce emissions, he warns, there is no way to get the heat that is already in the ocean, melting the ice, back out.
"If you look at all these dramatic changes, water is doing it all," he says. "The vulnerability the ice sheets have to heat from the ocean is the key to all of this. And there's orders of magnitude more than enough heat in the ocean to kill the ice sheet, on whatever time scale the ocean and atmosphere conspire to deliver that heat. It's not at all about subsequent warming or future warming of the oceans. We don't have to warm up the ocean any more at all. The vulnerability is really from climate change altering the atmospheric circulation and how much that's going to alter the ocean circulation. The ice sheets have no defense against warm water. They don't really stand a chance."
At the end of last year, Bindschadler took a trip down the Atlantic seaboard, stopping at various points where the land sloped gently away to the sea, the places most vulnerable to the rising waters. He wanted to explain to local officials the dimensions of the threat they faced and to elucidate, as clearly as he could, what science could and couldn't say about the coming flood. In Norfolk, Virginia, only one or two city planners bothered to show up, leaving him to address a room of worried environmentalists and academics. Preacher, he thought, meet choir.
But when he arrived in Wilmington, North Carolina, Bindschadler found himself in a small room at city hall, equipped with his PowerPoint slides, explaining the state of things to a sizable gathering of local planners and politicians. The officials told him that they were planning a highway extension that would snake along the coast near the banks of the Cape Fear River, and it had been designed to come close to the water's edge — a foot above sea level in some places, two feet in others. Their question was simple: Did climate change mean that they should move the highway?
Bindschadler looked at the maps — the elevation figures for the ground, the route of the proposed highway. He imagined the seas rising here in a progression. Based on the science, he could picture what might happen here in 20 years, in 100, in 200. He looked up from the maps and turned to the officials.
"Well," he asked them, "how long do you want the highway to last?"



 Posts
Posts






