Blog Archive

Showing posts with label Storm intensity. Show all posts

Sunday, February 11, 2018

Ted Glick: Helping in Puerto Rico

by Ted Glick, February 11, 2018

From January 28 to February 7, my wife and I were in Vieques, Puerto Rico, helping as best we could with recovery from Hurricane Maria, which hit on September 20th, almost five months ago.  Help is very much still needed. I don’t think I realized how much that is true until I got home to New Jersey and experienced all of the things I didn’t experience during those 10 days:
  • the lights and everything electrical turning on or being on all day and night whenever I need it;
  • a hot, not cold, water shower;
  • not worrying about hitting something or falling when I had to get up and go to the bathroom or move around at night;
  • not hearing (or smelling) loud gas generators behind the house where I was staying and several other places in the neighborhood as day turned into night;
  • not having to do extra-special filtering of the tap water because of concerns about its quality;
  • reliably accessing my cell phone apps, telephone and the internet whenever I want to.

These were the main differences.
I was staying at Casa de Kathy in Esperanza, the second largest town in Vieques. The only street in Esperanza that fully had electrical power when we were there was the Malecon, the downtown street next to the water where bars, restaurants, and hotels are, and they didn’t get that power until the fifth day we were there. What electrical power there was elsewhere in town came from gas-powered generators bought by residents who could afford them.
There was concern about the tap water. Neither the EPA nor anyone else had done tests to determine how safe it is to drink.
There were still piles of debris and branches that had been blown down by the storm, as well as collections of stoves and refrigerators disabled by it.
Despite all of these serious problems, the sense I had was that people in general were pulling together, some more than others, to climb out of the hole the hurricane put them in. They were doing so even though there was a lot of criticism of FEMA for its slowness and for it denying aid to a number of people whose homes had been damaged.
I was glad to learn that the use of solar energy, in different forms, is growing, from small solar lights, which are popular, to solar panels on roofs to provide an alternative to an unreliable electric grid.
One of the big takeaways for me was the reinforcement of something I have known intellectually for years, that extreme weather events, like the climate changing which makes them worse and more frequent, hurts low-income people the most. Middle- and upper-class people who have access to financial and other resources had found ways to lessen their suffering or discomfort, like through personal generators. But those without those resources were in a different situation. I heard of at least one family that was sleeping in a tent in their living room because there had been serious damage to their roof that they had not yet been able to afford getting fixed.
The pro-statehood Governor of Puerto Rico, Ricardo Rossello, announced just before we got there that he wanted to privatize that electrical system, currently publicly owned, which would certainly lead to higher electrical rates for many struggling Puerto Rican consumers as the corporate buyer looks to make its profits.
Then there is the relatively large Puerto Rican debt (though hugely smaller than the US debt) of $73 billion. There have been calls for that debt to be forgiven, for obvious reasons. Lin-Manual Miranda, for example, creator and star of the Broadway hit “Hamilton,” called for that in a December opinion piece in the Washington Post. He wrote:
“Puerto Rico’s creditors should do the right thing and walk away. It is the only way forward. Anything short of full debt forgiveness would be a brutal form of economic punishment to a people already suffering.”
But to add insult to injury, the Republican tax bill passed at the end of 2017, unless challenged and changed, will make things even worse.
A December 20 Washington Post story reported that the Puerto Rican Governor “is calling on lawmakers to rewrite a key part of the tax bill that he says might cause the island’s hefty manufacturing sector to contract, jeopardizing hundreds of thousands of jobs. [It] includes a new 12.5% tax on profits derived from intellectual property held by foreign companies — a move designed to compel those companies to move back to the United States. The new tax ‘is a big hit, and Puerto Rico both fiscally and economically is downtrodden, and this is the last thing they need,’ said Federico de Jesus, a former Puerto Rico government official who has been tracking congressional relief efforts for the island.”
US citizens have a special responsibility to help Puerto Rico, which has been a colony of the United States since 1898. It is our humanitarian and moral responsibility, and it is our duty as citizens of the nation which has the power to help Puerto Rico either move forward or backwards after Maria. We must do what we can as far as practical hurricane recovery support but also support groups calling for a cancellation of the debt, changes to the Republican tax bill, and reform of the electric power system, not its privatization.

Ted Glick is a former activist with the Puerto Rico Solidarity Committee in the 1970s. He was a supporter of the historic civil disobedience campaign in Vieques in the early 2000s, which led to the removal of the US Navy. He has been a progressive activist and organizer since 1968. Past writings and other information can be found at http://tedglick.com, and he can be followed on Twitter at http://twitter.com/jtglick.
https://tedglick.com/future-hope-columns/helping-in-puerto-rico/

Monday, January 22, 2018

Lenders' Guide for Considering Climate Risk in Infrastructure Investments, January 2018

AcclimatiseClimate Finance Advisors (CFA), and Four Twenty Seven have released a new guidance document to increase the climate resilience of large infrastructure investments. The “Lenders’ Guide for Considering Climate Risk in Infrastructure Investments” clearly breaks down the ways in which physical climate risks might affect key financial aspects of prospective infrastructure investments. 

This guide provides a framework for questioning how revenues, costs, and assets can be linked to potential project vulnerability arising from climate hazards and draws attention to the potential opportunities emerging from resilience-oriented investments in infrastructure.

Ten sub-sectors, including airports, marine ports, gas and oil transport and storage, power transmission and distribution, wind-based power generation, data centers, telecommunications, commercial real estate, healthcare, and sports and entertainment, are analysed and illustrated with topical examples.

To learn more about this document, please visit our website and download the publication here.

Download the guide at this link:

http://www.acclimatise.uk.com/wp-content/uploads/2018/01/Lenders_Guide_for_Considering_Climate_Risk_in_Infrastructure_Investments.pdf

Sunday, April 2, 2017

Climate Code Red: Climate change pushing floods, cyclones to new extremes, with worse to come

by David Spratt, Climate Code Red, April 1, 2017


With Australia experiencing the aftermath of Cyclone Debbie and record-breaking rains and severe flooding in southeast Queensland and along the north coast of New South Wales, here’s a look at how global warming has, and will, push floods and cyclones to new extremes.

Flooding extremes

Warm air can be more humid than cold air, that is, it can hold more water vapour in absolute terms. And atmospheric water vapour content increases 7% for each 1-degree-Celsius increase in global average temperature, establishing the conditions for more intense rainfall events. 

Flash floods are likely to sweep across the Australian landscape with increasing intensity, particularly in urban or residential areas. Peak rainfall is predicted to soar with rising surface temperatures as Australia experiences ever greater extremes of heat.  

The frequency of major flood events (defined as events which caused extensive flooding within 50 kilometres of the coast, or inundation that extended 20 kilometres along the coast) along Australia's eastern seaboard has doubled in last 150 years, with climate change one of the possible factors, senior Bureau of Meteorology researchers say. 

Record-breaking heavy rainfall and a clear upward trend in downpours over the last 30 years fits in with global temperature rise caused by greenhouse gases. Statistical analysis of rainfall data from 1901 to 2010 around the globe, shows that from 1980 to 2010 there were 12% more of these intense events than would be expected in a climate without global warming. Wet regions generally saw a bigger increase in deluges and drier regions a smaller one. In southeast Asia, the observed increase in record-breaking rainfall events is as high as 56%.

Giant air streams pushing new extremes: The increase of devastating weather extremes in summer, including floods, is likely linked to human-made climate change, mounting evidence shows, with the recent discovery of giant airstreams circling the Earth, waving up and down between the Arctic and the tropics. These planetary waves transport heat and moisture. When these planetary waves stall, droughts or floods can occur. Warming caused by greenhouse-gases from fossil fuels creates favourable conditions for such events.

 “The unprecedented 2016 California drought, the 2011 U.S. heatwave and 2010 Pakistan flood, as well as the 2003 European hot spell, all belong to a most worrying series of extremes,” says Michael Mann, a lead author of the study. “The increased incidence of these events exceeds what we would expect from the direct effects of global warming alone, so there must be an additional climate change effect. In data from computer simulations as well as observations, we identify changes that favour unusually persistent, extreme meanders of the jet stream that support such extreme weather events. Human activity has been suspected of contributing to this pattern before, but now we uncover a clear fingerprint of human activity.”

Attribution studies show how the risk of a particular event may have changed due to the human influence on climate. Some attribution results surveyed by the World Meteorological Organisation include:

  • The US National Oceanic and Atmospheric Administration determined that human-caused climate change increased chances of the fatal and record rains in Louisiana by at least 40% and could have nearly doubled the odds of such a storm.
  • A scientific analysis of devastating 2014 floods in the United Kingdom, which cost an estimated $646 million in insurance losses, found that human-caused climate change has increased the chance of the extreme rain event by 43%.
  • In May–June 2016, portions of northeast France received 6 full weeks of rain in 24 hours. A formal attribution study released June 9, 2016, found that such extreme rains are at least 40%—and as much as 90%—more likely in some areas of France.
Cyclone extremes

Cyclones, in part, draw their energy from the temperature of the ocean's surface waters, so a warming climate and ocean puts more energy into storms, including cyclones, loading them with more rainfall, and stronger winds pushing more of a storm surge.
The recent Climate Council brief notes, “Increasing temperature of the surface ocean affects the intensity of cyclones, both maximum wind speeds and in the intensity of rainfall that occurs in association with the cyclone.”  The force exerted on buildings and structures when cyclones make landfall increases disproportionately with wind speed.

The Council also notes that: “Tropical cyclones form most readily when there are very warm conditions at the ocean surface and when the vertical temperature gradient through the atmosphere is strong. As this vertical gradient weakens as the climate continues to warm, it is likely that fewer tropical cyclones will form.”

Whilst the best evidence scientists have suggests cyclones are unlikely to increase in number, a 2013 study challenges the status quo, suggesting they will occur more frequently, as well becoming more intense. 

In 2013, researchers reported that the stronger hurricanes in the North Atlantic, the South Pacific, and South Indian Oceans have become more intense.  The same year, the UN meteorological agency concluded that climate change is making super typhoons worse. 

In 2015, an international research team found that a warming planet is already stoking the intensity of tropical cyclones in the northwest Pacific, and their ferocity will continue to increase even with moderate climate change over this century.

More broadly, a 2010 study found that "future projections based on theory and high-resolution dynamical models consistently indicate that greenhouse warming will cause the globally averaged intensity of tropical cyclones to shift towards stronger storms, with intensity increases of 2–11% by 2100...higher resolution modelling studies typically project substantial increases in the frequency of the most intense cyclones, and increases of the order of 20% in the precipitation rate within 100 km of the storm centre.

Recent records

With sustained wind speeds of more than 310 kilometres per hour, Typhoon Haiyan in the Philippines in November 2013 was the most powerful tropical cyclone to make landfall in recorded history. The previous record was held by Hurricane Camille, which in 1969 hit the state of Mississippi with wind speeds of just over 300 km/h. Data compiled from the US National Oceanic and Atmospheric Administration shows sea temperatures were about 0.5
1.0 degree Celsius above normal in the waters to the east of the Philippines as Haiyan began forming. The waters cooled in the storm's wake, an indication of how the storm sucked up energy.   

Hurricane Patricia which hit Mexico in October 2015 achieved a record peak intensity with maximum sustained winds 345 km/h, making it the most intense tropical cyclone on record in the Western Hemisphere, and the strongest globally in terms of 1-minute maximum sustained winds. Cyclone Winston in February 2016 was the strongest tropical cyclone to make landfall in Fiji and the South Pacific Basin in recorded history.

Attribution studies 

  • Superstorm Sandy which hit the northeast coast of the USA with devastating effect in October 2012 was made worse by unusually warm waters which increased the hurricane’s intensity. As well, human-caused sea level rise added to the storm surge, and on the stretch of the Atlantic Coast that spans from Norfolk to Boston, sea levels have been rising four times faster than the global average. Researchers say that “It is possible that subways and tunnels may not have been flooded without the warming-induced increases in sea level and storm intensity and size.”  More broadly, the authors say that “‘snowmaggedon’ in February 2010, superstorm Sandy in October 2012 , supertyphoon Haiyan in November 2013, and the Boulder floods of September 2013 were all influenced by high sea-surface temperatures that had a discernible human component.
  • The Climate Council reported that climate change exacerbated the damage caused by Cyclone Pam, which left a trail of destruction across Vanuatu in 2015.
Damage 

Reinsurance giant, MunichRe, says that "nowhere in the world are weather risks changing faster than in Eastern Asia," and concludes that "as a result of climate change... the intensity of typhoons will increase" in Eastern Asia.  On 11 November 2013, in the aftermath of super-typhoon Haiyan, MunichRe surveyed losses:

Eastern Asia has been hard hit by weather-related loss events in the past three decades. Their number has increased by more than a factor of four, causing overall losses from weather-related events of some US$ 700bn during this period. The insured losses of US$ 76bn amounted to only around 10% of overall losses, with 62% of these attributable to Japan. Floods caused 56% of the overall losses in Eastern Asia, but only 30% of insured losses. The number of floods has increased strongly and is expected to increase further in the coming decades. With insured losses of US$ 16bn, the 2011 Thailand floods caused the biggest-ever weather-related insured loss in the region. After floods, it is typhoons that cause the greatest weather-related losses. New analyses indicate a clear cycle of activity for typhoons, and increased typhoon activity is expected over the coming years..."
And in Australia, The Age reports that new modelling has shown that a cyclone the size of Debbie could have catastrophic consequences on the Gold Coast and as far as Brisbane, with winds of 260km/h, in areas where many homes and towers do not meet cyclonic safety standards. As climate change pushes cyclones further south, tens of billions of dollars worth of infrastructure is at risk. Actuaries, who predict and model scenarios for banks and insurers, have warned properties could become "uninsurable" as premiums rise up to 250% to meet this global warming challenge.

http://www.climatecodered.org/2017/04/climate-change-pushing-floods-cyclones.html

Sunday, September 11, 2016

Ocean warming intensifies power of typhoons

The violence of typhoons that devastate Asian coastal regions is being magnified by rising sea surface temperatures caused by greenhouse gas emissions.


by Tim Radford, Climate News Network, September 11, 2016


LONDON – The typhoons that have slammed into the coasts of east and southeast Asia have become more violent, increasing in intensity by between 12% and 15% over the last four decades, according to a new study.
And the proportion of storms that meet the classification of category 4, with winds at 200 kilometres per hour, and category 5, with gusts of more than 250 kph, has at least doubled and may have tripled.
The good news for mariners is that those tropical cyclones that stay over the open ocean have not gotten significantly worse. The windstorms that pound the land, though, are potentially more destructive.
The cause of the intensity is an overall warming of ocean surface waters in the northwest Pacific Ocean.
And the researchers say: “The projected ocean surface warming pattern under increasing greenhouse gas forcing suggests that typhoons striking eastern mainland China, Taiwan, Korea and Japan will intensify further.

Damage by typhoons

“Given disproportionate damages by intense typhoons, this represents a heightened threat to people and properties in the region.”
It confirms that the number of severe hurricanes has increased by 25% to 30% for each degree of global warming so far. And, once again, greenhouse gas emissions are to blame.
“Most of the heat from human-induced warming since the 1970s – a staggering 93% – has been absorbed by the ocean, which acts as a buffer against climate change, but this comes at a price,” says Dan Laffoley, marine vice-chair of the World Commission on Protected Areas at IUCN, and one of the study’s authors.
“We were astounded by the scale and extent of ocean warming effects on entire ecosystems made clear by this report.”

“Ocean warming is one of this generation’s
greatest hidden challenges – and one for which
we are completely unprepared”

The IUCN study was compiled by 80 scientists from 12 nations, and it highlights the scientific evidence of impacts on marine life – from microbes to the great sea mammals – that are likely to increase significantly even if humans drastically reduce fossil fuel combustion and cut the carbon dioxide emissions that drive global warming.
The scientists say ocean warming is already affecting ecosystems from the poles to the Equator, driving plankton, jellyfish, seabirds, and turtles up to 10 degrees of latitude nearer to the poles.
In East Africa, ocean warming has reduced fish numbers by destroying parts of the reefs the fish depend upon. If humans go on releasing carbon dioxide emissions at the current rate, by 2050, marine fisheries harvests in southeast Asia are expected to be up to 30% lower than the average for the years 1970-2000.
Both studies are confirmatory rather than ground-breaking. Researchers have repeatedly warned that Pacific tropical cyclones and Atlantic hurricanes are likely to become more destructive.

 Landfalling storms

Atmospheric scientists Now Wei Mei and Professor Shang-Ping Xie, of the Scripps Institution of Oceanography in California, report that they looked again at the data, to confirm first that landfalling storms – about half of all typhoons hit the coasts – have intensified, and secondly that rising sea surface temperatures are the cause.
The IUCN research, too, is a re-examination: other studies have confirmed the link between ocean warming and climate change, and between ocean warming and ecosystem destruction. But, on a planet that is 70% ocean, nobody can be sure of the consequences.
“Ocean warming is one of this generation’s greatest hidden challenges – and one for which we are completely unprepared,” says Inger Andersen, director general of the IUCN.
“The only way to preserve the rich diversity of marine life, and to safeguard the protection and resources the ocean provides us with, is to cut greenhouse emissions rapidly and substantially.” 

Sunday, June 28, 2015

Most Extreme Weather Has Climate Change Link, Study Says

Global warming has created a 'new normal,' scientists say, and the old hesitance to attribute extreme weather to climate change is outdated.

In the wake of major hurricanes, floods and heat waves, scientists are quick to say that no single weather event can be attributed to climate change until careful analysis draws that conclusion. Now, a new study argues that thinking is backwards, that all extreme weather has a link to climate change.

The default position has been holding science back in connecting weather and climate, concludes the authors of a peer-reviewed paper published Monday in Nature Climate Change.

This "could be a game changer in how these studies are done in [the] future," lead author Kevin Trenberth said in an email.

Trenberth is a senior scientist at the National Center for Atmospheric Research (NCAR), and one of three researchers behind the study.

The paper presents a new research technique that grew out of an idea Trenberth first proposed at a conference in 2010. It also provides scientists examples of how to apply the method, and challenges the conclusions of a 2014 paper that found no climate influence in the massive floods that swept Boulder, Colo., in 2013.

Trenberth said his approach is new, and conventional research methods still dominate the field.

Traditionally, researchers begin with a default assumption that the extreme weather event they're examining is not influenced by human-caused climate change. They then run computer models or other tests to see if global warming has increased the intensity or likelihood of that event.

But Trenberth's team says this method can lead to "false negatives" that underestimates the role of climate change. It's particularly problematic when scientists are studying extreme weather driven by atmospheric circulation—factors such as weather patterns and storm patterns—when it's difficult to separate the influence of climate change from natural variability.

Trenberth's paper instead suggests focusing on thermodynamic changes caused by global warming, such as increased sea-surface temperatures, humidity and sea level rise. Unlike atmospheric circulation patterns, scientists have a much better understanding of how climate change affects thermodynamic shifts, said study co-author John Fasullo, a NCAR project scientist.

According to the study, these warming-fueled changes play an important role in increasing the intensity of storms and the impact of storm surges, creating "a new normal" in the underlying conditions that influence all weather events.

"Because global warming is real and present, it is not a question as to whether it is playing a role, but what that role is," the authors wrote.

"We're not even interested in the question of the cause," Fasullo explained. "We're trying to understand the influence climate change will have on extreme weather events."

In fact, Fasullo says, even the term "new normal" can be misleading, because it implies that the climate is no longer changing, when in reality the climate won't stabilize until greenhouse gas concentrations in the atmosphere level off.

Trenberth said he expects pushback from scientists who favor the older methods, but he believes "a sea change is in order with the conservative scientists and we need to stop proving over and over again that climate change is having effects...I hope that it leads to more fruitful studies and better communications with the public."

Higher Seas, Higher Temps

The Earth had droughts and hurricanes long before humans, but we're "changing the way these events unfold," Fasullo said. "So from our point of view, this default assumption of no climate change [influence] is a poor place to start the quantitative analysis. You wouldn't want to assume nothing is changing."

Kerry Emanuel, a professor of atmospheric science at the Massachusetts Institute of Technology who wasn't involved in study, agreed that a lot of evidence now points to conditions changing because of global warming. But, he said, many scientists would prefer to stick with the default assumption that extreme weather events are not influenced by climate change until proven otherwise.

"The real crux of the matter is not fooling yourself" into a false sense of confidence, he said. "Scientists are very guarded about that possibility."

The study gives several examples of how to use the new method. Supertyphoon Haiyan, which hit the Philippines in November 2013, was driven in large part by the natural variability of sea surface temperatures in the Pacific Ocean. But the storm surge was made worse by an increase in local sea levels, which were nearly 12 inches higher than they were in 1993.

Another example is the "snowmageddon" storm that hit Washington, D.C., in February 2010. The intensity of the blizzard—which dropped up to three feet of snow in the mid-Atlantic region—was influenced by high sea-surface temperatures in the tropical Atlantic (2.7 degrees Fahrenheit above normal), which brought large amounts of moisture into the storm.

In a third example, Trenberth's paper disputed the conclusions of a 2014 study published in the Bulletin of the American Meterological Society, which found that the 2013 Boulder floods were caused by an extremely rare concurrence of weather patterns that brought a huge amount of moisture over the region—and climate change played no discernible factor in that setup. But Trenberth's team said the excessive moisture was enabled by unusually high sea-surface temperatures off the coast of Mexico.

'Preparing for the Last Disaster'

Emanuel said Trenberth's new approach isn't wrong, but it's open to misinterpretation because it doesn't consider all aspects of climate change's possible impacts.

For instance, the research method might show that a storm identical to Haiyan would have had a smaller impact if it had hit the Philippines 100 years ago. That information is useful, but it has to be interpreted correctly in a limited context, Emanuel said. "It is a very narrowly posed and narrowly answered question."

Further analysis would be required to answer other related questions, such as, what is the probability that Haiyan would have formed at all under the lower sea-surface temperatures of the past? And is it more or less likely to have followed Haiyan's exact same storm track? Those answers would provide a more complete picture of global warming's impacts, he said.

The study also has implications for disaster planning. If climate change exerts an even bigger influence on extreme weather than previously thought, then it emphasizes how the U.S. is "woefully underprepared in regards to climate adaptation planning," said Melanie Gall, a University of South Carolina professor who studies disaster risk and emergency management.

"All of our current planning is so retrospective," Gall said. "We always prepare for the last disaster" instead of looking at future risks and how conditions will change with global warming, she said.

Many of the states that are most vulnerable to extreme weather—including Texas, Louisiana, Mississippi and Florida—are politically conservative, and don't consider climate change on a state level, she said. "I think what this study shows," she added, "is we need to plan for it, and it needs to be recognized, and not wait until we have the perfect evidence."

http://insideclimatenews.org/news/23062015/most-extreme-weather-has-climate-change-link-study-says-global-warming-trenberth-ncar-sea-levels

Saturday, March 21, 2015

Kerry Emanuel, Real Climate: Severe Tropical Cyclone Pam and Climate Change

by Kerry Emanuel, guest post, Real Climate, March 18, 2015

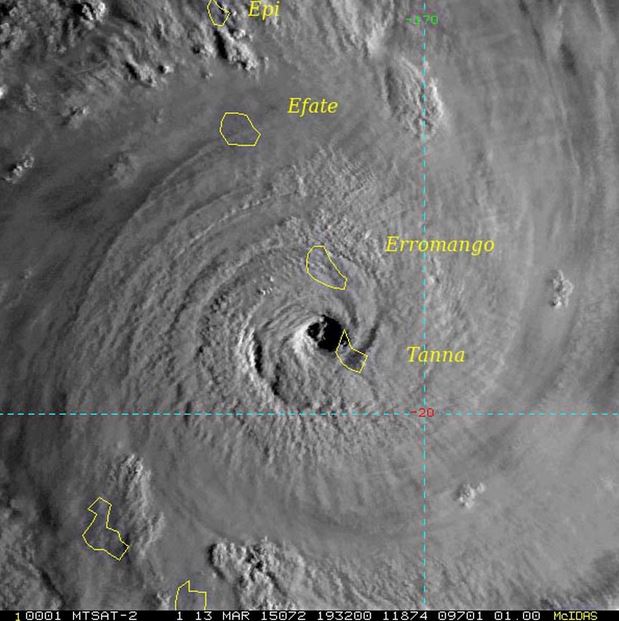
In the past 16 months, two exceptionally intense tropical cyclones, Haiyan and Pam, have struck the western Pacific with devastating effect. Haiyan may have had the highest wind speeds of any tropical cyclone on record, but we will never know for sure because we do a poor job estimating the intensity of storms that are not surveyed by aircraft. (Currently, only North Atlantic tropical cyclones are routinely reconnoitered by aircraft, and only if they threaten populated regions within a few days.) Pam’s analyzed intensity puts it within 10 knots of the most intense storms on record in the South Pacific, but here again this is within the error bars of satellite-derived intensity estimates.
pam2

Pam’s high intensity and terrible impact on Vanuatu have invariably raised the question of the possible effect of global warming on its characteristics. For example, Vanuatu’s President Baldwin Lonsdale blamed the disaster partly on climate change. Just as predictable is the backlash to the effect that no single event can be attributed to climate variations of any kind. What can we say about the effects of climate change on South Pacific tropical cyclones?

We can begin by looking at the record of tropical cyclones in that region. Unfortunately, for the reasons discussed above, these records are poor and those that exist only go back to about 1980, though there are longer records of storms making landfall in Australia. Perhaps the best existing analysis of South Pacific tropical cyclones is that of Kossin et al. (2013), who homogenized the satellite data record from 1982 to 2009 to create a temporally consistent record, and compared that to the problematic historical data base of storms over the world. While the historical data in the South Pacific region show a highly significant upward trend in the incidence of high intensity events, the satellite-based record shows a less prominent and significant trend of 2.5 m/s per decade with a value of 0.09. Thus there is some evidence of a trend toward higher intensity of high category tropical cyclones in the South Pacific over the period 1982-2009, but it is not conclusive and in any event spans a limited time interval.

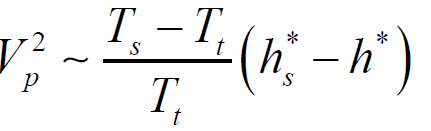
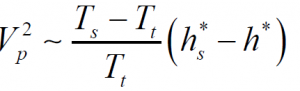
We can also look at trends in important environmental factors that are known to influence tropical cyclones. The usual suspect among these is sea surface temperature (SST) and there has been much talk about the elevated SST’s in the region where Pam developed. But SST by itself is not the main factor in the existing theory for the upper bound on tropical cyclone intensity, known as the potential intensity; instead, the potential intensity depends more nearly in the difference between SST and a measure of the bulk temperature of the troposphere as well as the temperature of the tropopause. An expression of the potential intensity, measured in maximum possible wind speed, is
igiffacj

where Vp is the potential maximum wind speed, Ts is the surface temperature, Tt is the tropopause temperature, hs* is the saturation moist static energy of the sea surface, and h* is the saturation moist static energy of the free troposphere, which is nearly uniform with height if the lapse rate is moist adiabatic. In the deep tropics, temperature is nearly uniform on pressure surfaces because there is not enough Coriolis acceleration to balance strong pressure gradients, thus h*, which is just a function of pressure and temperature, is horizontally as well as vertically uniform in the free troposphere. 

Therefore, the potential intensity depends mostly on variations of SST (which controls hs*) for climate variations that do not affect the mean temperature of the troposphere. But global warming very definitely does affect the temperature of the tropical free troposphere, so it is not possible to conclude, as alas many have, that increasing SST per se means increasing tropical cyclone intensity (though it usually does signify more TC-related rain).

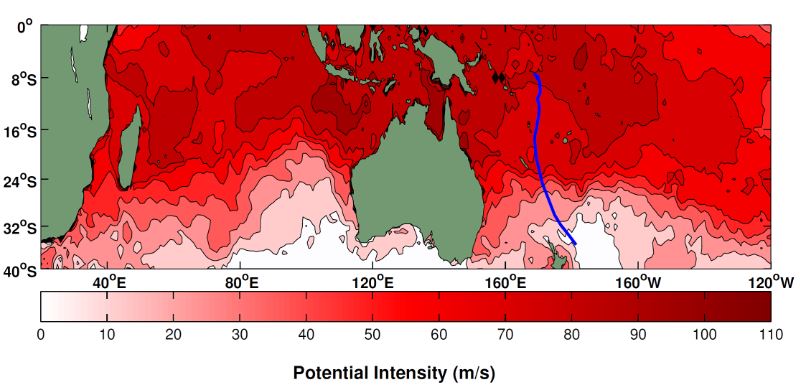
It is not difficult to calculate the actual potential intensity from SST and atmospheric soundings, and this can be done as well for reanalysis and global model data sets. The map below shows the potential intensity at 12 GMT on 7 March, 2015, calculated from the NCEP operational analysis at that time. 

The track of PAM is superimposed in blue.
pam_pi

Pam traversed a region of potential intensities around 75 m/s, consistent with the storm’s estimated peak intensity. These values are not unusual in this region, but for the past few decades they have been increasing, if the reanalyses are to be believed. I calculated potential intensity trends over the period 1980-2012 using three different reanalysis products: NASA’s MERRA, the European Center’s ERA Interim, and the NCAR/NCEP reanalysis. The MERRA and ERA Interim reanalyses show upward trends of around 2 m/s per decade in the region where Pam formed, while NCEP’s trend is closer to 3 m/s per decade; all these trends have values less than 0.1. These trends are broadly consistent with the Kossin et al. (2013) trend of 2.5 m/s per decade in the observed intensity of high category tropical cyclones in this region.

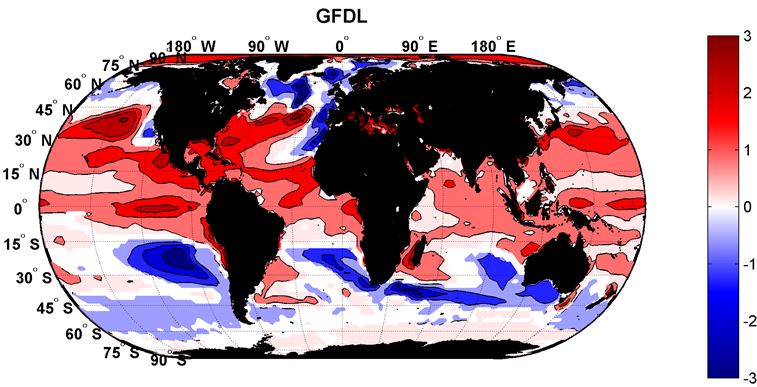
Thus the weight of evidence points to increasing potential intensity in the region where Pam developed, and consistent with this, increasing intensity of the highest category storms based on satellite-derived measurements. But to what do we attribute such increases? The roughly 30-year period over which we have reliable reanalyses and satellite measurements is too short to rule out the influence of natural climate variability, such as the Pacific Decadal Oscillation. We can at least check to see what kinds of trends climate models produce. I looked at eight CMIP 5 models whose output I had ready access to and calculated linear trends of potential intensity over the period 2006-2100 under the RCP 8.5 emissions pathway. The eight models were the NCAR CCSM4, a super-parameterized version of the same, referred to as SP-CAM, The GFDL CM3, the UKMO HADGEM-ES, the IPSL CM5A-LR, the Max Planck MPI-ESM-MR, the CCSR/NIES/JAMEST MIROC5, and the Meteorological Research Institute’s MRI-CGCM3. Of these, two models showed insignificant trends in the region in which Pam developed, and the rest showed positive trends averaging around 0.5 m/s per decade, considerably less than the observed trend over the last 30 years. The largest trend was produced by the GFDL model, whose global trend distribution is shown below. (White areas represent p values less than 0.1., and the units are m/s per decade.)
gfdl-pi

It is interesting that the largest increases are at the polar peripheries of the tropics, indicating a general expansion of the regions that are thermodynamically favorable for tropical cyclone development; this general feature is present in most of the model potential intensity trends as well as the reanalysis trends over the past 30 years, and may be behind the poleward migration of the latitudes at which observed tropical cyclones reach their peak intensity, as documented by Kossin et al. (2014).

The disparity between the reanalysis potential intensity trends over the past 30 years and the projected trends over this century suggests either that most of the observed increase in potential intensity (and actual intensity of high category storms) is due to natural variability, that decreasing anthropogenic aerosol loading over that period may have played a role, or that the model projections are too conservative. Yet the projected increase is not insignificant, amounting to about 5 m/s over 100 years. Note from the figure above that there are somewhat larger increases elsewhere, particularly in the northern hemisphere.

All of this is consistent with the strengthening consensus that the frequency of high category tropical cyclones should increase as the planet warms (Knutson et al., 2010). Basic theory and a variety of numerical simulations support this, as well as the projection that tropical cyclones should produce substantially more rain, owing to the increased moisture content of the tropical atmosphere. This is important because most destruction and loss of life are caused by high category storms and their attendant storm surges, and by freshwater flooding from torrential rains. Most of the disagreement in the literature on tropical cyclone projections concerns the incidence of weak storms, but these are usually far less consequential in spite of being more numerous.

Besides the oft-discussed issues of TC frequency and intensity, changes in genesis locations and tracks are potentially very important, as are the diameters of TCs, which affect the area covered by strong winds and which greatly affect the magnitudes of storm surges. In the present climate, the diameter of storms, as measured by the radius at which their circular wind component becomes indistinguishable from environmental winds, appears to be log normally distributed, with a mean around 420 km (Chavas and Emanuel, 2010). There is some indication from modeling studies that the size of the dangerous inner core scales with the potential intensity divided by the Coriolis parameter (Khairoutdinov and Emanuel, 2014). If this turns out to be true in nature, then storm inner core dimensions should increase over time.

While Pam and Haiyan, as well as other recent tropical cyclone disasters, cannot be uniquely pinned on global warming, they have no doubt been influenced by natural and anthropogenic climate change, and they do remind us of our continuing vulnerability to such storms. Destructive TCs in any one place tend to be generational…enough time for people to forget them and go back to risky behavior, including over-development of coastal regions. We adapt more successfully to the more frequent events which are always in the back of our minds (and often in the front). But this human adaptation time scale may be longer than the time over which climate change affects storms, so that comparatively small changes in the frequency of generational events can have large social consequences. When a 100-year event becomes a 50-year event, it may take a few destructive hits before we adapt to the new reality. This is of particular concern with tropical cyclones, where the application of existing damage models to projected changes in tropical cyclone activity predict large increases in damage, as documented, for example, in the recent Risky Business report commissioned by Michael Bloomberg, Hank Paulson, and Thomas Steyer*.

Now if only we could better measure tropical cyclones to record how they may change in coming years.
_________
* [Update, 1pm ET] It has been pointed out that in my reference to the Risky Business report, I might have mentioned that I contributed synthetic hurricane event sets that were used by Risk Management Solutions, Inc., to estimate damages from tropical cyclones.

References
Chavas, D. R., and K. A. Emanuel, 2010: A QuickSCAT climatology of tropical cyclone size.Geophys. Res. Lett.37. 10.1029/2010GL044558.
Khairoutdinov, M. F., and K. Emanuel, 2014: Rotating radiative-convective equilibrium simulated by a cloud-resolving model. J. Adv. Model. Earth Sys.5, In press.
Knutson, T. R., and Coauthors, 2010: Tropical cyclones and climate change. Nature Geosci.3,157-163.
Kossin, J. P., T. L. Olander, and K. R. Knapp, 2013: trend analysis with a new global record of tropical cyclone intensity. J. Climate26, 9960-9976.
Kossin, J. P., K. A. Emanuel, and G. A. Vecchi, 2014: The poleward migration of the location of tropical cyclone maximum intensity. Nature509, 349-352.

http://www.realclimate.org/index.php/archives/2015/03/severe-tropical-cyclone-pam-and-climate-change/

Thursday, August 7, 2014

New research links tornado strength and frequency to climate change

by Kathleen Haughney, Florida State 24/7, FSU, August 7, 2014

James Elsner
James Elsner, professor of geography at Florida State.
New research by a Florida State University geography professor shows that climate change may be playing a key role in the strength and frequency of tornadoes hitting the United States. 
Published Wednesday in the journal Climate Dynamics, Professor James Elsner writes that though tornadoes are forming fewer days per year, they are forming at a greater density and strength than ever before. So, for example, instead of one or two forming on a given day in an area, there might be three or four occurring. 
"We may be less threatened by tornadoes on a day-to-day basis, but when they do come, they come like there's no tomorrow," Elsner said. 
Elsner, an expert in climate and weather trends, said in the past, many researchers dismissed the impact of climate change on tornadoes because there was no distinct pattern in the number of tornado days per year. In 1971, there were 187 tornado days, but in 2013 there were only 79 days with tornadoes.
But a deeper dive into the data showed more severity in the types of storms and that more were happening on a given day than in previous years.
"I think it’s important for forecasters and the public to know this," Elsner said. "It's a matter of making sure the public is aware that if there is a higher risk of a storm, there may actually be multiple storms in a day."
The United States experiences more tornadoes than any other country, and despite advances in technology and warning systems, they still remain a hazard to residents in storm-prone areas. The 2011 tornado season, for example, had nearly 1,700 storms and killed more than 550 people.
So far, in 2014, there have been 189 storms with a death toll of 43, according to the NOAA/National Weather Service Storm Prediction Center.
One bright spot of news in the research, Elsner added, was that the geographic areas impacted most regularly by tornadoes do not appear to be growing.
Elsner was joined on the paper by independent researcher Thomas H. Jagger, formerly a research associate at Florida State University, and meteorologist Svetoslava Elsner.

Tuesday, August 5, 2014

"The increasing efficiency of tornado days in the United States," by S.B. Elsner, S.C. Elsner & T.H. Jagger, Climate Dynamics (2014); doi: 10.1007/s00382-014-2277-3

Climate Dynamics, (6 August 2014); doi: 10.1007/s00382-014-2277-3


The increasing efficiency of tornado days in the United States

James B. Elsner, Svetoslava C. Elsner and Thomas H. Jagger

Abstract


The authors analyze the historical record of tornado reports in the United States and find evidence for changes in tornado climatology possibly related to global warming. They do this by examining the annual number of days with many tornadoes and the ratio of these days to days with at least one tornado and by examining the annual proportion of tornadoes occurring on days with many tornadoes. Additional evidence of a changing tornado climate is presented by considering tornadoes in geographic clusters and by analyzing the density of tornadoes within the clusters. There is a consistent decrease in the number of days with at least one tornado at the same time as an increase in the number of days with many tornadoes. These changes are interpreted as an increasing proportion of tornadoes occurring on days with many tornadoes. Coincident with these temporal changes are increases in tornado density as defined by the number of tornadoes per area. Trends are insensitive to the begin year of the analysis. The bottom line is that the risk of big tornado days featuring densely concentrated tornado outbreaks is on the rise. The results are broadly consistent with numerical modeling studies that project increases in convective energy within the tornado environment.

http://link.springer.com/article/10.1007/s00382-014-2277-3