Blog Archive

Showing posts with label Sea level rise. Show all posts

Sunday, May 29, 2022

Historic Greenland ice sheet rainfall unraveled

by , May 26, 2022

Historic Greenland ice sheet rainfall unravelled
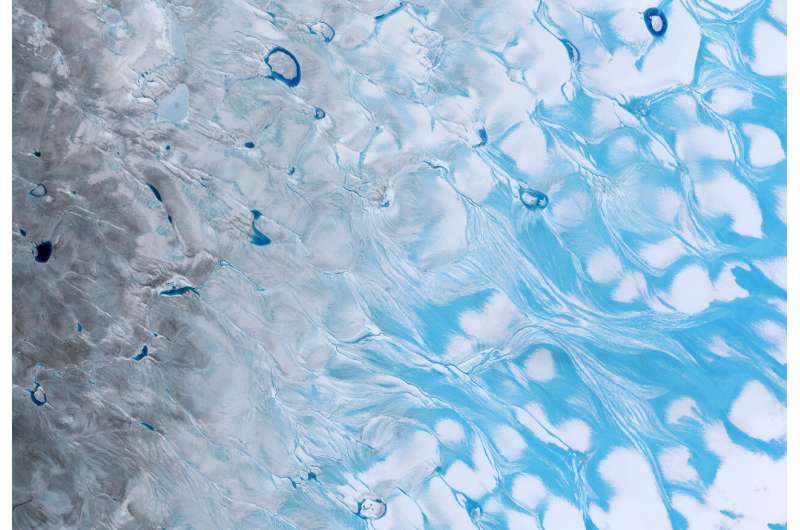
Meltwater and surface lakes on the Greenland ice sheet. Credit: contains modified Copernicus Sentinel data (2021), processed by ESA

For the first time ever recorded, in the late summer of 2021, rain fell on the high central region of the Greenland ice sheet. This extraordinary event was followed by the surface snow and ice melting rapidly. Researchers now understand exactly what went on in those fateful summer days and what we can learn from it.

The never-before-seen rainfall, on 14 August 2021, made headlines around the world. The upper-most parts of Greenland's enormous ice cap used to be too cold for anything other than  to fall, but not anymore.

What caused this extreme rainfall and how did it affect the ice?

Researchers from the Department of Glaciology and Climate at the Geological Survey of Denmark and Greenland (GEUS) in collaboration with colleagues from France and Switzerland have scrutinized these questions and come up with the answers.

It didn't only rain at Summit Camp—rain was measured by new automatic weather stations placed across the ice sheet by GEUS' ice-sheet monitoring projects PROMICE and GC-Net.

Studying detailed data from these stations alongside measurements of surface reflectivity, or albedo, from the Copernicus Sentinel-3  and information on , the researchers discovered that the rain had been preceded by a heatwave at a time of year when seasonal melting is usually slowing down.

Historic Greenland ice sheet rainfall unravelled
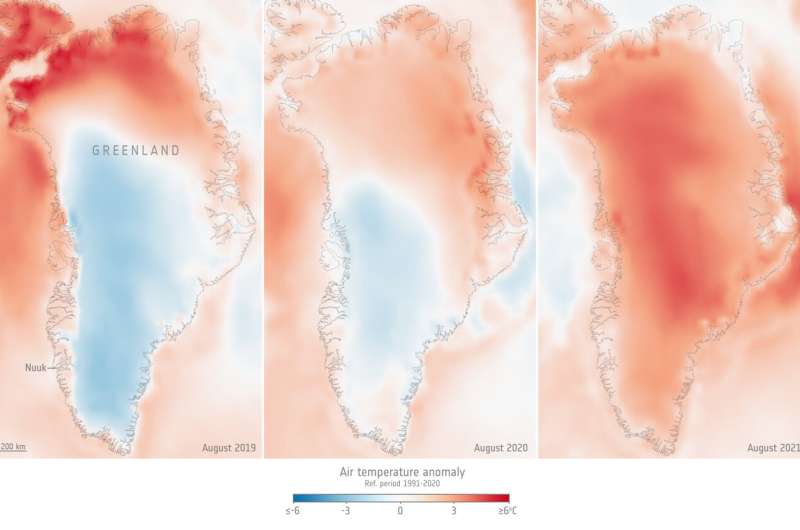
Greenland air temperature for August 2019, 2020, 2021, compared to the 1991–2020 August average. Credit: Copernicus Climate Change Service/ECMWF/ESA (data ERA5)

It wasn't the rain

"It turns out that the rain itself wasn't the most important factor," says Prof. Jason Box from GEUS and lead author of the paper reporting their results, which has been accepted for publication in Geophysical Research Letters.

"There is an irony. It's not really the rain that did the damage to the snow and ice, it's the darkening effect of the meltwater and how the heat from the event erased snow that had overlaid darker ice across the lower third of the ice sheet.

"Unusually warm atmospheric rivers swept along Greenland in the late summer months, bringing potent melt conditions when the  was drawing to a close."

In fact, this sudden increase of surface ice melt on Greenland could have happened without any rain ever touching the ground.

The never-before-seen rainfall, on 14 August 2021, made headlines around the world. The upper-most parts of Greenland's enormous ice cap used to be too cold for anything other than  to fall, but not anymore.


For the first time ever recorded, in the late summer of 2021, rain fell on the high central area of the Greenland ice sheet. This extraordinary event was preceded by a heatwave and followed by the surface snow and ice rapidly melting. The animation is a series of five images captured by the Copernicus Sentinel-2 mission and shows how the surface of the ice sheet changed between on 1, 3, 5, 20, and 23 August 2021. The melt, which also created lakes on the surface of the ice, is clear to see. Researchers, supported by ESA’s Science for Society program, discovered that it wasn’t actually the rain that caused the melt, it was unusually warm ‘atmospheric rivers’ that swept along Greenland, bringing potent melt conditions when the melt season would normally be drawing to a close. Credit: contains modified Copernicus Sentinel data (2021), processed by ESA.

Even though the rainfall was a shock and a milestone in climate history, researchers knew it was bound to happen sooner or later, given the rising temperatures of the Arctic.

Therefore, Prof. Box and the co-authors encourage research to look further into the workings behind atmospheric rivers and not just rainfall.

They conclude that understanding the frequency of heatwaves, appears to be a more significant research target than the liquid precipitation that heatwaves may or may not produce.


https://phys.org/news/2022-05-historic-greenland-ice-sheet-rainfall.html

Sunday, April 21, 2019

WaPo: It’s been exceptionally warm in Greenland lately and ice is melting a month early


Warmth over Greenland is highlighted in a daily analysis from mid-April. (ClimateReanalyzer.org)

by Matthew Cappucci, The Capital Weather Gang, The Washington Post, April 18, 2019

You might have heard about the exceptional heat this year in the northern hemisphere and around the world. March was just declared the second warmest on record globally
Records have been shattered in AlaskaScotland hit 70 degrees in February. Winter warmth has torched the U.K., The Netherlands, and Sweden as well — coming on the heels of Europe’s warmest year on record. But they’re not alone.
Greenland is baking, too. In fact, its summer melt season has already begun — more than a month ahead of schedule.
Marco Tedesco is a professor in atmospheric sciences at the Lamont Doherty Earth Observatory of Columbia University. He monitors behavior of the cryosphere — the part of earth’s water system that is frozen. He says melting of this extent shouldn’t begin until May. “The first melt event was detected on April 7,” he wrote in email.
Greenland melt extent in 2019, compared to normal. (National Snow and Ice Data Center)
“Air temperature anomalies were up to more than 20 degrees Celsius [36 Fahrenheit] above the mean,” noted Tedesco. His team has been eyeing Greenland’s southeast coast as ground zero for the early-season thaw. “Surface air temperature jumped to 41 degrees on April 2, up from minus-11,” he said. Temperatures dropped below freezing briefly before again soaring into the 30s, where the mercury has held steady for most of the past week.
What’s been sling-shotting this balmy air northward?

“The subtropical jet stream,” wrote Jennifer Francis, senior scientist at the Woods Hole Research Center in Falmouth, Mass. It’s teamed up with the polar jet to “transport warm, moist air from near Florida northward into southern Greenland,” she explained. “Locking this pattern in place has been a strong ridge — a northward bulge in the jet stream — just east of Greenland.”
A lack of ice cover in the Arctic Ocean north of Scandinavia gave this bubble of warmth a bit of an extra boost, intensifying its warm conveyor belt into Greenland.
Going forward, “[t]hese types of patterns are expected to occur more frequently,” Francis wrote, citing climate change as the culprit. “Arctic ice cover continues to dwindle and temperatures there soar.”
But advection — the transport of air, in this case warm, from somewhere else — is just half the battle. Adding insult to injury is a shortage of cloud cover in recent weeks over Greenland. The high pressure “block” that Francis described has also helped clear the skies, allowing more sunshine to pour in and heat the ground further.
A reanalysis showing precipitation also points to where the source of warmth in Greenland is coming from. (ClimateReanalyzer.org)
“Incoming solar radiation reached a value similar to ones we observed in August last year,” wrote Tedesco. That heats the ground even more. It’s a vicious cycle of positive feedback, indicating just how unstable — and delicate — the Arctic is.
“I call this ‘melting cannibalism,” explained Tedesco. And it could get even worse, as it preconditions the ice to be more vulnerable to melting in the summer.
When snow/ice on the ground melt, they form small pools of water. That changes how reflective the surface is — a measure scientists refer to as “albedo.” Snow and ice have a very high albedo, meaning it reflects most of the incoming light that hits it. That’s why you have to wear sunglasses when you go skiing. Water, on the other hand, is a lot less shiny, which allows it to absorb more heat, a cyclical process on a local level and a driver of additional warming on the global level.
According to the National Snow and Ice Data Center, the rate of melting this early in the year has been off the charts. Satellite imagery shows several patches of extremely early melt along the coast.
And it’s not just Greenland. Much of the Arctic has been baking. Ice melt in Alaska has set rivers gushing more than a month before normal in some places, setting records along the Kuskokwim River in Bethel, and triggering the earliest ice breakup along the Tanana River in Nenana.
https://www.washingtonpost.com/weather/2019/04/18/its-been-exceptionally-warm-greenland-lately-ice-is-melting-month-early/

Saturday, February 16, 2019

Chris Mooney, WaPo: Earth Is 'Missing' at Least 20 Ft of Sea Level Rise. Antarctica Could Be The Time Bomb

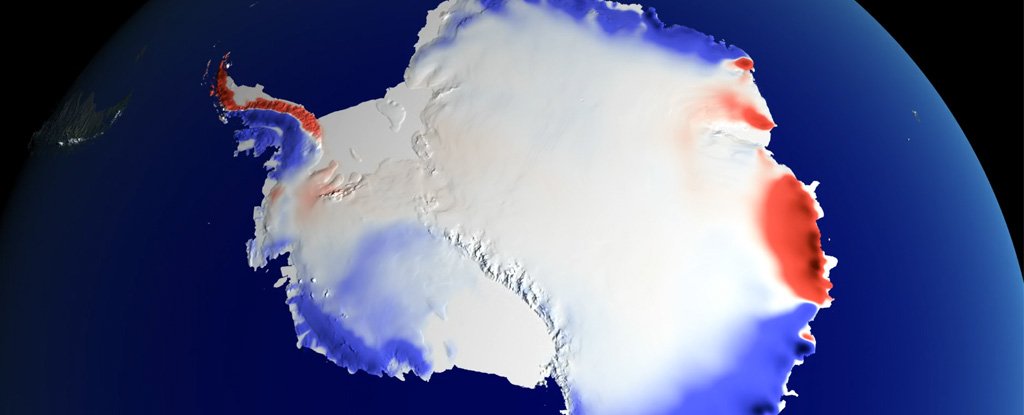
main article image

by Chris Mooney, The Washington Post, February 12, 2019

Some 115,000 years ago, Homo sapiens were still living in bands of hunter gatherers, largely confined to Africa. We still shared the globe with the Neanderthals, although it's not clear we had met them yet.

And though these various hominids didn't know it, the Earth was coming to the end of a major warm period. It was one that's quite close to our current climate, but with one major discrepancy - seas at the time were 20 to 30 feet (6 to 9 metres) higher.
During this ancient period, sometimes called the Eemian, the oceans were about as warm as they are today.
And last month, intriguing new research emerged suggesting that Northern Hemisphere glaciers have already retreated just as far as they did in the Eemian, driven by dramatic warming in Arctic regions.
The finding arose when a team of researchers working on Baffin Island, in northeastern Canada, sampled the remains of ancient plants that had emerged from beneath fast-retreating mountain glaciers.
And they found that the plants were very old indeed, and had probably last grown in these spots some 115,000 years ago.
That's the last time the areas were actually not covered by ice, the scientists believe.
"It's very hard to come up with any other explanation, except that at least in that one area where we're working ... the last century is as warm as any century in the last 115,000 years," said Gifford Miller, a geologist at the University of Colorado in Boulder who led the research on Baffin Island.
But if Miller is right, there's a big problem. We have geological records of sea levels from the Eemian. And the oceans, scientists believe, were 20 to 30 feet (6 to 9 metres) higher.
Some extra water likely came from Greenland, whose ice currently contains over 20 feet (6 metres) of potential sea level rise. But it couldn't have been just Greenland, because that entire ice sheet did not melt at the time.
That's why researchers also suspect a collapse of the most vulnerable part of Antarctica, the West Antarctic ice sheet. This region could easily supply another 10 feet (3 metres) of sea level rise, or more.
"There's no way to get tens of meters of sea level rise without getting tens of meters of sea level rise from Antarctica," said Rob DeConto, an Antarctic expert at the University of Massachusetts.
Trying to understand how Antarctica will fall
Scientists are now intensely debating precisely which processes could have played out then — and how soon they'll play out again. After all, West Antarctica has already been shown, once again, to be beginning a retreat.
Some researchers, including DeConto, think they have found a key process - called marine ice cliff collapse - that can release a lot of sea level rise from West Antarctica in a hurry.
But they're being challenged by another group, whose members suspect the changes in the past were slow - and will be again.
To understand the dispute, consider the vulnerable setting of West Antarctica itself.
Essentially, it's an enormous block of ice mostly submerged in very cold water. Its glaciers sit up against the ocean in all directions, and toward the center of the ice sheet, the seafloor slopes rapidly downward, even as the surface of the ice sheet itself grows much thicker, as much as two miles thick in total.
As much as a mile and a half of that ice rests below the sea level, but there is still plenty of ice above it, too.
So if the gateway glaciers start to move backward - particularly a glacier named Thwaites, by far the largest of them - the ocean would quickly have access to much thicker ice.
The idea is that during the Eemian, this whole area was not a block of ice at all, but an unnamed sea. Somehow, the ocean got in, toppling the outer glacial defenses, and gradually setting all of West Antarctica afloat and on course to melting.
DeConto, with his colleague David Pollard, built a model that looked to the Eemian, and another ancient warm period called the Pliocene, to try to understand how this could happen.
In particular, they included two processes that can remove glaciers. One, dubbed 'marine ice sheet instability,' describes a situation in which a partially submerged glacier gets deeper and thicker as you move toward its center.
In this configuration, warm water can cause a glacier to move backward and downhill, exposing ever thicker ice to the ocean - and thicker ice flows outward faster.
So the loss feeds upon itself.
Marine ice sheet instability is probably underway already in West Antarctica, but in the model, it wasn't enough. DeConto and Pollard also added another process that they say is currently playing out in Greenland, at a large glacier called Jakobshavn.
Jakobshavn is moving backward down an undersea hill slope, just in the way that it is feared the much larger Thwaites will drift. But Jakobshavn is also doing something else. It is constantly breaking off thick pieces at its front, almost like a loaf of bread, dropping slice after slice.
That's because Jakobshavn no longer has an ice shelf, a floating extension that used to grow out over the ocean at the front of the glacier and stabilize it. The shelf collapsed as Greenland warmed in the past two decades.
As a result, Jakobshavn now presents a steep vertical front to the sea. Most of the glacier's ice is under the water, but more than 100 meters (330 feet) extend above it - and for DeConto and Pollard, that's the problem. That's too much to be sustained.
Ice is not steel. It breaks. And breaks. And breaks.
This additional process, called 'marine ice cliff collapse,' causes an utter disaster if you apply it to Thwaites. If Thwaites someday loses its own ice shelf and exposes a vertical front to the ocean, you would have ice cliffs hundreds of meters above the surface of the water.
DeConto and Pollard say that such cliffs would continually fall into the sea. And when they added this computation, it not only recreated Eemian sea level rise, it greatly increased their projection of how much ice Antarctica could yield in this century - more than three feet.
Since there are other drivers of sea level rise, like Greenland, this meant that we could see as much as six feet in total in this century, roughly double prior projections. And in the next century, the ice loss would get even worse.
"What we pointed out was, if the kind of calving that we see in Greenland today were to start turning on in analogous settings in Antarctica, then Antarctica has way thicker ice, it's a way bigger ice sheet, the consequences would be potentially really monumental for sea level rise," DeConto said.
Moreover, the process, he argues, is essential to understanding the past - and thus how we could replicate it.
"We cannot recreate six meters of sea level rise early in the Eemian without accounting for some brittle fracture in the ice sheet model," said DeConto.
A massive debate over marine ice cliffs
Tamsin Edwards is not convinced. A glaciologist at Kings College London, she is lead author - with a number of other Antarctic experts - of a study published Wednesday in Nature (the same journal that published DeConto and Pollard in 2016) that disputes their model, in great detail.
Using a statistical technique to examine the results, Edwards and her collaborators find that the toppling of ice cliffs is not necessary to reproduce past warm periods after all.
They also present lower sea level rise possibilities from Antarctica in this century. If they're right, the worst case is back down to about 40 centimeters, or a little over a foot, rather than three to four feet.
"Things may not be as absolutely terrible as that last study predicted," Edwards said. "But they're still bad."
It is a new science, she said, and without more modeling it's unclear how ice cliffs will ultimately affect sea level rise.
But then what happened in the Eemian? Edwards thinks it just took a long time to lose West Antarctica. That it wasn't fast. After all, the entire geologic period was thousands of years long.
"We're an impatient lot, humans, and the ice sheets don't respond in a decade, they're slow beasts," she said.
DeConto says he's learned something from the critique.
"The Edwards study does illustrate the need for more in-depth statistics than we originally applied to our 2016 model output, but the models are evolving rapidly and they have already changed considerably since 2016," he said in a written statement.
But he's not backing down on marine ice cliffs. The new critique, DeConto said, implies that "these processes aren't important for future sea level rise. And I think to me, that's kind of a dangerous message."
He certainly has his allies. Richard Alley, a well known glaciologist at Penn State University who has published with DeConto and Pollard, wrote in an email that "cliff retreat is not some strange and unexpected physical process; it is happening now in some places, has happened in the past, and is expected wherever sufficiently high temperatures occur in ocean or air around ice flowing into the ocean."
The Eemian - but worse?
There's one important thing to consider - the Eemian occurred without humans emitting lots of greenhouse gases.
Atmospheric carbon dioxide was far lower than it is today. The event was instead driven by changes in the Earth's orbit around the sun, leading to more sunlight falling on the northern hemisphere.
The big difference, this time around, is that humans are heating things up far faster than what is believed to have happened in the geologic past.
And that makes a key difference, said Ted Scambos, an Antarctic researcher who is leading the US side of an international multimillion dollar mission to study Thwaites Glacier, and who is a senior researcher at the National Snow and Ice Data Center in Colorado.
"The current pace of climate change is very fast," Scambos said, and the rate of warming might cause glaciers to behave differently than they did in the past.
Accordingly, Scambos says he sees the current debate as fruitful - "it's the discussion that needs to happen" - but that it doesn't lessen his worry about the fate of Thwaites Glacier if it retreats far enough.
"There's no model that says the glacier won't accelerate if it gets into those conditions," said Scambos. "It just has to."
Humans were nowhere near the Antarctic in the Eemian - and we have never, in the modern period, seen a glacier as big as Thwaites retreat. It's possible something is going to happen that we don't have any precedent or predictions for.
Just last week, for instance, scientists reported a large cavity opening beneath one part of the glacier - something they said models could not have predicted.
There is a massive stake involved now in at least trying to figure out what could happen - before it actually does. It will help determine whether humans, now organized and industrialized and masters of fossil fuels, are poised to drive a repeat of our own geological history.
2019 © The Washington Post
Wednesday, October 31, 2018

Quantification of ocean heat uptake from changes in atmospheric O2 and CO2 composit

Nature, 563 (31 October 2018) 105-108

Quantification of ocean heat uptake from changes in atmospheric O2 and COcomposit

Abstract

The ocean is the main source of thermal inertia in the climate system1. During recent decades, ocean heat uptake has been quantified by using hydrographic temperature measurements and data from the Argo float program, which expanded its coverage after 20072,3. However, these estimates all use the same imperfect ocean dataset and share additional uncertainties resulting from sparse coverage, especially before 20074,5. Here we provide an independent estimate by using measurements of atmospheric oxygen (O2) and carbon dioxide (CO2)—levels of which increase as the ocean warms and releases gases—as a whole-ocean thermometer. We show that the ocean gained 1.33 ± 0.20  × 1022 joules of heat per year between 1991 and 2016, equivalent to a planetary energy imbalance of 0.83 ± 0.11 watts per square metre of Earth’s surface. We also find that the ocean-warming effect that led to the outgassing of O2 and CO2 can be isolated from the direct effects of anthropogenic emissions and CO2 sinks. Our result—which relies on high-precision O2 measurements dating back to 19916—suggests that ocean warming is at the high end of previous estimates, with implications for policy-relevant measurements of the Earth response to climate change, such as climate sensitivity to greenhouse gases7 and the thermal component of sea-level rise8.

https://www.nature.com/articles/s41586-018-0651-8

References

  1. 1.
    IPCC. Climate Change 2013: The Physical Science Basis (eds Stocker, T. F. et al.) (Cambridge Univ. Press, Cambridge, 2013).
  2. 2.
    Abraham, J. P. et al. A review of global ocean temperature observations: implications for ocean heat content estimates and climate change. Rev. Geophys51, 450–483 (2013).
  3. 3.
    Riser, S. C. et al. Fifteen years of ocean observations with the global Argo array. Nat. Clim. Chang e 6, 145–153 (2016).
  4. 4.
    Boyer, T. et al. Sensitivity of global upper-ocean heat content estimates to mapping methods, XBT bias corrections, and baseline climatologies. J. Clim29, 4817–4842 (2016).
  5. 5.
    Cheng, L. et al. XBT science: assessment of instrumental biases and errors. Bull. Am. Meteorol. Soc97, 924–933 (2016).
  6. 6.
    Keeling, R. F. & Manning, A. C. in Treatise on Geochemistry 385–404 (Elsevier, Oxford, 2014).
  7. 7.
    Forster, P. M. Inference of climate sensitivity from analysis of Earth’s energy budget. Annu. Rev. Earth Planet. Sci44, 85–106 (2016).
  8. 8.
    Church, J. A. et al. in Climate Change 2013: The Physical Science Basis (eds Stocker, T. F. et al.) 1137–1216 (IPCC, Cambridge Univ. Press, Cambridge, 2013).
  9. 9.
    Ishii, M. et al. Accuracy of global upper ocean heat content estimation expected from present observational data sets. Sci. Online Lett. Atmos13, 163–167 (2017).
  10. 10.
    Johnson, G. C. et al. Ocean heat content. Am. Meteorol. Soc. Bull98, S66–S68 (2017).
  11. 11.
    Desbruyères, D. G., Purkey, S. G., McDonagh, E. L., Johnson, G. C. & King, B. A. Deep and abyssal ocean warming from 35 years of repeat hydrography. Geophys. Res. Lett43, 10356–10365 (2016).
  12. 12.
    Cheng, L. et al. Improved estimates of ocean heat content from 1960 to 2015. Sci. Adv3, e1601545 (2017).
  13. 13.
    Allan, R. P. et al. Changes in global net radiative imbalance 1985–2012. Geophys. Res. Lett41, 5588–5597 (2014).
  14. 14.
    Palmer, M. D. Reconciling estimates of ocean heating and Earth’s radiation budget. Curr. Clim. Change Rep3, 78–86 (2017).
  15. 15.
    Loeb, N. G. et al. Observed changes in top-of-the-atmosphere radiation and upper-ocean heating consistent within uncertainty. Nat. Geosci5, 110–113 (2012).
  16. 16.
    Battle, M. et al. Measurements and models of the atmospheric Ar/N2 ratio. Geophys. Res. Lett30, 1786 (2003).
  17. 17.
    Ritz, S. P., Stocker, T. F. & Severinghaus, J. P. Noble gases as proxies of mean ocean temperature: sensitivity studies using a climate model of reduced complexity. Quat. Sci. Rev30, 3728–3741 (2011).
  18. 18.
    Resplandy, L. et al. Constraints on oceanic meridional heat transport from combined measurements of oxygen and carbon. Clim. Dyn47, 3335–3357 (2016); erratum 49, 4317 (2017).
  19. 19.
    Stephens, B. B. et al. Testing global ocean carbon cycle models using measurements of atmospheric O2 and CO2 concentration. Glob. Biogeochem. Cycles12, 213–230 (1998).
  20. 20.
    Le Quéré, C. et al. Global carbon budget 2016. Earth Syst. Sci. Data 8, 605–649 (2016).
  21. 21.
    DeVries, T. The oceanic anthropogenic CO2 sink: storage, air-sea fluxes, and transports over the industrial era. Glob. Biogeochem. Cycles 28, 631–647 (2014).
  22. 22.
    Wang, R. et al. Influence of anthropogenic aerosol deposition on the relationship between oceanic productivity and warming. Geophys. Res. Lett42, 10745–10754 (2015).
  23. 23.
    Rietbroek, R., Brunnabend, S.-E., Kusche, J., Schröter, J. & Dahle, C. Revisiting the contemporary sea-level budget on global and regional scales. Proc. Natl Acad. Sci. USA 113, 1504–1509 (2016).
  24. 24.
    IPCC. Climate Change 2007: Synthesis Report (eds Core Writing Team, Pachauri, R. K. & Reisinger, A.) (IPCC, Geneva, 2008).
  25. 25.
    Keeling, R. F. & Severinghaus, J. P. in The Carbon Cycle (eds Wigley, T. M. L. & Schimel, D.) 134–140 (Cambridge Univ. Press, New York, 2000).
  26. 26.
    Resplandy, L., Séférian, R. & Bopp, L. Natural variability of CO2 and O2 fluxes: what can we learn from centuries-long climate models simulations? J. Geophys. Res. Oceans 120, 384–404 (2015).
  27. 27.
    Eddebbar, Y. A. et al. Impacts of ENSO on air-sea oxygen exchange: observations and mechanisms. Glob. Biogeochem. Cycles 31, 2017GB005630 (2017).
  28. 28.
    Keeling, R. F. & Garcia, H. E. The change in oceanic O2 inventory associated with recent global warming. Proc. Natl Acad. Sci. USA 99, 7848–7853 (2002).
  29. 29.
    Bopp, L., Le Quéré, C., Heimann, M., Manning, A. C. & Monfray, P. Climate-induced oceanic oxygen fluxes: implications for the contemporary carbon budget. Glob. Biogeochem. Cycles 16, 1022 (2002).
  30. 30.
    Keeling, C. D., Piper, S. C., Whorf, T. P. & Keeling, R. F. Evolution of natural and anthropogenic fluxes of atmospheric CO2 from 1957 to 2003. Tellus B Chem. Phys. Meterol63, 1–22 (2011).
  31. 31.
    Levitus, S. et al. World ocean heat content and thermosteric sea level change (0–2000 m), 1955–2010. Geophys. Res. Lett39, L10603 (2012).
  32. 32.
    Olsen, A. et al. The Global Ocean Data Analysis Project version 2 (GLODAPv2)—an internally consistent data product for the world ocean. Earth Syst. Sci. Data 8, 297–323 (2016).
  33. 33.
    Severinghaus, J. P. Studies of the Terrestrial O 2 and Carbon Cycles in Sand Dune Gases and in Biosphere. PhD Thesis, Columbia Univ. (1995).
  34. 34.
    Hamme, R. C. & Keeling, R. F. Ocean ventilation as a driver of interannual variability in atmospheric potential oxygen. Tellus B Chem. Phys. Meterol60, 706–717 (2008).
  35. 35.
    Andres, R. J., Boden, T. A. & Higdon, D. A new evaluation of the uncertainty associated with CDIAC estimates of fossil fuel carbon dioxide emission. Tellus B Chem. Phys. Meterol66, 23616 (2014).
  36. 36.
    Keeling, R. F., Manning, A. C., Paplawsky, W. J. & Cox, A. C. On the long-term stability of reference gases for atmospheric O2/N2 and CO2 measurements. Tellus B Chem. Phys. Meterol59, 3–14 (2007).
  37. 37.
    Ballantyne, A. P. et al. Audit of the global carbon budget: estimate errors and their impact on uptake uncertainty. Biogeosciences 12, 2565–2584 (2015).
  38. 38.
    Bronselaer, B., Winton, M., Russell, J., Sabine, C. L. & Khatiwala, S. Agreement of CMIP5 simulated and observed ocean anthropogenic CO2 uptake. Geophys. Res. Lett44, 12298–12305 (2017).
  39. 39.
    Oeschger, H., Siegenthaler, U., Schotterer, U. & Gugelmann, A. A box diffusion model to study the carbon dioxide exchange in nature. Tellus 27, 168–192 (1975).
  40. 40.
    MacFarling Meure, C. et al. Law Dome CO2, CH4 and N2O ice core records extended to 2000 years BP. Geophys. Res. Lett33, L14810 (2006).
  41. 41.
    Wang, D., Gouhier, T. C., Menge, B. A. & Ganguly, A. R. Intensification and spatial homogenization of coastal upwelling under climate change. Nature 518, 390–394 (2015).
  42. 42.
    Ito, T., Nenes, A., Johnson, M. S., Meskhidze, N. & Deutsch, C. Acceleration of oxygen decline in the tropical Pacific over the past decades by aerosol pollutants. Nat. Geosci9, 443–447 (2016).
  43. 43.
    Jickells, T. D. et al. A reevaluation of the magnitude and impacts of anthropogenic atmospheric nitrogen inputs on the ocean. Glob. Biogeochem. Cycles 31, 289–305 (2017).
  44. 44.
    Somes, C. J., Landolfi, A., Koeve, W. & Oschlies, A. Limited impact of atmospheric nitrogen deposition on marine productivity due to biogeochemical feedbacks in a global ocean model. Geophys. Res. Lett43, 4500–4509 (2016).
  45. 45.
    Aumont, O., Ethé, C., Tagliabue, A., Bopp, L. & Gehlen, M. PISCES-v2: an ocean biogeochemical model for carbon and ecosystem studies. Geosci. Model Dev8, 2465–2513 (2015).
  46. 46.
    Talley, L. D. et al. Changes in ocean heat, carbon content, and ventilation: a review of the first decade of GO-SHIP global repeat hydrography. Annu. Rev. Marine Sci8, 185–215 (2016).
  47. 47.
    Sarmiento, J. L. & Gruber, N. Sinks for anthropogenic carbon. Phys. Today 55, 30–36 (2002).
  48. 48.
    Garcia, H. E. & Gordon, L. I. Oxygen solubility in seawater: better fitting equations. Limnol. Oceanogr37, 1307–1312 (1992).
  49. 49.
    Gruber, N., Sarmiento, J. L. & Stocker, T. F. An improved method for detecting anthropogenic CO2in the oceans. Glob. Biogeochem. Cycles 10, 809–837 (1996).
  50. 50.
    Dunne, J. P. et al. GFDL’s ESM2 global coupled climate–carbon Earth system models. Part I: physical formulation and baseline simulation characteristics. J. Clim25, 6646–6665 (2012).
  51. 51.
    Dunne, J. P. et al. GFDL’s ESM2 global coupled climate–carbon Earth system models. Part II: carbon system formulation and baseline simulation characteristics. J. Clim26, 2247–2267 (2013).
  52. 52.
    Séférian, R., Iudicone, D., Bopp, L., Roy, T. & Madec, G. Water mass analysis of effect of climate change on air–sea CO2 fluxes: the Southern Ocean. J. Clim25, 3894–3908 (2012).
  53. 53.
    Kay, J. E. et al. The Community Earth System Model (CESM) large ensemble project: a community resource for studying climate change in the presence of internal climate variability. Bull. Am. Meteorol. Soc96, 1333–1349 (2015).
  54. 54.
    Keller, D. P., Oschlies, A. & Eby, M. A new marine ecosystem model for the University of Victoria Earth System Climate Model. Geosci. Model Dev5, 1195–1220 (2012).
  55. 55.
    Bopp, L. et al. Multiple stressors of ocean ecosystems in the 21st century: projections with CMIP5 models. Biogeosciences 10, 6225–6245 (2013).
  56. 56.
    Keller, D. P., Kriest, I., Koeve, W. & Oschlies, A. Southern Ocean biological impacts on global ocean oxygen. Geophys. Res. Lett43, 6469–6477 (2016).
  57. 57.
    Long, M. C., Deutsch, C. & Ito, T. Finding forced trends in oceanic oxygen. Glob. Biogeochem. Cycles30, 381–397 (2016).
  58. 58.
    Taylor, K. E., Stouffer, R. J. & Meehl, G. A. An overview of CMIP5 and the experiment design. Bull. Am. Meteorol. Soc93, 485–498 (2012).
  59. 59.
    Moore, J. K., Lindsay, K., Doney, S. C., Long, M. C. & Misumi, K. Marine ecosystem dynamics and biogeochemical cycling in the Community Earth System Model [CESM1(BGC)]: comparison of the 1990s with the 2090s under the RCP4.5 and RCP8.5 scenarios. J. Clim26, 9291–9312 (2013).
  60. 60.
    Rödenbeck, C., Le Quéré, C., Heimann, M. & Keeling, R. F. Interannual variability in oceanic biogeochemical processes inferred by inversion of atmospheric O2/N2 and CO2 data. Tellus B Chem. Phys. Meterol60, 685–705 (2008).
  61. 61.
    Hamme, R. C. Mechanisms controlling the global oceanic distribution of the inert gases argon, nitrogen and neon. Geophys. Res. Lett29, 35-1–35-4 (2002).
  62. 62.
    Trenberth, K. E., Fasullo, J. T., von Schuckmann, K. & Cheng, L. Insights into Earth’s energy imbalance from multiple sources. J. Clim29, 7495–7505 (2016).
  63. 63.
    WCRP Global Sea Level Budget Group. Global sea level budget 1993–present. Earth Syst. Sci. Data 10, 1551–1590 (2018).
  64. 64.
    Morice, C. P., Kennedy, J. J., Rayner, N. A. & Jones, P. D. Quantifying uncertainties in global and regional temperature change using an ensemble of observational estimates: the HadCRUT4 data set. J. Geophys. Res. Atmos117, D08101 (2012).
  65. 65.
    Hansen, J., Ruedy, R., Sato, M. & Lo, K. Global surface temperature change. Rev. Geophys48, RG4004 (2010).
  66. 66.
    Vose, R. S. et al. NOAA’s merged land–ocean surface temperature analysis. Bull. Am. Meteorol. Soc93, 1677–1685 (2012).
  67. 67.
    Keeling, R. F., Körtzinger, A. & Gruber, N. Ocean deoxygenation in a warming world. Annu. Rev. Mar. Sci2, 199–229 (2010).
  68. 70.
    Schmidtko, S., Stramma, L. & Visbeck, M. Decline in global oceanic oxygen content during the past five decades. Nature 542, 335–339 (2017).
  69. 68.
    Helm, K. P., Bindoff, N. L. & Church, J. A. Observed decreases in oxygen content of the global ocean. Geophys. Res. Lett38, L23602 (2011).
  70. 69.
    Ito, T., Minobe, S., Long, M. C. & Deutsch, C. Upper ocean O2 trends: 1958–2015. Geophys. Res. Lett44, 4214–4223 (2017).