Blog Archive

Showing posts with label sea surface temperature anomalies. Show all posts

Friday, January 12, 2018

Joe Romm: Stunning NASA chart shows how fast the ground beneath our feet is heating up

The land is warming twice as fast as the oceans … too bad we live on the land

by Joe Romm, Climate Progress, August 22, 2017

ANNUAL (THIN LINES) AND FIVE-YEAR LOWESS SMOOTH (THICK LINES) FOR THE TEMPERATURE ANOMALIES AVERAGED OVER THE EARTH’S LAND AREA AND SEA SURFACE TEMPERATURE ANOMALIES. CREDIT: NASA
Global temperatures are rising faster on the land, where we live, than the oceans, where we don’t, NASA charts reveal. Since scientists have long predicted this trend and say it will continue, it’s worth a closer look.
Let’s start with the long-term global warming trend. According to NOAA, “Since 1880, surface temperature has risen at an average pace of 0.13 °F (0.07 °C) every 10 years, for a net warming of 1.71 °F (0.95 °C).”
But the warming is not evenly distributed: “Over this 136-year period, average temperature over land areas has warmed faster than ocean temperatures: 0.18 °F (0.10 °C) per decade compared to 0.11 °F (0.06 °C) per decade.” So over the entire record, the land is warming nearly 70 percent faster than the oceans.
But the warming is also speeding up. Over the last 45 years, surface temperature has been rising at an average rate of around 0.3 °F per decade — more than double the rate over the whole 135-year period. This speed up was also predicted. After all, emissions of CO2, the most important heat-trapping greenhouse gas, have increased by a factor of six since 1950 — and the rise of overall CO2 levels has sped up.
The disparity between the rate of land and ocean warming has also gotten bigger.  NASA Goddard Institute for Space Studies (GISS) recently posted some charts that show just how much faster it has been warming in recent decades — and how much the  disparity has grown.
In the past six decades, land temperatures have risen about  2.3 °F, a warming rate of nearly 0.4 °F a decade, as the top chart shows. That’s nearly double the temperature rise of the ocean, which is 1.25 °F per decade. Moreover, in the past 30 years, the rate of warming appears to have sped up even more, with land temperatures rising more than 0.6 °F a decade. That’s now a bit more than double the ocean warming.
But the key point, of course is that we live on the land. So when you see a rate of global warming quoted, remember, the rate of warming where we live is much higher — and growing fast.
Finally, you may be wondering why temperatures over the land are warming so much faster than temperatures over the ocean. Part of the reason is that the heat capacity of the ocean is so much greater than that of the land so its initial temperature response to warming is slower. As one explainer put it, “Think of the hot sand and cool water at the beach in the summer.” This is also why the ocean stores more than 90% of all of the excess heat from global warming.
Part of the reason the ocean warms more slowly is that much of the heating of the ocean goes into evaporation. But the land, particularly the drier parts of the planet, don’t have much moisture to evaporate  so much more of the global warming goes directly into temperature rise. For those technically minded readers who want a fuller explanation, start with this 2009 study, “Understanding Land–Sea Warming Contrast in Response to Increasing Greenhouse Gases.” Then try this 2013 study.
https://thinkprogress.org/global-warming-now-twice-as-fast-over-land-than-the-ocean-nasa-chart-shows-52b4afe01345/

Saturday, September 23, 2017

John Abraham: It takes just 4 years to detect human warming of the oceans

Our new paper illustrates the rapid, consistent warming of Earth’s oceans

Bondi Beach in Sydney, Australia.
 Bondi Beach in Sydney, Australia. Photograph: Mick Tsikas/AAP
by John Abraham, "Climate Consensus  The 97%," The Guardian, September 20, 2017

We’ve known for decades that the Earth is warming, but a key question is, how fast? Another key question is whether the warming is primarily caused by human activities. If we can more precisely measure the rate of warming and the natural component, it would be useful for decision makers, legislators, and others to help us adapt and cope. Indeed, added ocean heat content underlies the potential for dangerous intense hurricanes.
An answer to the “how fast?” question was partly answered in an Opinion piece just published on Eos.org, the daily online Earth and space science news site, by scientists from China, Europe, and the United States. I was fortunate enough to be part of the research team.
Study authors Dr. John Fasullo, Dr. Kevin Trenberth, and Dr. Lijing Cheng (co-authors Timothy Boyer, John Abraham, and Karina von Shuckmann not shown).
 Study authors Dr. John Fasullo, Dr. Kevin Trenberth, and Dr. Lijing Cheng (co-authors Timothy Boyer, John Abraham, and Karina von Shuckmann not shown).

To measure how fast the globe is warming, we focused on the extra heat that is being trapped in the climate. The key to measuring the extra heat is by comparing the incoming and outgoing energy – just like you watch your bank account, keeping track of income and expenses to tell whether your bank balance will increase or not.
Okay so how do we measure these incoming and outgoing flows? In our view, the best way is in the oceans. We know that the oceans absorb almost all of the excess heat – so, perhaps we can detect energy increases in ocean waters.
Measuring the oceans is challenging. They are vast and they are deep – measurements can be noisy. Detecting a long-term trend (a signal) within the noise can be a challenge. But this challenge is exactly what we focused on. We wanted to know how large the signal-to-noise ratio is for ocean heat measurements, because this would tell us how many years of data are needed to detect warming. Can we detect global warming with one year of measurements? With a decade? Or do we need multiple decades of measurements to be sure the climate is changing?
Our work shows that scientists need less than 4 years of ocean heat measurements to detect a warming signal. This is much shorter than the nearly three decades of measurements that would be required to detect global warming if we were to use temperatures of air near the Earth’s surface. It is also slightly better than the nearly 5 years of sea level rise data that are needed for detecting a long-term trend. This means that the warming is not natural but rather stems from the human-induced climate change, primarily from increases in heat-trapping gases in the atmosphere.
This finding should help change the way we talk about global warming. Normally, scientists and the public wait for the official annual “global temperatures” to be released (every January or February) by major research groups like NASA, NOAA, and the Hadley Centre in the UK. Avid consumers of global warming news often use these air temperatures to “prove” or “disprove” global warming. If it was hot last year, “It's global warming!” If last year was cool, “Global warming is over!” 
But the year-to-year fluctuations of air temperatures are predominantly associated with El Niño and weather variability and mislead those who use any one year as climate-change proof. We saw the impact of fluctuations over the past two decades, when a slowing of the rise of global surface temperatures led to false claims that global warming had “stopped” or that there was a “hiatus.” No such cessation occurred for ocean heat content.
Hence, global ocean heat content data isn’t so noisy. It represents the total thermal energy in the ocean waters and is now known with a high degree of certainty (see the figure below), in part because scientists have improved ocean temperature sensing methods and increased the number of sensors throughout the ocean waters. 
Increases in ocean heat content since 1950s.
Pinterest
 Increases in ocean heat content since 1950s. Illustration: Cheng, L., K. E. Trenberth, J. Fasullo, J. Abraham, T. P. Boyer, K. von Schuckmann, and J. Zhu (2017), Taking the pulse of the planet, Eos, Vol. 98.

According to our analysis, the top 10 warmest years of ocean heat content are all in the most recent decade (following 2006), with the last two years being the hottest. The heat storage in the ocean corresponds to 3 × 10²³ Joules (a 3 with twenty-three zeroes after it) since 1960. Prior to the 1980s, values are not as well known, and the global record is unreliable prior to about 1960.
In the most recent 25 years, the Earth has gained approximately 0.7 Watts for every square meter of surface area. That may not sound like much, but think about how many square meters are required to cover the surface of the Earth. To put these numbers in perspective, the heat increase in the oceans since 1992 is about 2,000 times the total net generation of electricity in the USA in the past decade.
We believe, and argue, that ocean heat content is the key to quantifying how fast the climate is changing, and it has important implications for regional patterns of climate. According to Trenberth:
A key reason for the exceptionally active Atlantic hurricane season this year is because of the regional build-up of ocean heat, along with its global warming component, that fuels hurricanes.
“Ocean Heat Content” should become a standard metric not only for measuring climate change but for testing our computer models that are used to predict the future climate.

Sunday, June 28, 2015

Most Extreme Weather Has Climate Change Link, Study Says

Global warming has created a 'new normal,' scientists say, and the old hesitance to attribute extreme weather to climate change is outdated.

In the wake of major hurricanes, floods and heat waves, scientists are quick to say that no single weather event can be attributed to climate change until careful analysis draws that conclusion. Now, a new study argues that thinking is backwards, that all extreme weather has a link to climate change.

The default position has been holding science back in connecting weather and climate, concludes the authors of a peer-reviewed paper published Monday in Nature Climate Change.

This "could be a game changer in how these studies are done in [the] future," lead author Kevin Trenberth said in an email.

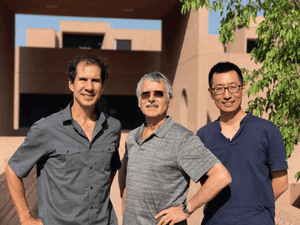
Trenberth is a senior scientist at the National Center for Atmospheric Research (NCAR), and one of three researchers behind the study.

The paper presents a new research technique that grew out of an idea Trenberth first proposed at a conference in 2010. It also provides scientists examples of how to apply the method, and challenges the conclusions of a 2014 paper that found no climate influence in the massive floods that swept Boulder, Colo., in 2013.

Trenberth said his approach is new, and conventional research methods still dominate the field.

Traditionally, researchers begin with a default assumption that the extreme weather event they're examining is not influenced by human-caused climate change. They then run computer models or other tests to see if global warming has increased the intensity or likelihood of that event.

But Trenberth's team says this method can lead to "false negatives" that underestimates the role of climate change. It's particularly problematic when scientists are studying extreme weather driven by atmospheric circulation—factors such as weather patterns and storm patterns—when it's difficult to separate the influence of climate change from natural variability.

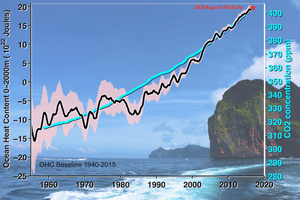
Trenberth's paper instead suggests focusing on thermodynamic changes caused by global warming, such as increased sea-surface temperatures, humidity and sea level rise. Unlike atmospheric circulation patterns, scientists have a much better understanding of how climate change affects thermodynamic shifts, said study co-author John Fasullo, a NCAR project scientist.

According to the study, these warming-fueled changes play an important role in increasing the intensity of storms and the impact of storm surges, creating "a new normal" in the underlying conditions that influence all weather events.

"Because global warming is real and present, it is not a question as to whether it is playing a role, but what that role is," the authors wrote.

"We're not even interested in the question of the cause," Fasullo explained. "We're trying to understand the influence climate change will have on extreme weather events."

In fact, Fasullo says, even the term "new normal" can be misleading, because it implies that the climate is no longer changing, when in reality the climate won't stabilize until greenhouse gas concentrations in the atmosphere level off.

Trenberth said he expects pushback from scientists who favor the older methods, but he believes "a sea change is in order with the conservative scientists and we need to stop proving over and over again that climate change is having effects...I hope that it leads to more fruitful studies and better communications with the public."

Higher Seas, Higher Temps

The Earth had droughts and hurricanes long before humans, but we're "changing the way these events unfold," Fasullo said. "So from our point of view, this default assumption of no climate change [influence] is a poor place to start the quantitative analysis. You wouldn't want to assume nothing is changing."

Kerry Emanuel, a professor of atmospheric science at the Massachusetts Institute of Technology who wasn't involved in study, agreed that a lot of evidence now points to conditions changing because of global warming. But, he said, many scientists would prefer to stick with the default assumption that extreme weather events are not influenced by climate change until proven otherwise.

"The real crux of the matter is not fooling yourself" into a false sense of confidence, he said. "Scientists are very guarded about that possibility."

The study gives several examples of how to use the new method. Supertyphoon Haiyan, which hit the Philippines in November 2013, was driven in large part by the natural variability of sea surface temperatures in the Pacific Ocean. But the storm surge was made worse by an increase in local sea levels, which were nearly 12 inches higher than they were in 1993.

Another example is the "snowmageddon" storm that hit Washington, D.C., in February 2010. The intensity of the blizzard—which dropped up to three feet of snow in the mid-Atlantic region—was influenced by high sea-surface temperatures in the tropical Atlantic (2.7 degrees Fahrenheit above normal), which brought large amounts of moisture into the storm.

In a third example, Trenberth's paper disputed the conclusions of a 2014 study published in the Bulletin of the American Meterological Society, which found that the 2013 Boulder floods were caused by an extremely rare concurrence of weather patterns that brought a huge amount of moisture over the region—and climate change played no discernible factor in that setup. But Trenberth's team said the excessive moisture was enabled by unusually high sea-surface temperatures off the coast of Mexico.

'Preparing for the Last Disaster'

Emanuel said Trenberth's new approach isn't wrong, but it's open to misinterpretation because it doesn't consider all aspects of climate change's possible impacts.

For instance, the research method might show that a storm identical to Haiyan would have had a smaller impact if it had hit the Philippines 100 years ago. That information is useful, but it has to be interpreted correctly in a limited context, Emanuel said. "It is a very narrowly posed and narrowly answered question."

Further analysis would be required to answer other related questions, such as, what is the probability that Haiyan would have formed at all under the lower sea-surface temperatures of the past? And is it more or less likely to have followed Haiyan's exact same storm track? Those answers would provide a more complete picture of global warming's impacts, he said.

The study also has implications for disaster planning. If climate change exerts an even bigger influence on extreme weather than previously thought, then it emphasizes how the U.S. is "woefully underprepared in regards to climate adaptation planning," said Melanie Gall, a University of South Carolina professor who studies disaster risk and emergency management.

"All of our current planning is so retrospective," Gall said. "We always prepare for the last disaster" instead of looking at future risks and how conditions will change with global warming, she said.

Many of the states that are most vulnerable to extreme weather—including Texas, Louisiana, Mississippi and Florida—are politically conservative, and don't consider climate change on a state level, she said. "I think what this study shows," she added, "is we need to plan for it, and it needs to be recognized, and not wait until we have the perfect evidence."

http://insideclimatenews.org/news/23062015/most-extreme-weather-has-climate-change-link-study-says-global-warming-trenberth-ncar-sea-levels

Monday, June 22, 2015

Kevin Trenberth: Human influence on extreme climate events is greater than conventional analyses suggest

News Release Summary for Trenberth et al. Nature Climate Change paper.

Human-caused climate change is making many weather and climate extremes more frequent and/or intense.

The conventional approach to extreme event attribution tends to underestimate the human influence. A new paper “Attribution of climate extreme events” by Kevin Trenberth and colleagues in Nature Climate Change suggests that addressing this problem lies, in part, in separating atmospheric dynamics from thermodynamics.

Atmospheric dynamics deals with the phenomena and their development and movement; they are short-lived and inherently unpredictable. Indeed, extreme weather events are by their nature always unique. On the other hand, thermodynamics involves changes in temperature and temperature extremes, and the associated changes in atmospheric moisture vapor that lead to more intense rains and flood risks, as well as droughts in which the extra heat from increased greenhouse gases accumulates. For these larger thermodynamic influences, more reliable and useful statements can be made about the role of human-caused climate change in extreme events.

Thus, a more robust and societally relevant approach to extreme event attribution is to look at how the impacts of particular events were affected by observed changes in the environment where they develop: the air and sea surface temperature, sea level, and atmospheric moisture content.

The paper notes that sea-surface temperatures have increased by about 0.6 °C or 1 °F globally since the 1950s due to human-caused warming. Atmospheric moisture associated with this increase has risen by about 5%. Global sea level has risen by about 19 cm or 7.5 inches, with regional variations. These factors play a key role in feeding moisture into storms, intensifying them, causing heavy rains, and amplifying storm surges. Among the several examples discussed in the paper are these two:

In October 2012’s Superstorm Sandy, for example, high sea-surface temperatures were responsible for greatly increasing the storm’s strength (as measured by storm depth and wind speed) and for increasing precipitation by 35%. Even if just a third or a half of the increased sea-surface temperature is attributable to human-caused warming, then the storm surge and associated damage was considerably influenced by climate change. Indeed, the subways and tunnels might not have flooded without the warming-induced increases in sea level and storm intensity and size, putting the price tag of human-caused warming on this storm in the tens of billion of dollars.

In the Boulder floods of September 2013, extremely high sea-surface temperatures off the west coast of Mexico, and the associated record atmospheric water vapor amounts that flowed into Colorado as a result, were instrumental in the event, and it probably would not have occurred without human-caused warming. Such an increase in atmospheric water vapor becomes concentrated when focused by topography, as it did in Boulder, and further amplified on the ground as water drains into channels and rivers. This suggests an important role for human-caused warming in those Boulder floods.

In summary, the paper emphasizes that the climate is changing. We have a new normal. The environment in which all weather events occur is not what it used to be: all storms, without exception, are different. Even if they look like ones we used to have, they are not the same. The most useful way to evaluate the effects of human-caused warming on extreme events is to focus on the influences of the changed large-scale thermodynamic environment on the extremes of temperatures and moisture associated with the event.

Sunday, June 7, 2015

Earth has warmed as usual, with no slowdown

US scientists re-examine the collection of data which seemed to show global warming slowing since 1998 and say temperatures have continued to rise steadily

by Tim Radford, Climate News Network, June 7, 2015

LONDON − Forget about the so-called “hiatus” in global warming. The planet’s average temperatures are notching up as swiftly now as they did 20 or 30 years ago.

A team of US researchers has looked again not just at the data for the last 60 years but at how it has been collected, and done the sums again. They conclude, in the journal Science,  that the “estimate for the rate of warming during the first 15 years of the 21st century is at least as great as the last half of the 20th century. These results do not support the notion of a ‘slowdown’ in the increase of global surface temperature rise.”

But first, the story-so-far. Climate sceptics have repeatedly claimed that global warming has slowed or stopped. This was not the case: 13 of the hottest years ever recorded have all occurred in the last 14 years, and 2014 was the hottest of them all.

But when climate scientists looked at a graph of the rise of temperatures in the last 60 years, they saw – or thought they saw – a distinct drop in the rate of increase in global average temperatures in the last 15 years.

This apparent dip became the subject of a whole series of studies. Researchers had never expected the rise to follow a straight line – all sorts of natural climate cycles would naturally affect annual records – but the rate of increase was slower, and more sustained in its slowness, than anyone could explain, especially as there had been no drop in the greenhouse gas emissions that drive global warming.

Data anomalies

Some proposed that the expected extra heat in the atmosphere had been drawn down into the great oceans and others that an unnoticed increase in volcanic activity had helped screen the sunlight and cool the atmosphere unexpectedly. Yet another group looked not at average temperature patterns but the change in the frequency of heat waves and saw a different kind of rise.

Yet another group wondered if the problem might be only apparent: more complete data from many more parts of the world might combine to tell a different story. Thomas Karl and colleagues at the National Oceanographic and Atmospheric Administration in the US made this their starting point.

They looked again at how the data had been collected, and the gaps that might have appeared. Sea surface temperatures, for instance, were at different periods collected by bucket from a ship’s deck, by readings aboard surface drifting and moored buoys or by engine-intake thermometers in ships’ engine rooms, and there could be subtle differences not accounted for.

There were very few readings from the Arctic, yet the Arctic is by far the fastest-warming region of the planet, and the pattern of land-based temperature readings, too, repaid re-examination.

By the time the NOAA team had finished, the recalibrated figures told a different story. Between 1998 and 2012, the world warmed at the rate of 0.086 °C per decade, more than twice the rate of 0.039 °C per decade measured by the Intergovernmental Panel on Climate Change.

The new figure is much closer to the rate estimated for the decades 1950 to 1999, at 0.113 °C per decade. And the new analysis lifts the rate of warming from 2000 to 2014 to 0.116 °C per decade, which if anything is an acceleration, not a slowdown.

British climate scientists have welcomed the finding: it is however the finding of just one group and, like all such research, will be accepted more readily if it can be separately replicated.

“This study makes the important point that we need to look really carefully at data quality and issues of instrument change,” said Piers Forster, professor of climate change at the University of Leeds, UK.

”Yet there are several legitimate judgment calls made when combining datasets to make a global mean-time series. I still don’t think this study will be the last word on this complex subject.”

But Peter Wadhams, a professor of ocean physics at the University of Cambridge, UK, called the study careful and persuasive, and said: “I think it shows clearly that the so-called ‘hiatus’ does not exist and that global warming has continued over the past few years at the same rate as in earlier years.” 

Sunday, November 16, 2014

Sea surface temperature anomaly breaks September record

from Science Daily, November 14, 2014


Figure 1. (a) NOAA Sea Surface Temperature anomaly (with respect to period 1854-2013) averaged over global oceans (red) and over North Pacific (0-60o N, 110o E-100o W) (cyan). September 2014 temperatures broke the record for both global and North Pacific Sea Surface Temperatures. (b) Sea Surface Temperature anomaly of September 2014 from NOAA's ERSST dataset. Credit: Axel Timmermann.  [Click to enlarge image]
"This summer has seen the highest global mean sea surface temperatures ever recorded since their systematic measuring started. Temperatures even exceed those of the record-breaking 1998 El Niño year," says Axel Timmermann, climate scientist and professor, studying variability of the global climate system at the International Pacific Research Center, University of Hawaii at Manoa.
From 2000-2013 the global ocean surface temperature rise paused, in spite of increasing greenhouse gas concentrations. This period, referred to as the Global Warming Hiatus, raised a lot of public and scientific interest. However, as of April 2014 ocean warming has picked up speed again, according to Timmermann's analysis of ocean temperature datasets.
"The 2014 global ocean warming is mostly due to the North Pacific, which has warmed far beyond any recorded value and has shifted hurricane tracks, weakened trade winds, and produced coral bleaching in the Hawaiian Islands," explains Timmermann.
He describes the events leading up to this upswing as follows: Sea-surface temperatures started to rise unusually quickly in the extratropical North Pacific already in January 2014. A few months later, in April and May, westerly winds pushed a huge amount of very warm water usually stored in the western Pacific along the equator to the eastern Pacific. This warm water has spread along the North American Pacific coast, releasing into the atmosphere enormous amounts of heat -- heat that had been locked up in the Western tropical Pacific for nearly a decade.
"Record-breaking greenhouse gas concentrations and anomalously weak North Pacific summer trade winds, which usually cool the ocean surface, have contributed further to the rise in sea surface temperatures. The warm temperatures now extend in a wide swath from just north of Papua New Guinea to the Gulf of Alaska," says Timmermann.
The current record-breaking temperatures indicate that the 14-year-long pause in ocean warming has come to an end.  [This is wrong -- there was no pause.]

Story Source:
The above story is based on materials provided by University of Hawaii ‑ SOEST
Note: Materials may be edited for content and length.

http://www.sciencedaily.com/releases/2014/11/141114090009.htm

Saturday, February 1, 2014

Atlantic changes are warming Antarctic

More evidence has emerged that changing climate in one region can have unpredictable effects many thousands of miles away.

by Tim Radford, Climate News Network, January 31, 2014

LONDON, 31 January - The Antarctic Peninsula is now the strongest-warming region on the planet. Blame that on changes in the faraway North and tropical Atlantic Ocean.

Xichen Li of New York University in the US and colleagues matched sea surface temperature variations in the northern Atlantic over a three-decade period against long-term changes in the Antarctic. They found a clear correlation, they report in Nature.

They also observed that warming Atlantic waters were followed by changes in sea level pressure in the Antarctic’s Amundsen Sea, and these changes also preceded changes in sea ice between the Ross and Amundsen-Bellinghausen-Weddell Sea. Both stretches of water lie many thousands of miles south of the Atlantic.

Correlations are not causes, so the authors then followed up their observational data by experiments with computer models of the global atmosphere. When they simulated a warming of the North Atlantic, the model “changed” the climate in Antarctica.

That Pacific Ocean temperatures can affect Antarctica is no surprise: such things have been linked to the El Niño cycle, a periodic natural pulse of heat in the equatorial Pacific.

Icy paradox

But until this study, no-one had thought to link Antarctica with long-term changes in the North Atlantic,and  in particular, a climatic phenomenon known as the Atlantic multidecadal oscillation, a cycle of natural warming and cooling that can last for 20 to 40 years.

“Our findings reveal a previously unknown – and surprising – force behind climate change that is occurring deep in our southern hemisphere: the Atlantic Ocean,” says Li. “Moreover, the study offers further confirmation that warming in one region can have far-reaching effects in another.”

The Antarctic presents a paradox: the sea ice in the Arctic is declining rapidly; but conditions in the Antarctic don’t seem to have been changing at the same rate or in the same pattern. Concentrations of ice have changed but there seems to be as much sea ice or more, overall.

David Holland of New York University, a co-author, says: “From this study, we are learning just how Antarctic sea ice redistributes itself, and also finding that the underlying mechanisms controlling sea ice are completely distinct from those in the Arctic.”


http://www.climatenewsnetwork.net/2014/01/atlantic-changes-are-warming-antarctic/

Tuesday, May 7, 2013

Sea Surface Temperatures Reach Highest Level in 150 Years on Northeast Continental Shelf

shelf subregions
enlarge image The four subregions of the Northeast Shelf Large Marine Ecosystem, which extends from Cape Hatteras, N.C. to the Gulf of Maine. MAB is the Mid-Atlantic Bight, SNE is Southern New England, GB is Georges Bank, and GOM is the Gulf of Maine. Credit: NOAA

by Shelley Dawicki, Research Communications, Northeast Fisheries Science Center, NOAA, April 13, 2013

Sea surface temperatures in the Northeast Shelf Large Marine Ecosystem during 2012 were the highest recorded in 150 years, according to the latest Ecosystem Advisory issued by NOAA’s Northeast Fisheries Science Center (NEFSC). These high sea surface temperatures (SSTs) are the latest in a trend of above average temperature seen during the spring and summer seasons, and part of a pattern of elevated temperatures occurring in the Northwest Atlantic, but not seen elsewhere in the ocean basin over the past century.

The advisory reports on conditions in the second half of 2012.

Sea surface temperature for the Northeast Shelf Ecosystem reached a record high of 14 °C (57.2 °F) in 2012, exceeding the previous record high in 1951. Average SST has typically been lower than 12.4 °C (54.3 °F) over the past three decades.

Sea surface temperature in the region is based on both contemporary satellite remote-sensing data and long-term ship-board measurements, with historical SST conditions based on ship-board measurements dating back to 1854. The temperature increase in 2012 was the highest jump in temperature seen in the time series and one of only five times temperature has changed by more than 1 °C (1.8 °F).

The Northeast Shelf’s warm water thermal habitat was also at a record high level during 2012, while cold water habitat was at a record low level. Early winter mixing of the water column went to extreme depths, which will impact the spring 2013 plankton bloom. Mixing redistributes nutrients and affects stratification of the water column as the bloom develops.

Temperature is also affecting distributions of fish and shellfish on the Northeast Shelf. The advisory provides data on changes in distribution, or shifts in the center of the population, of seven key fishery species over time. The four southern species -- black sea bass, summer flounder, longfin squid and butterfish -- all showed a northeastward or upshelf shift. American lobster has shifted upshelf over time but at a slower rate than the southern species. Atlantic cod and haddock have shifted downshelf.”

“Many factors are involved in these shifts, including temperature, population size, and the distributions of both prey and predators,” said Jon Hare, a scientist in the NEFSC’s Oceanography Branch. A number of recent studies have documented changing distributions of fish and shellfish, further supporting NEFSC work reported in 2009 that found about half of the 36 fish stocks studied in the Northwest Atlantic Ocean, many of them commercially valuable species, have been shifting northward over the past four decades.

The Northeast U.S. Continental Shelf Large Marine Ecosystem (LME) extends from the Gulf of Maine to Cape Hatteras, North Carolina. The NEFSC has monitored this ecosystem with comprehensive sampling programs since 1977. Prior to 1977, this ecosystem was monitored by the NEFSC through a series of separate, coordinated programs dating back decades.

Warming conditions on the Northeast Shelf in the spring of 2012 continued into September, with the most consistent warming conditions seen in the Gulf of Maine and on Georges Bank. Temperatures cooled by October and were below average in the Middle Atlantic Bight in November, perhaps due to Superstorm Sandy, but had returned to above average conditions by December.

“Changes in ocean temperatures and the timing and strength of spring and fall plankton blooms could affect the biological clocks of many marine species, which spawn at specific times of the year based on environmental cues like water temperature,” Kevin Friedland, a scientist in the NEFSC Ecosystem Assessment Program, said. He noted that the contrast between years with, and without, a fall bloom is emerging as an important driver of the shelf’s ecology. “The size of the spring plankton bloom was so large that the annual chlorophyll concentration remained high in 2012 despite low fall activity. These changes will have a profound impact throughout the ecosystem.”

Michael Fogarty, who heads the Ecosystem Assessment Program, says the abundance of fish and shellfish is controlled by a complex set of factors, and that increasing temperatures in the ecosystem make it essential to monitor the distribution of many species, some of them migratory and others not.

"It isn’t always easy to understand the big picture when you are looking at one specific part of it at one specific point in time,“ Fogarty said, a comparison similar to not seeing the forest when looking at a single tree in it. “We now have information on the ecosystem from a variety of sources collected over a long period of time, and are adding more data to clarify specific details. The data clearly show a relationship between all of these factors.”

“What these latest findings mean for the Northeast Shelf ecosystem and its marine life is unknown,” Fogarty said. “What is known is that the ecosystem is changing, and we need to continue monitoring and adapting to these changes.”

Ecosystem advisories have been issued twice a year by the NEFSC’s Ecosystem Assessment Program since 2006 as a way to routinely summarize overall conditions in the region. The reports show the effects of changing coastal and ocean temperatures on fisheries from Cape Hatteras to the Canadian border. The advisories provide a snapshot of the ecosystem for the fishery management councils and also a broad range of stakeholders from fishermen to researchers.

The Spring 2013 Ecosystem Advisory, covering the fall of 2012 with supporting information, is available online at: 

http://www.nefsc.noaa.gov/ecosys/advisory/current/advisory.html.

http://www.nefsc.noaa.gov/press_release/2013/SciSpot/SS1304/

Thursday, September 6, 2012

NSIDC Report of September 5, 2012: Arctic sea ice extent falls below 4 million square kilometers

Arctic sea ice extent falls below 4 million square kilometers


Following the new record low recorded on August 26, Arctic sea ice extent continued to drop and is now below 4.00 million square kilometers (1.54 million square miles). Compared to September conditions in the 1980s and 1990s, this represents a 45% reduction in the area of the Arctic covered by sea ice. At least one more week likely remains in the melt season.

Overview of conditions

Figure 1. Arctic sea ice extent for August 2012 was 4.72 million square kilometers (1.82 million square miles). The magenta line shows the 1979 to 2000 median extent for that month. The black cross indicates the geographic North Pole. Sea Ice Indexdata. About the data. Credit: National Snow and Ice Data Center. High-resolution image
Throughout the month of August, Arctic sea ice extent tracked below levels observed in 2007, leading to a new record low for the month of 4.72 million square kilometers (1.82 million square miles), as assessed over the period of satellite observations, 1979 to present. Extent was unusually low for all sectors of the Arctic, except the East Greenland Sea where the ice edge remained near its normal position. On August 26, the 5-day running average for ice extent dropped below the previous record low daily extent, observed on September 18, 2007, of 4.17 million square kilometers (1.61 million square miles). By the end of the month, daily extent had dropped below 4.00 million square kilometers (1.54 million square miles). Typically, the melt season ends around the second week in September. 

Conditions in context

Figure 2. The graph above shows Arctic sea ice extent as of September 3, 2012, along with daily ice extent data for the previous five years. 2012 is shown in blue, 2011 in orange, 2010 in pink, 2009 in navy, 2008 in purple, and 2007 in green. The 1979-2000 average is in dark gray. The gray area around this average line shows the two standard deviation range of the data. Sea Ice Index data.
Credit: National Snow and Ice Data Center. High-resolution image
In 2012, the rate of ice loss for August was 91,700 square kilometers (35,400 square miles) per day, the fastest observed for the month of August over the period of satellite observations. In August 2007, ice was lost at a rate of 66,000 square kilometers (25,400 square miles) per day, and in 2008, the year with the previous highest August ice loss, the rate was 80,600 square kilometers (31,100 square miles) per day. The average ice loss for August is 55,100 square kilometers (21,300 square miles) per day. This rapid pace of ice loss in 2012 was dominated by large losses in the East Siberian and the Chukchi seas, likely caused in part by the strong cyclone that entered the region earlier in the month and helped to break up the ice. However, even after the cyclone had dissipated, ice loss continued at a rate of 77,800 square kilometers (30,000 square miles) per day.
August air temperatures at the 925 hPa level (approximately 3,000 feet above the surface) remained slightly above average (1-3 degrees Celsius, or 2-5 degrees Fahrenheit) over the much of the Pacific sector of the Arctic Ocean as well as at its central sector, with slightly higher temperatures in the Beaufort Sea (approximately 4 C, or 7 F above average). On the Atlantic side, the Kara and Barents seas continued to have air temperatures around 1-4 C (2-7 F) below average.
At the end of August, ice remained in the Western Parry Channel, and neither the northern or southern routes of the Northwest Passage were open. While much of the ice has cleared out, ice still remains, as confirmed by our colleague Steve Howell at the Canadian Ice Service. In the latter half of August, more ice actually moved into the passage routes when ice was pushed down into the channels from the north. Whether that ice will clear out remains to be seen.

August 2012 compared to previous years

Figure 3. Monthly August ice extent for 1979 to 2012 shows a decline of 10.2% per decade. Credit: National Snow and Ice Data Center. High-resolution image
The monthly averaged ice extent for August was 4.72 million square kilometers (1.82 square miles). This is 2.94 million square kilometers (1.14 million square miles) below the 1979 to 2000 average extent, and 640,000 square kilometers (247,000 square miles) below the previous record low for August set in 2007. Including 2012, the August trend is -78,100 square kilometers (-30,200 square miles) per year, or -10.2 % per decade relative to the 1979-2000 average.

Evolution of sea surface temperatures in August

sea surface temperature images
Figure 4. A buoy deployed on August 8, 2012, in open water during the storm initially shows a very warm 10-meter (33-foot)-thick surface mixed layer (upper left image). On August 12 (upper right image), the buoy enters a relatively cooler patch, gradually warms, enters another cool patch 12 days later (bottom left image), and then starts to warm again through August 26 (bottom right image). Red, orange, and yellow indicate higher temperatures, while blues and purples indicate lower temperatures. Credit: University of Washington Polar Science Center. High-resolution image
In recent summers, Arctic Ocean sea surface temperatures (SSTs) have been anomalously high (see our 2010 and 2011 end-of-summer posts), in part linked to loss of the reflective ice cover that allows darker open water areas to readily absorb solar radiation and warm the mixed layer of the ocean. According to Mike Steele, Wendy Ermold and Ignatius Rigor of the University of Washington, SSTs in the Beaufort, Chukchi, and Laptev seas were once again anomalously high before the strong cyclone (mentioned earlier and discussed in our previous post) entered the East Siberian and Chukchi seas on August 5, 2012. SSTs were as much as 5 C (9 F) above normal along the coastal areas in those seas. After the storm, the warm water that developed through summer was interspersed with large areas of cold water created by ice melt. By the third week of August, sea surface temperatures were mostly back to levels observed before the storm, but with a few more patches of colder water interspersed from additional ice melt.
A closer view of the variation in SSTs before and after the storm is recorded in the University of Washington Polar Science Center UpTempO buoy data. A buoy deployed on August 8, 2012, in open water during the storm initially shows a very warm 10-meter (33-foot)-thick surface mixed layer, likely the result of solar heating. On August 12, the buoy enters a relatively cooler patch, gradually warms, enters another cool patch 12 days later and then starts to warm again through August 26. These patches of cooler water may be a result of ice melt and/or the impact of advection from the storm.

Old ice continues to decline

Figure 5. These images from March 2012 (left) and August 2012 (right) show the age of the ice cover in spring and at the end of summer. Much of the Arctic ice cover now consists of first-year ice (shown in purple), which tends to melt rapidly in summer’s warmth. However, the oldest ice, that had survived five or more summers (shown in white), declined by 51%.
Credit: M. Tschudi and J. Maslanik, University of Colorado Boulder. High-resolution image
Ice age is an important indicator of the health of the ice cover. Old ice, also called multiyear ice, tends to be thicker ice and less prone to melting out in summer. The last few summers have seen increased losses of multiyear ice in the Pacific sector of the Arctic; multiyear ice that is transported into the Beaufort and Chukchi seas tends to melt out in summer before being transported back to the central Arctic Ocean through the clockwise Beaufort Gyre circulation. This summer, the tongue of multiyear ice along the Alaska coast mostly melted out by the end of August, with a small remnant left in the Chukchi Sea. The ice on the Pacific side of the Arctic has melted back to the edge of the multiyear ice cover, which should help to slow further ice loss in the region. In the Laptev Sea, by contrast, a large amount of first-year ice remains. In the last two weeks, open water areas have developed within the first-year ice in the Laptev Sea, helping to further foster melt in that region.
Between mid-March and the third week of August, the total amount of multiyear ice within the Arctic Ocean declined by 33%, and the oldest ice, ice older than five years, declined by 51%.