Following the new record low recorded on August 26, Arctic sea ice extent continued to drop and is now below 4.00 million square kilometers (1.54 million square miles). Compared to September conditions in the 1980s and 1990s, this represents a 45% reduction in the area of the Arctic covered by sea ice. At least one more week likely remains in the melt season.
Overview of conditions

Figure 1. Arctic sea ice extent for August 2012 was 4.72 million square kilometers (1.82 million square miles). The magenta line shows the 1979 to 2000 median extent for that month. The black cross indicates the geographic North Pole. Sea Ice Indexdata. About the data. Credit: National Snow and Ice Data Center. High-resolution image
Throughout the month of August, Arctic sea ice extent tracked below levels observed in 2007, leading to a new record low for the month of 4.72 million square kilometers (1.82 million square miles), as assessed over the period of satellite observations, 1979 to present. Extent was unusually low for all sectors of the Arctic, except the East Greenland Sea where the ice edge remained near its normal position. On August 26, the 5-day running average for ice extent dropped below the previous record low daily extent, observed on September 18, 2007, of 4.17 million square kilometers (1.61 million square miles). By the end of the month, daily extent had dropped below 4.00 million square kilometers (1.54 million square miles). Typically, the melt season ends around the second week in September.
Conditions in context
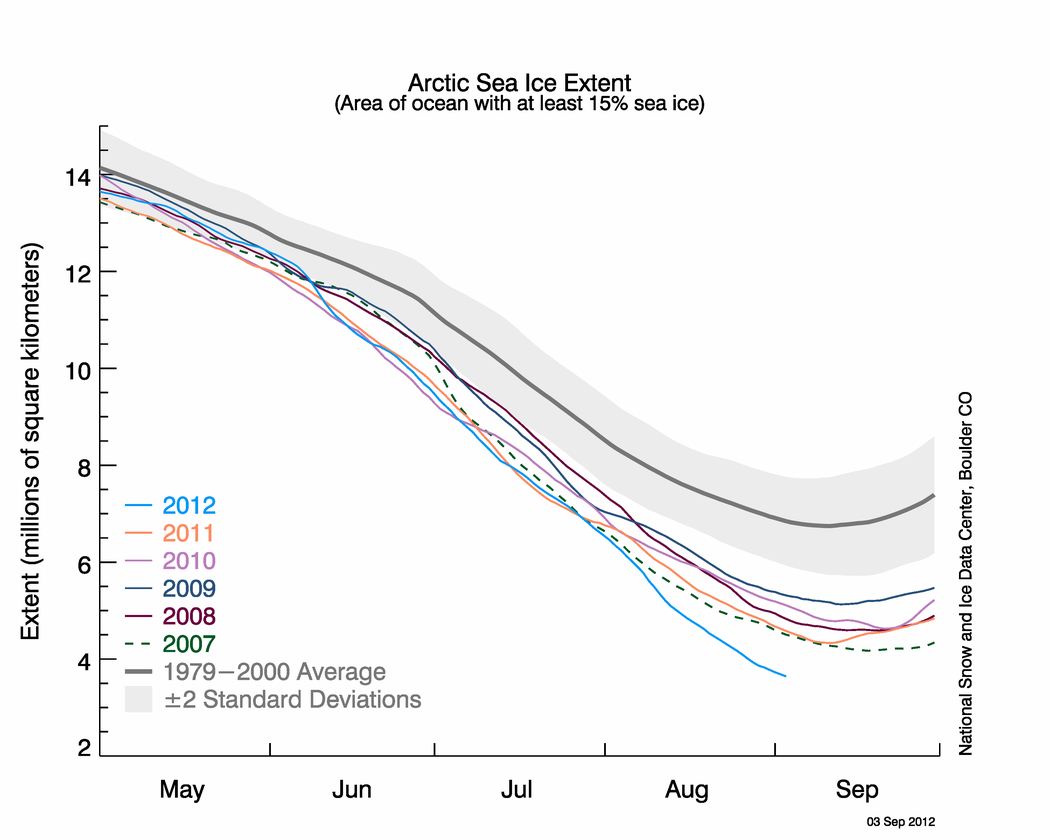
Figure 2. The graph above shows Arctic sea ice extent as of September 3, 2012, along with daily ice extent data for the previous five years. 2012 is shown in blue, 2011 in orange, 2010 in pink, 2009 in navy, 2008 in purple, and 2007 in green. The 1979-2000 average is in dark gray. The gray area around this average line shows the two standard deviation range of the data. Sea Ice Index data.
Credit: National Snow and Ice Data Center. High-resolution image
Credit: National Snow and Ice Data Center. High-resolution image
In 2012, the rate of ice loss for August was 91,700 square kilometers (35,400 square miles) per day, the fastest observed for the month of August over the period of satellite observations. In August 2007, ice was lost at a rate of 66,000 square kilometers (25,400 square miles) per day, and in 2008, the year with the previous highest August ice loss, the rate was 80,600 square kilometers (31,100 square miles) per day. The average ice loss for August is 55,100 square kilometers (21,300 square miles) per day. This rapid pace of ice loss in 2012 was dominated by large losses in the East Siberian and the Chukchi seas, likely caused in part by the strong cyclone that entered the region earlier in the month and helped to break up the ice. However, even after the cyclone had dissipated, ice loss continued at a rate of 77,800 square kilometers (30,000 square miles) per day.
August air temperatures at the 925 hPa level (approximately 3,000 feet above the surface) remained slightly above average (1-3 degrees Celsius, or 2-5 degrees Fahrenheit) over the much of the Pacific sector of the Arctic Ocean as well as at its central sector, with slightly higher temperatures in the Beaufort Sea (approximately 4 C, or 7 F above average). On the Atlantic side, the Kara and Barents seas continued to have air temperatures around 1-4 C (2-7 F) below average.
At the end of August, ice remained in the Western Parry Channel, and neither the northern or southern routes of the Northwest Passage were open. While much of the ice has cleared out, ice still remains, as confirmed by our colleague Steve Howell at the Canadian Ice Service. In the latter half of August, more ice actually moved into the passage routes when ice was pushed down into the channels from the north. Whether that ice will clear out remains to be seen.
August 2012 compared to previous years
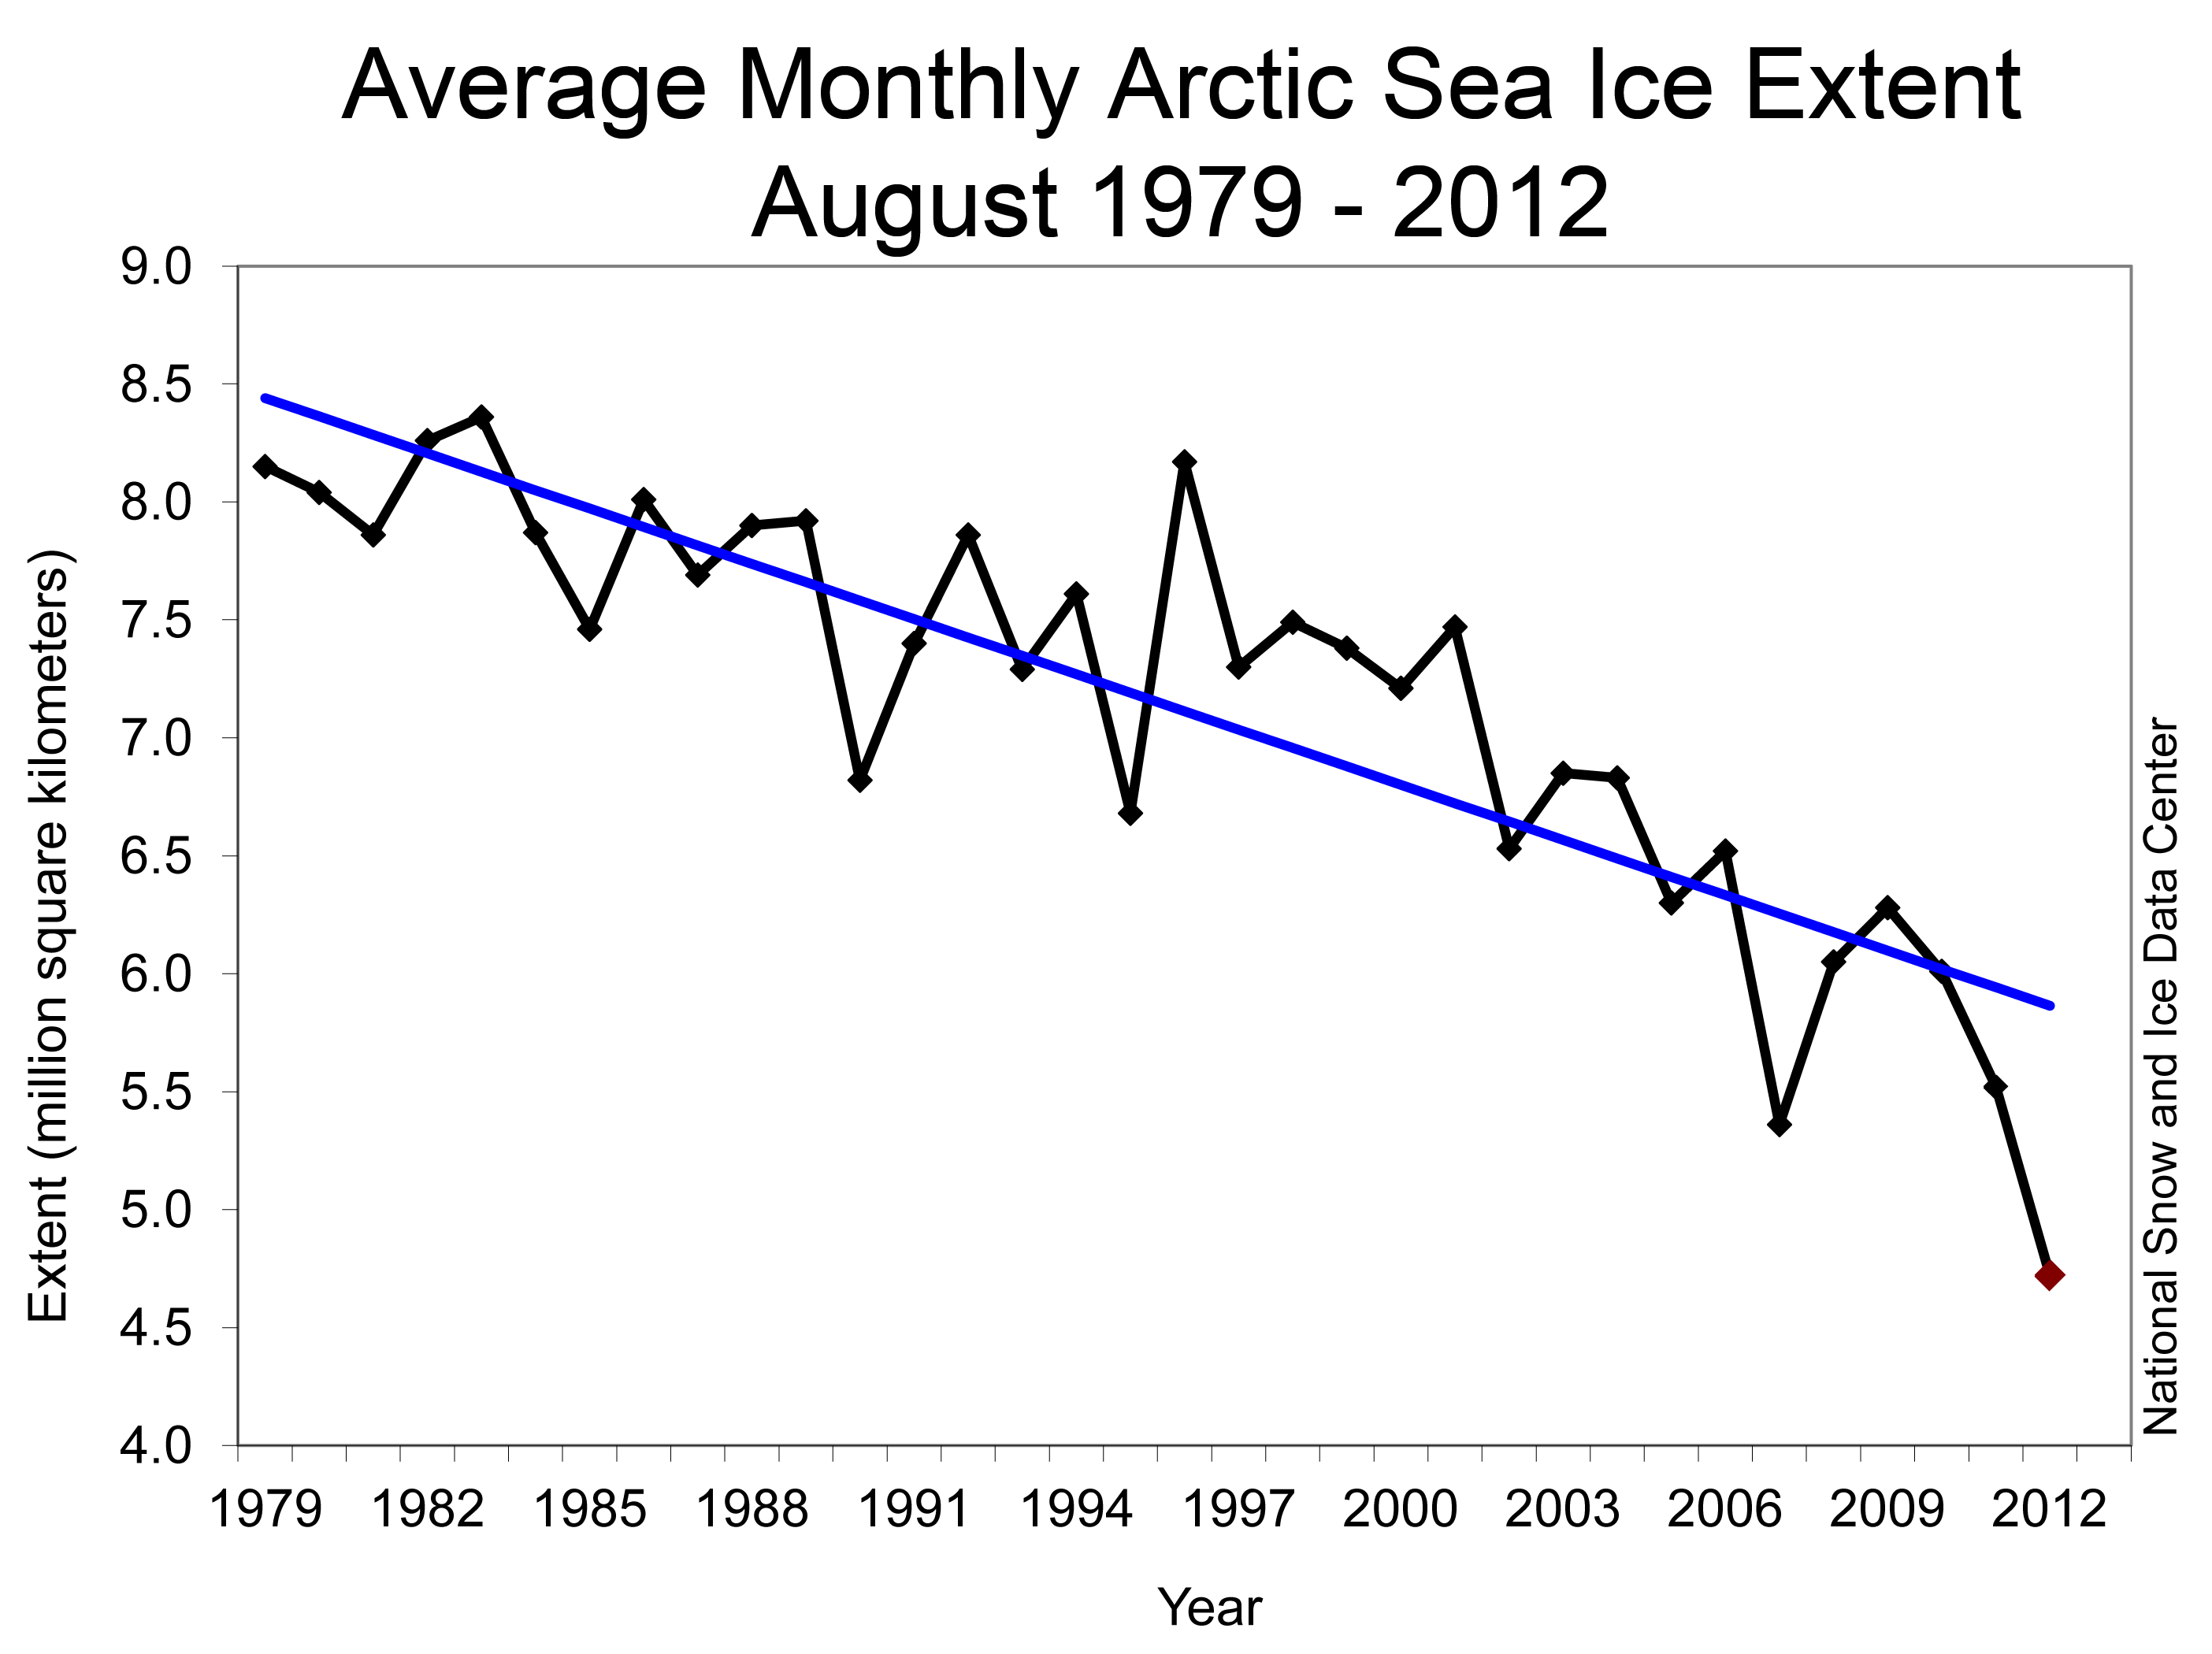
Figure 3. Monthly August ice extent for 1979 to 2012 shows a decline of 10.2% per decade. Credit: National Snow and Ice Data Center. High-resolution image
The monthly averaged ice extent for August was 4.72 million square kilometers (1.82 square miles). This is 2.94 million square kilometers (1.14 million square miles) below the 1979 to 2000 average extent, and 640,000 square kilometers (247,000 square miles) below the previous record low for August set in 2007. Including 2012, the August trend is -78,100 square kilometers (-30,200 square miles) per year, or -10.2 % per decade relative to the 1979-2000 average.
Evolution of sea surface temperatures in August
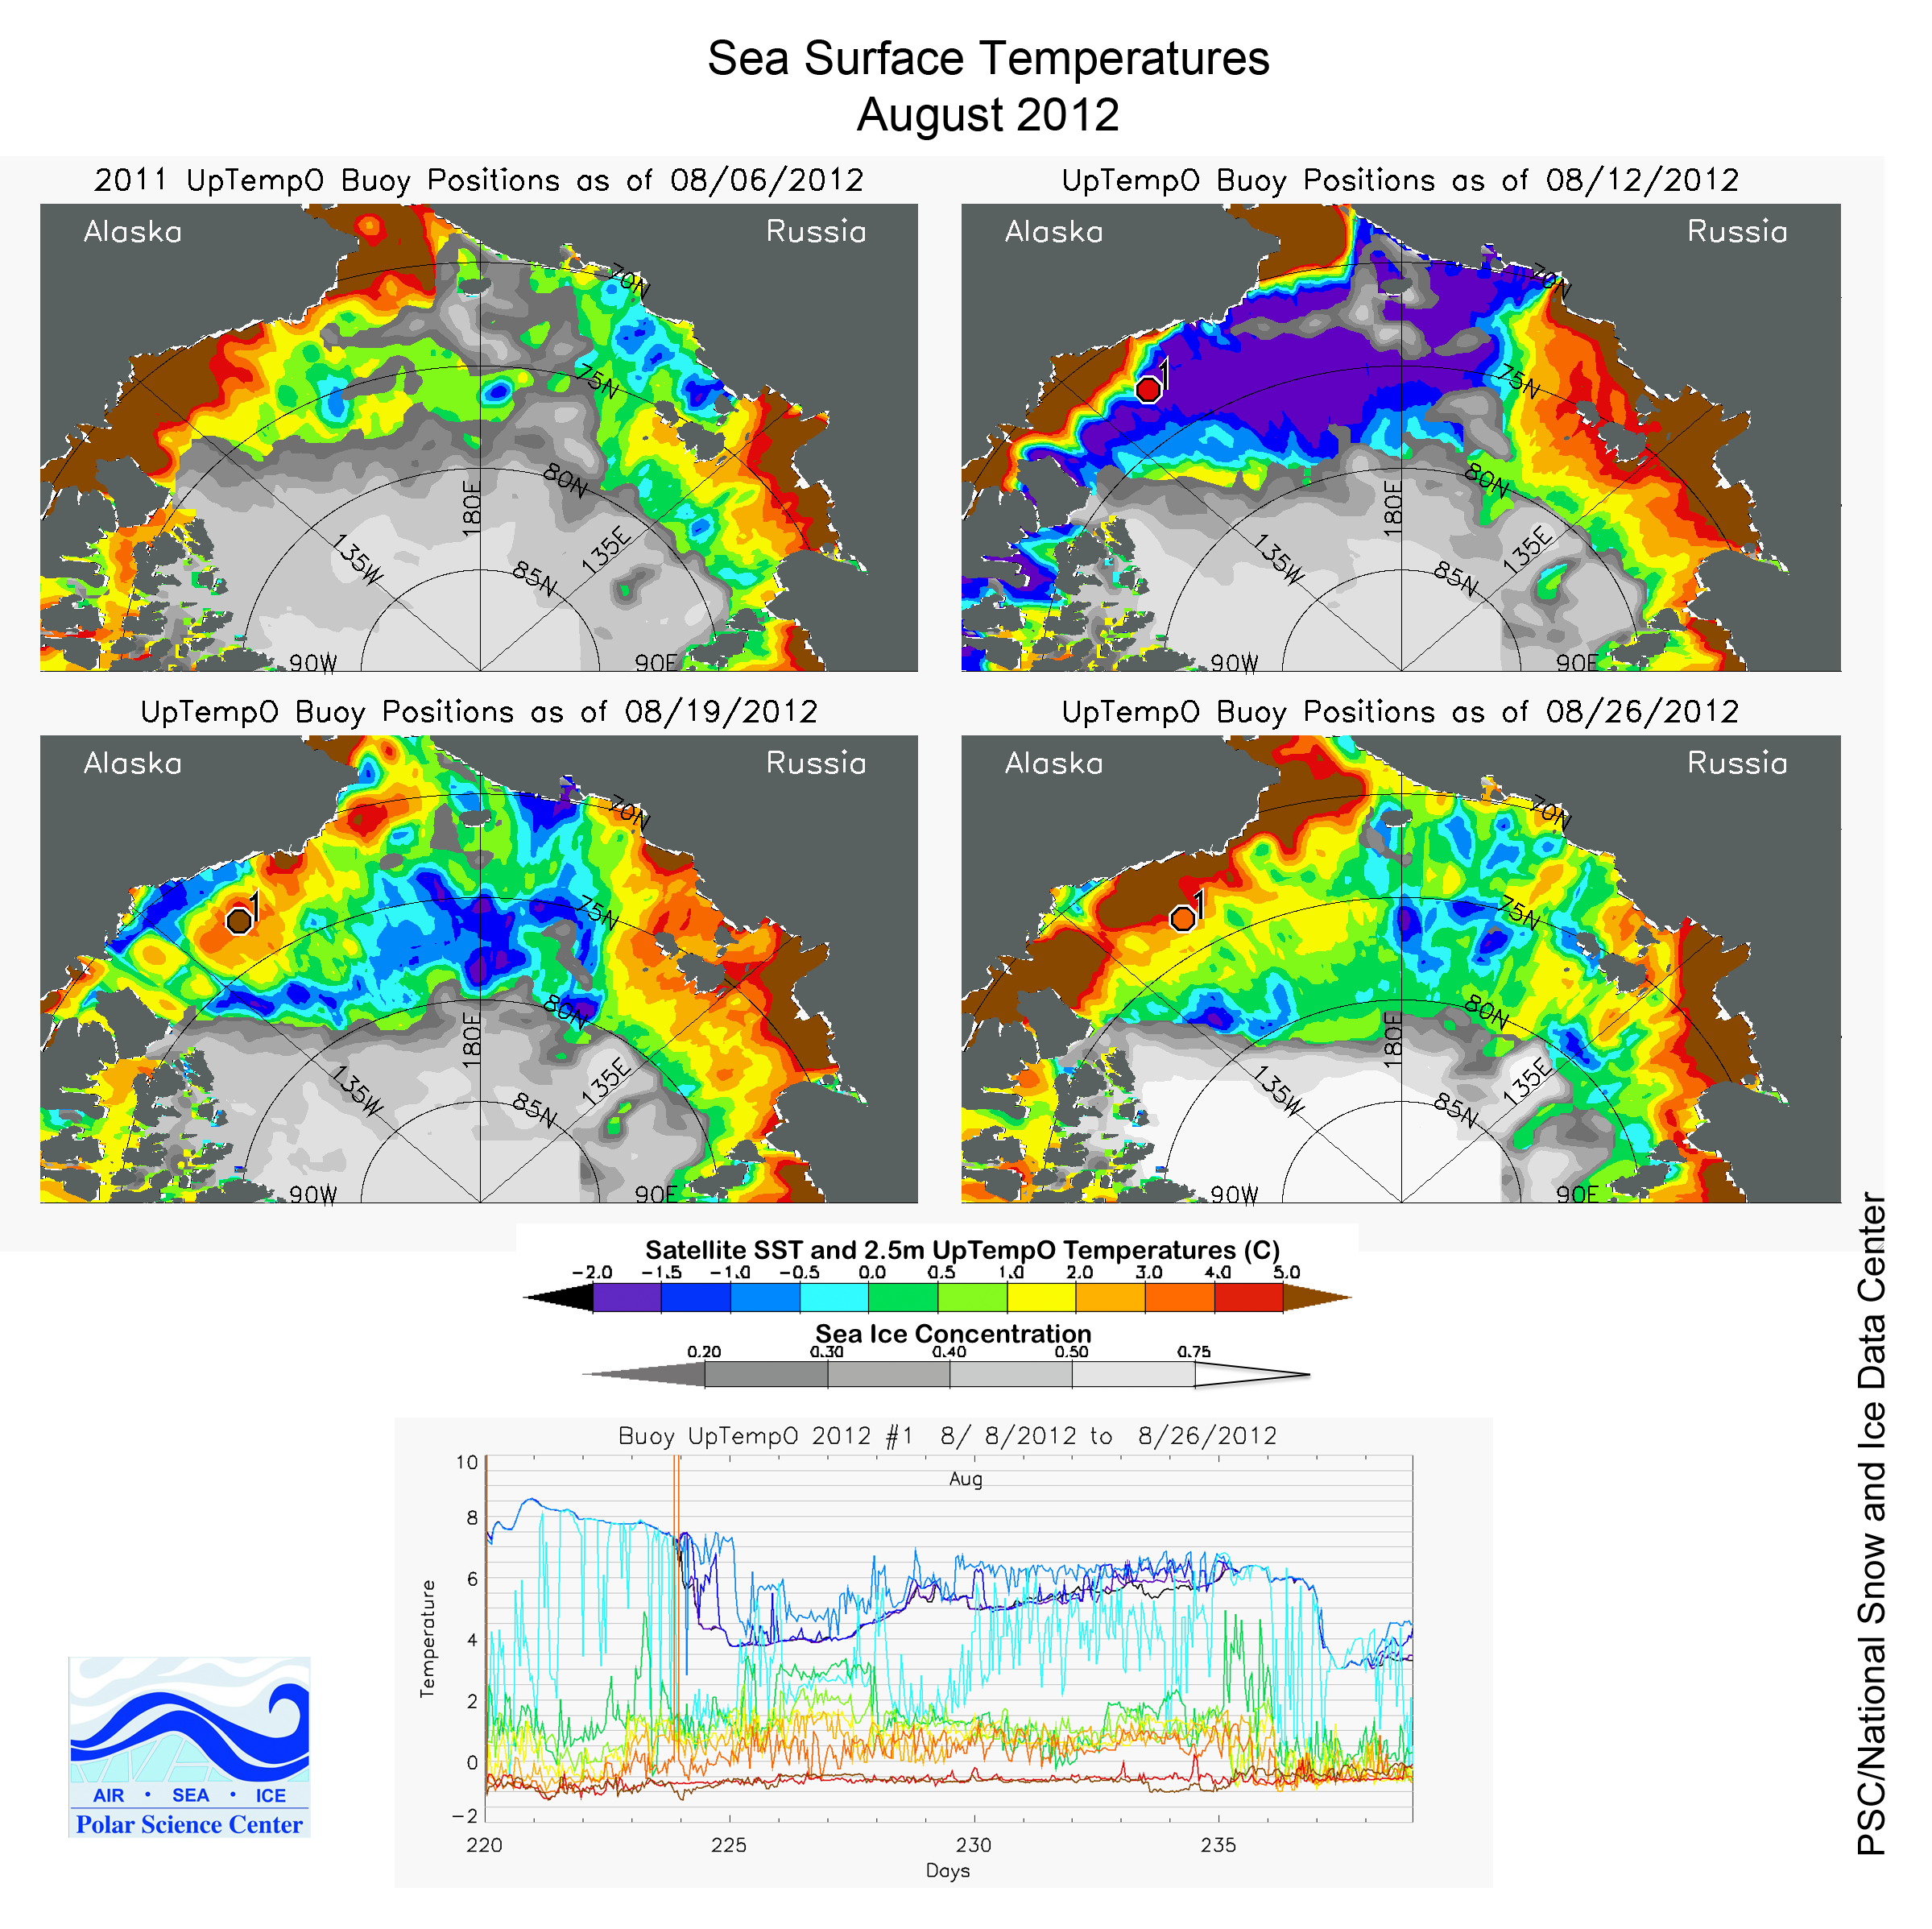
Figure 4. A buoy deployed on August 8, 2012, in open water during the storm initially shows a very warm 10-meter (33-foot)-thick surface mixed layer (upper left image). On August 12 (upper right image), the buoy enters a relatively cooler patch, gradually warms, enters another cool patch 12 days later (bottom left image), and then starts to warm again through August 26 (bottom right image). Red, orange, and yellow indicate higher temperatures, while blues and purples indicate lower temperatures. Credit: University of Washington Polar Science Center. High-resolution image
In recent summers, Arctic Ocean sea surface temperatures (SSTs) have been anomalously high (see our 2010 and 2011 end-of-summer posts), in part linked to loss of the reflective ice cover that allows darker open water areas to readily absorb solar radiation and warm the mixed layer of the ocean. According to Mike Steele, Wendy Ermold and Ignatius Rigor of the University of Washington, SSTs in the Beaufort, Chukchi, and Laptev seas were once again anomalously high before the strong cyclone (mentioned earlier and discussed in our previous post) entered the East Siberian and Chukchi seas on August 5, 2012. SSTs were as much as 5 C (9 F) above normal along the coastal areas in those seas. After the storm, the warm water that developed through summer was interspersed with large areas of cold water created by ice melt. By the third week of August, sea surface temperatures were mostly back to levels observed before the storm, but with a few more patches of colder water interspersed from additional ice melt.
A closer view of the variation in SSTs before and after the storm is recorded in the University of Washington Polar Science Center UpTempO buoy data. A buoy deployed on August 8, 2012, in open water during the storm initially shows a very warm 10-meter (33-foot)-thick surface mixed layer, likely the result of solar heating. On August 12, the buoy enters a relatively cooler patch, gradually warms, enters another cool patch 12 days later and then starts to warm again through August 26. These patches of cooler water may be a result of ice melt and/or the impact of advection from the storm.
Old ice continues to decline
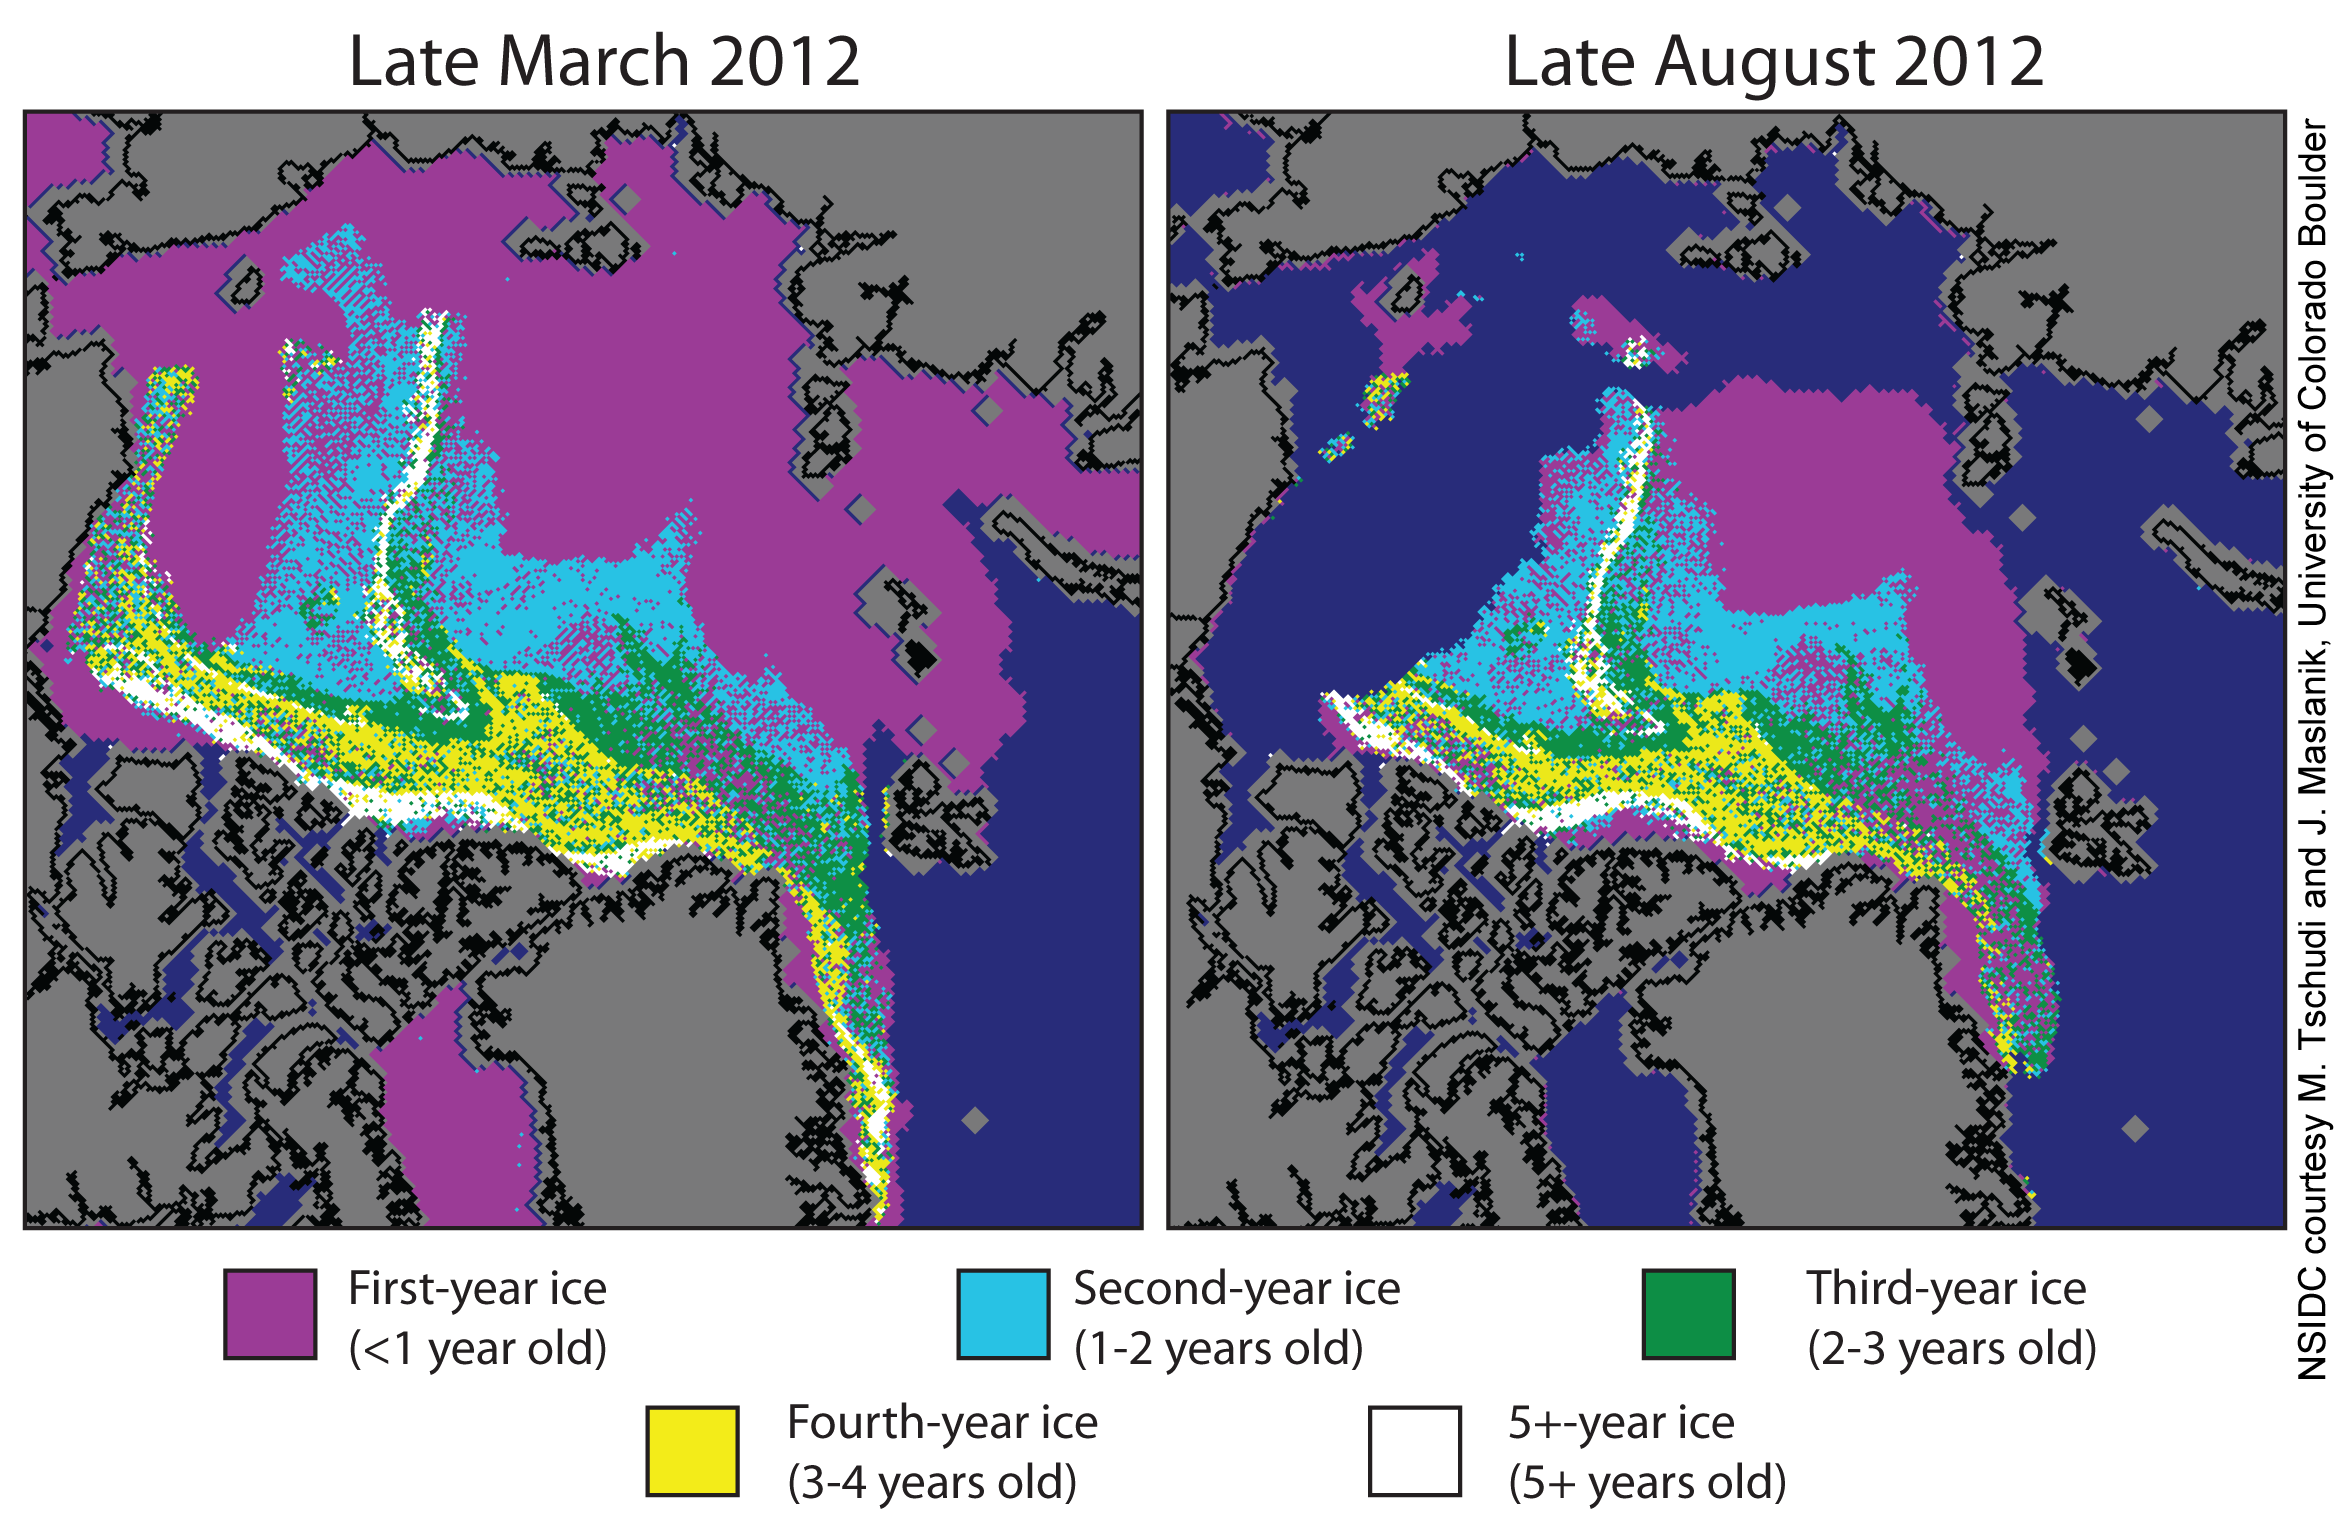
Figure 5. These images from March 2012 (left) and August 2012 (right) show the age of the ice cover in spring and at the end of summer. Much of the Arctic ice cover now consists of first-year ice (shown in purple), which tends to melt rapidly in summer’s warmth. However, the oldest ice, that had survived five or more summers (shown in white), declined by 51%.
Credit: M. Tschudi and J. Maslanik, University of Colorado Boulder. High-resolution image
Credit: M. Tschudi and J. Maslanik, University of Colorado Boulder. High-resolution image
Ice age is an important indicator of the health of the ice cover. Old ice, also called multiyear ice, tends to be thicker ice and less prone to melting out in summer. The last few summers have seen increased losses of multiyear ice in the Pacific sector of the Arctic; multiyear ice that is transported into the Beaufort and Chukchi seas tends to melt out in summer before being transported back to the central Arctic Ocean through the clockwise Beaufort Gyre circulation. This summer, the tongue of multiyear ice along the Alaska coast mostly melted out by the end of August, with a small remnant left in the Chukchi Sea. The ice on the Pacific side of the Arctic has melted back to the edge of the multiyear ice cover, which should help to slow further ice loss in the region. In the Laptev Sea, by contrast, a large amount of first-year ice remains. In the last two weeks, open water areas have developed within the first-year ice in the Laptev Sea, helping to further foster melt in that region.
Between mid-March and the third week of August, the total amount of multiyear ice within the Arctic Ocean declined by 33%, and the oldest ice, ice older than five years, declined by 51%.


No comments:
Post a Comment