Blog Archive

Showing posts with label AMO - Atlantic Multidecadal Oscillation. Show all posts

Wednesday, July 22, 2015

"Linking interannual variability in extreme Greenland blocking episodes to the recent increase in summer melting across the Greenland ice sheet," by J. T. McLeod & T. L. Mote, International Journal of Climatology, 19 July 2015: doi: 10.1002/joc.4440

International Journal of Climatology, 19 July 2015; doi: 10.1002/joc.4440

Linking interannual variability in extreme Greenland blocking episodes to the recent increase in summer melting across the Greenland ice sheet

Jordan T. McLeod and Thomas L. Mote

Abstract


Atmospheric blocking commonly occurs over the high latitudes of the Northern Hemisphere, resulting from the development of persistent areas of high pressure that lead to warmer-than-average surface temperatures west of the high centre. While the variability and trends in anticyclonic circulation patterns (including blocking) over Greenland have been previously documented, an analysis of the most extreme blocking events within the observational record is lacking. In this study, a historical climatology of extreme Greenland blocking episodes (GBEs) from 1958 to 2013 is examined within the context of anomalous anticyclonic circulation patterns over the North Atlantic region during recent years. Based on a combination of the ERA-40 (1958–1978) and ERA-Interim (1979–2013) reanalysis data sets, the Greenland Blocking Index (GBI) is used to quantify 500-hPa geopotential-height anomalies for the identification of extreme GBEs. The annual rate of extreme blocking days has doubled since 1958, reaching an average of approximately 20 days per year by 2013. The frequency and, to some extent, duration of extreme GBEs were unprecedentedly high from 2007 to 2013 compared to the 56-year period of record, with a majority of the increase occurring during the spring (MAM) and summer (JJA). A multiple linear regression analysis reveals that interannual variability in extreme blocking and the Atlantic Multidecadal Oscillation (AMO) are the two predominant drivers of surface meltwater production across the entire Greenland ice sheet (GrIS), but Arctic sea ice extent and North Atlantic cyclone activity can also influence the extent of summer melting over portions of the GrIS. Thus, in addition to the larger-scale atmospheric and oceanic variability, smaller-scale features such as extratropical cyclones can play a significant role in modulating GrIS surface melting each summer.

Key words: atmospheric blocking, Greenland ice sheet, extratropical cyclones, North Atlantic, Arctic amplification, cryosphere, Arctic sea ice, climate change

http://onlinelibrary.wiley.com/doi/10.1002/joc.4440/abstract

Thursday, April 24, 2014

Wave goodbye to Judith Curry's stadium wave - global warming still caused by humans

A new study refutes the hypothesis of a pattern in climate changes much like a stadium wave

A Bundesliga match between Alemannia Aachen and FSV Frankfurt at Tivoli Stadium, Aachen
Global warming can't be explained by teleconnections behaving like a stadium wave. Photograph: Christof Koepsel/Bongarts/Getty Images
by John Abraham, "Climate Consensus - The 97%," The Guardian, April 24, 2014
Many people have spent a lot of time trying to show that much of our recentclimate change is just natural. So far, these studies have died as fast as they've been born.
A recent attempt was made to liken our climate to fans in a stadium, you know those annoying "waves" that fans make? Could our climate just be like that? Not likely; let me explain.
The so-called "stadium wave", as described by the scientists who coined the phrase, is "a hypothesized multi-decadally varying climate signal that propagates across the Northern Hemisphere." It is basically a signal that travels throughout the Earth's climate, in the ocean and atmosphere, and can be sensed by measurements. From author Dr. Marcia Wyatt's own website, you can find a more detailed description.
So, could our recent changes in climate be somehow associated with these "waves"? The great thing about science is these hypotheses can be checked. In fact, a very recent study did just that and found the stadium wave hypothesis lacking.
In the study, authors Michael Mann, Byron Steinman, and Sonya Miller estimate the low-frequency internal variability of the Northern Hemisphere (the stadium waves) by evaluating observed signals. These observations include the impacts of both forced (mainly human-caused) variations and natural variability (energy naturally "sloshing around" the Earth). They generated a set of alternative histories based on the statistics of past observations to show that the recent Northern Hemisphere variations are within the range of expected uncertainty.
The authors then show that past analyses which have been used to estimate internal variability have failed to find appropriate variability when it was known ahead of time. These methods errantly show natural variability which is too high and which has a biased phase. As a result, the claims of stadium waves are made based on an incorrect methodology; they are likely an "artifact of this flawed procedure."
To get into the weeds a bit, the primary natural fluctuation that was focused on is called the Atlantic Multi-decadal Oscillation (AMO for short). The recent studies promoting large natural climate variability deduced the AMO by detrending the time series of North Atlantic sea surface temperatures, and then interpreting the left-over low-frequency variation as the AMO. This means they removed a linear variation. Prior works (here and here for instance) have shown that this method causes artifacts to appear. For instance, if you aren't careful, you might conclude that atmospheric aerosol cooling was actually a natural climate fluctuation. That is, you might confuse human-caused cooling effects with natural fluctuations.
Northern Hemisphere variability comparing differenced, detrended, and forced temperature anomaliesNorthern Hemisphere variability comparing differenced, detrended, and forced temperature anomalies.
The researchers Mann, Steinman and Miller, further showed that the detrended AMO method yields a climatic variability that is approximately twice as large as prior estimates and outside the 95% error range. They also found that the detrending method got the timing wrong (biasing error in the phase). They compared the true AMO signal and the detrended AMO signal. The detrended signals have amplitudes which are too large by a factor of 2 and they are all in phase. As the authors write, this suggests, "an artifact of the common forced signal masquerading as coherent low-frequency noise."
As I've written about before, studies which purport to show that significant recent climate variability is just natural are taken seriously by the scientific community. In fact, I think we would all like to conclude that the current climate change is just natural. During the course of scientific investigation, these claims are given their fair hearing. Unfortunately, they have not borne scientific scrutiny well. Distinguished Professor of Meteorology Michael E. Mann told me,
"Some researchers have in the past attributed a portion of Northern Hemispheric warming to a warm phase of the AMO. The true AMO signal, instead, appears likely to have been in a cooling phase in recent decades, offsetting some of the anthropogenic warming temporarily.
We conclude that the AMO played at least a modest role in the apparent slowing of warming during the past decade. As the AMO is an oscillation, this cooling effect is likely fleeting, and when it reverses, the rate of warming will increase.
Initial investigations into the multidecadal climate oscillation in the North Atlantic were hampered by the short length of the instrumental climate record which was only about a century long. And some of the calculations were contaminated by long-term climate trends driven or "forced" by human factors such as greenhouse gasses as well as pollutants known as 'sulphate aerosols.' These trends masqueraded as an apparent oscillation."
My own view is that a bit too much is made of these "waves." Humans like to find patterns and give names to patterns that are either real or imaginary. Certainly there are teleconnections between various parts of the climate and certainly those connections might manifest in slow (low frequency) climate variations. But we have a very short history of measurement. In order to be certain, we need measurements of multiple recurrences of the oscillations. We just don't have a long enough period of data.
We also need a clear articulation of the physical processes which cause fluctuations. We do not have that either. Until then, we are just whistling in the breeze (or "yodeling in the broccoli," as we say in Minnesota).
With that said, this doesn't mean we shouldn't continue our search for such important fluctuations. When scientists propose natural variability as a climate-change mechanism, it makes the science better. Either they are right (and we are all better off) or they are wrong (as happened here). Regardless, at the end of the day, our understanding is deeper than before.

Wednesday, April 9, 2014

Waving goodbye to Judith Curry's Stadium Wave Model: About that global warming hiatus

by Greg Laden, ScienceBlogs, April 8, 2014

[This post was quite long, so I excerpted it; if you want all the details, please go to the link at the bottom of the post.]

Some of the variation in surface warming has been attributed by some researchers to a phenomenon known as the Atlantic Multidecadal Oscillation (AMO). “Oscillations” are a common phenomenon in climatology. Generally speaking, this is where a major variable (temperature or air pressure) in a given area or between two areas shifts back and forth around a mean. The AMO in particular has been a bit difficult to figure out, or for that matter, to prove that it really even exists. Part of the problem is that a single oscillation, which involves seas surface temperatures over the Atlantic Ocean, may have a period of 40 or even 80 years. For this reason, the high quality record of surface temperature change allows us to only see a couple of full oscillations, and this makes it hard to characterize and even harder to explain causally.
According to Michael Mann, lead author of a paper just out addressing the pause and its relationship to the AMO, “Some researchers have in the past attributed a portion of Northern Hemispheric warming to a warm phase of the AMO. The true AMO signal, instead, appears likely to have been in a cooling phase in recent decades, offsetting some of the anthropogenic warming temporarily.”
One application to understanding recent changes in the rate of warming in the context of the AMO is the so-called “Stadium Wave.” This is an actual Stadium Wave, a phenomenon seen at sporting events: (see video)
...
The climate Stadium Wave idea as proposed by Judith Curry suggests that certain changes in surface conditions related to the AMO result in swings in surface temperature that actually explain the long term “global warming curve” enough to discount or reduce the presumed effects of global warming. Curry’s Stadium Wave is a kind of emergent property of climate, where this and that thing happens and results in a large effect because of compounding variables.
It’s complicated. Here is an abstract from a paper by M. G. Wyatt and J. A. Curry explaining it:
A hypothesized low-frequency climate signal propagating across the Northern Hemisphere through a network of synchronized climate indices was identified in previous analyses of instrumental and proxy data. The tempo of signal propagation is rationalized in terms of the … Atlantic Multidecadal Oscillation. Through multivariate statistical analysis of an expanded database, we further investigate this hypothesized signal to elucidate propagation dynamics. The Eurasian Arctic Shelf-Sea Region, where sea ice is uniquely exposed to open ocean in the Northern Hemisphere, emerges as a strong contender for generating and sustaining propagation of the hemispheric signal. Ocean-ice-atmosphere coupling spawns a sequence of positive and negative feedbacks that convey persistence and quasi-oscillatory features to the signal. Further stabilizing the system are anomalies of co-varying Pacific-centered atmospheric circulations. Indirectly related to dynamics in the Eurasian Arctic, these anomalies appear to negatively feed back onto the Atlantic‘s freshwater balance. Earth’s rotational rate and other proxies encode traces of this signal as it makes its way across the Northern Hemisphere.
This led to a number of statements and predictions by Curry, which have been parsed out here.
For the past 15+ years, there has been no increase in global average surface temperature…
The stadium wave hypothesis provides a plausible explanation for the hiatus in warming and helps explain why climate models did not predict this hiatus. Further, the new hypothesis suggests how long the hiatus might last.
The ‘hiatus’ will continue at least another decade
Climate models are too sensitive to external forcing
Hiatus persistence beyond 20 years would support a firm declaration of problems with the climate models
Incorrect accounting for natural internal variability implies: Biased attribution of 20th century warming [and] Climate models are not useful on decadal time scales
...

Mann, Steinman and Miller, in their new paper, tried something interesting. They recreated a set of scenarios in which they could observe the AMO and other climate variables over time, but rather than having the AMO be a variable subject to emergence after other factors are accounted for, they introduced a known AMO. This way they could see the exact effects of the AMO on surface temperatures and other variables and explore the relationship between the variables. They call this the “differenced-AMO approach.” Knowing the true AMO signal, they were able to produce a correct climate signal, and when the AMO signal was detrended in this scenario, the final result failed to match known internal variability. In other words, using the previously applied techniques, such as used by Curry, the modeling did not work. More importantly, the detrended AMO signal had an artificially increased amplitude, with lower lows and higher highs, and these peaks occurred at the wrong times.

...

 The previously used detrending also missed the contribution of other factors that probably make the AMO look like something it isn’t. There have been a number of other effects on surface temperatures that are left behind after anthropogenic warming is detrended out of the data, especially the effects of sulfate aerosols, which come from power plants and such. “These aerosols have cooled substantial regions of the Northern Hemisphere continents in recent decades, thus masking some of the warming we otherwise would have seen,” Mann told me. “But aerosols have tailed off in recent decades thanks to the Clean Air Acts, etc. That has allowed the hidden warming to emerge in recent decades. If you subtract off a straight line from the temperature trend, you will appear to have an 'oscillation,' but that oscillation is just mostly due to the non-linear nature of the long-term forcing, with a substantial positive forcing (warming through 1950s, then slight warming or even cooling from the 1950s–1970s due to a large sulphate aerosol cooling contribution), followed by the accelerated warming in recent decades as aerosols have tailed off. We show in the paper that subtracting off a simple linear trend when you have this more complicated time history of human forcing of climate, gives rise to a spurious apparent 'oscillation.' ”

Go back, if you dare, to the abstract from Curry’s paper. Back when I used to teach multi-variate statistics for grad students (co-taught with a brilliant statistician, I quickly add) this is the kind of abstract we would look for to use in class. It demonstrates an all too common error, or at least potentially demonstrates it well enough to examine as an exemplar of what not to do. Climate systems are complex. There are a lot of known variables and accessible data sets, but those variables and data sets have often hidden relationships, or important factors are unknown, either entire variables or relationships between variables. If you take a set of possible causal variables and one or two ideal outcome variables, it is possible to mix and match among the candidate causal variables until you get a model that matches the outcome. Perhaps, in doing so, you’ve figured something out. Or, perhaps you just made up some stuff. One way to know if you’ve really explained a phenomenon is to have a sensible, even expected, physical process that links things together. In other words, you have a logical cause as well as a statistical link. The latter without the former is potentially wrong. A second way to evaluate your finding is to seek internal statistical or numerical relationships that result in apparent meaning but that are actually artifacts of your methods. In this case, Mann et al have done this; as demonstrated in this new paper, Curry’s stadium wave is one possible, but meaningless, outcome from the process of making statistical stone soup. Such is the way many theories of everything, large or small, seem to go.
Mann also told me that some of the other large scale oscillations that make up part of the standard descriptions of Earth climate systems could be subject to similar artifactual effects. It will be interesting to see if further work allows further refinement of our understanding of these systems over coming months or years. The models climate scientists use are pretty good, but this would make them more useful and accurate.

Mann, Michael, Byron Steinmann, and Sonya Miller. 2014. On Forced Temperature Changes, Internal Variability and the AMO. Geophysical Research Letters. DOI: 10.1002/2014GL05923

Thursday, March 27, 2014

"On Forced Temperature Changes, Internal Variability and the AMO," by Michael E. Mann, Byron A. Steinman & Sonya K. Miller, GRL (2014); doi: 10.1002/2014GL059233

Geophysical Research Letters, (2014); doi: 10.1002/2014GL059233

On Forced Temperature Changes, Internal Variability and the AMO


  1. Michael E. Mann
  2. Byron A. Steinman and
  3. Sonya K. Miller*
Abstract


We estimate the low-frequency internal variability of Northern Hemisphere (NH) mean temperature using observed temperature variations, which include both forced and internal variability components, and several alternative model simulations of the (natural + anthropogenic) forced component alone. We then generate an ensemble of alternative historical temperature histories based on the statistics of the estimated internal variability. Using this ensemble, we show, firstly, that recent NH mean temperatures fall within the range of expected multidecadal variability. Using the synthetic temperature histories, we also show that certain procedures used in past studies to estimate internal variability, and in particular, an internal multidecadal oscillation termed the “Atlantic Multidecadal Oscillation” or “AMO,” fail to isolate the true internal variability when it is a priori known. Such procedures yield an AMO signal with an inflated amplitude and biased phase, attributing some of the recent NH mean temperature rise to the AMO. The true AMO signal, instead, appears likely to have been in a cooling phase in recent decades, offsetting some of the anthropogenic warming. Claims of multidecadal “stadium wave” patterns of variation across multiple climate indices are also shown to likely be an artifact of this flawed procedure for isolating putative climate oscillations.

http://onlinelibrary.wiley.com/doi/10.1002/2014GL059233/abstract

Saturday, July 28, 2012

"Sources of multi-decadal variability in Arctic sea ice extent," by J. J. Day et al., ERL 7(3) (2012); doi: 10.1088/1748-9326/7/3/034011

Environmental Research Letters, 7(3) (2012); doi:  10.1088/1748-9326/7/3/034011

Sources of multi-decadal variability in Arctic sea ice extent

J. J. Day, J. C. Hargreaves, J. D. Annan and A. Abe-Ouchi


Abstract

The observed dramatic decrease in September sea ice extent (SIE) has been widely discussed in the scientific literature. Though there is qualitative agreement between observations and ensemble members of the Third Coupled Model Intercomparison Project (CMIP3), it is concerning that the observed trend (1979–2010) is not captured by any ensemble member. The potential sources of this discrepancy include: observational uncertainty, physical model limitations and vigorous natural climate variability. The latter has received less attention and is difficult to assess using the relatively short observational sea ice records. In this study multi-centennial pre-industrial control simulations with five CMIP3 climate models are used to investigate the role that the Arctic oscillation (AO), the Atlantic multi-decadal oscillation (AMO) and the Atlantic meridional overturning circulation (AMOC) play in decadal sea ice variability. Further, we use the models to determine the impact that these sources of variability have had on SIE over both the era of satellite observation (1979–2010) and an extended observational record (1953–2010). There is little evidence of a relationship between the AO and SIE in the models. However, we find that both the AMO and AMOC indices are significantly correlated with SIE in all the models considered. Using sensitivity statistics derived from the models, assuming a linear relationship, we attribute 0.5–3.1%/decade of the 10.1%/decade decline in September SIE (1979–2010) to AMO driven variability.
Received 8 May 2012, accepted for publication 9 July 2012, published 26 July 2012.

Loss of Arctic sea ice '70-95% man-made' [Jonny Day, ERL]


Loss of Arctic sea ice '70-95% man-made'

Study finds only 30% (or as little as 5%) of radical loss of summer sea ice is due to natural variability in Atlantic – and it will probably get worse
Since the 1970s, there has been a 40% decrease in the extent of summer sea ice. Photograph: AlaskaStock/Corbis
The radical decline in sea ice around the Arctic is at least 70% due to human-induced climate change, according to a new study, and may even be up to 95% down to humans – rather higher than scientists had previously thought.
The loss of ice around the Arctic has adverse effects on wildlife and also opens up new northern sea routes and opportunities to drill for oil and gas under the newly accessible sea bed.
The reduction has been accelerating since the 1990s and many scientists believe the Arctic may become ice-free in the summers later this century, possibly as early as the late 2020s.
"Since the 1970s, there's been a 40% decrease in the summer sea ice extent," said Jonny Day, a climate scientist at the National Centre for Atmospheric Science at the University of Reading, who led the latest study.
"We were trying to determine how much of this was due to natural variability and therefore imply what aspect is due to man-made climate change as well."
To test the ideas, Day carried out several computer-based simulations of how the climate around the Arctic might have fluctuated since 1979 without the input of greenhouse gases from human activity.
He found that a climate system called the Atlantic multi-decadal oscillation (AMO) was a dominant source of variability in ice extent. The AMO is a cycle of warming and cooling in the North Atlantic that repeats every 6580 years – it has been in a warming phase since the mid-1970s.
Comparing the models with actual observations, Day was able to work out what contribution the natural systems had made to what researchers have observed from satellite data.
"We could only attribute as much as 30% [of the Arctic ice loss] to the AMO," he said. "Which implies that the rest is due to something else, and this is most likely going to be man-made global change."
Previous studies had indicated that around half of the loss was due to man-made climate change and that the other half was due to natural variability.
Looking across all his simulations, Day found that the 30% figure was an upper limit – the AMO could have contributed as little as 5% to the overall loss of Arctic ice in recent decades.
The research is published online in the journal Environmental Research Letters.
Day said that there are a number of feedback effects that could see the Arctic ice loss continue in the coming years, as the Earth warms up.
"[There is] something called the ice-albedo feedback, which means that when you have less ice, it means there's more open water and therefore the ocean absorbs more radiation and will continue to warm," he said.
"It's unclear what will happen – it definitely seems like it's going in that direction."

Monday, July 26, 2010

Arctic air temperature change amplification and the Atlantic Multidecadal Oscillation by Petr Chylek et al., GRL 36 (2009)

Geophysical Research Letters, Vol. 36, L14801, 5 pp., 2009; doi: 10.1029/2009GL038777 

Arctic air temperature change amplification and the Atlantic Multidecadal Oscillation

Petr Chylek (Space and Remote Sensing, Los Alamos National Laboratory, Los Alamos, NM, U.S.A.), Chris K. Folland (Met Office Hadley Centre for Climate Change, Exeter, U.K.), Glen Lesins (Department of Physics and Atmospheric Science, Dalhousie University, Halifax, Nova Scotia, Canada), Manvendra K. Dubey (Earth and Environmental Sciences, Los Alamos National Laboratory, Los Alamos, NM, U.S.A.) and Muyin Wang (Joint Institute for the Study of the Atmosphere and Ocean, University of Washington, Seattle, WA, U.S.A.)

Abstract

Understanding Arctic temperature variability is essential for assessing possible future melting of the Greenland ice sheet, Arctic sea ice and Arctic permafrost. Temperature trend reversals in 1940 and 1970 separate two Arctic warming periods (1910–1940 and 1970–2008) by a significant 1940–1970 cooling period. Analyzing temperature records of the Arctic meteorological stations we find that (a) the Arctic amplification (ratio of the Arctic to global temperature trends) is not a constant but varies in time on a multi-decadal time scale, (b) the Arctic warming from 1910–1940 proceeded at a significantly faster rate than the current 1970–2008 warming, and (c) the Arctic temperature changes are highly correlated with the Atlantic Multi-decadal Oscillation (AMO) suggesting the Atlantic Ocean thermohaline circulation is linked to the Arctic temperature variability on a multi-decadal time scale. 

Received 19 April 2009; accepted 9 June 2009; published 16 July 2009.

Chylek, P., C. K. Folland, G. Lesins, M. K. Dubey, and M. Wang (2009), Arctic air temperature change amplification and the Atlantic Multidecadal Oscillation, Geophys. Res. Lett., 36, L14801; doi: 10.1029/2009GL038777.

Link:  http://www.agu.org/journals/ABS/2009/2009GL038777.shtml

Thursday, February 26, 2009

Samuli Helama et al., Multicentennial megadrought in northern Europe coincided with a global ENSO drought pattern during the Medieval Climate Anomaly

Geology, February 2009, Vol. 37, No. 2, 175178; doi:10.1130/G25329A.1
© 2009 Geological Society of America

Multicentennial megadrought in northern Europe coincided with a global El Niño–Southern Oscillation drought pattern during the Medieval Climate Anomaly

Samuli Helama1, Jouko Meriläinen2 and Heikki Tuomenvirta3

1Department of Geology, P. O. Box 64, 00014 University of Helsinki, 00014 Helsinki, Finland
2SAIMA Unit of Savonlinna Department of Teacher Education, University of Joensuu, P. O. Box 86, 57101 Savonlinna, Finland
3Finnish Meteorological Institute, P. O. Box 503, 00101 Helsinki, Finland

Abstract

The El Niño–Southern Oscillation (ENSO) is a pacemaker of global climate, and the accurate prediction of future climate change requires an understanding of the ENSO variability. Recently, much-debated aspects of the ENSO have included its long-term past and future changes and its associations with the North Atlantic and European sectors, potentially in interaction with the North Atlantic Oscillation and the Atlantic Multidecadal Oscillation. Here we present the first European dendroclimatic precipitation reconstruction that extends through the alternating climate phases of the Medieval Climate Anomaly and the Little Ice Age. We show that northern Europe underwent a severe precipitation deficit during the Medieval Climate Anomaly, which was synchronous with droughts in various ENSO-sensitive regions worldwide, while the subsequent centuries during the Little Ice Age were markedly wetter. We attribute this drought primarily to an interaction between the ENSO and the North Atlantic Oscillation, and to a lesser (or negligible) degree to an interaction between the ENSO and the Atlantic Multidecadal Oscillation.

Link to abstract: http://geology.gsapubs.org/cgi/content/abstract/37/2/175

Thursday, August 14, 2008

Climate change: The next ten years, by Fred Pearce and Michael Le Page

New Scientist, August 13, 2008

WHAT's going to happen to the climate over the next 10 years or so? Is it time to buy that air conditioner you considered during the last heatwave? Should you rip up your garden and replant it with drought-resistant plants, or can you expect more rain -- perhaps even floods -- in your part of world? The other possibility, of course, is that your local climate will change little in the near future.

On the one hand we have weather predictions for the next few days. On the other we have climate forecasts for the very distant future. But what happens in the middle? Why don't we have forecasts for, say, 2010 or 2018? Knowing how temperature and rainfall will change over the next few years would be invaluable to many people, from farmers to the tourism industry to those in charge of our water supplies. Yet while you might think predicting how the climate will change over the next few years would be a lot easier than saying what it will be like in 2030 or 2050, it's actually harder.

Nevertheless, some meteorologists and climate scientists are now trying to make just these kinds of forecasts. It is a new and controversial field, but over the past year some groups have published the first short-term forecasts. So what are they predicting -- and can we trust their conclusions?

Underlying trends

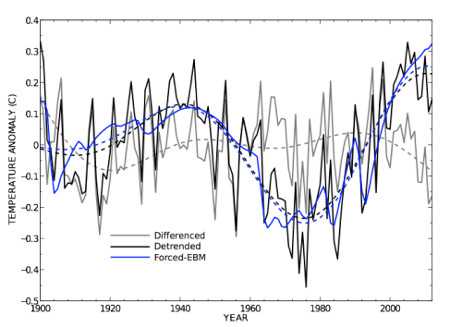
For long-term forecasting, what matters is underlying trends, and at the moment the key trend is warming due to rising levels of greenhouse gases. Predictions made two decades ago are pretty close to the mark. In the short term, though, natural variability matters more than the underlying trend -- global warming does not mean that each year will be warmer than the preceding one.

The problem is a bit like trying to predict how the weather in New York will change over January compared with how the weather will change from January to July. It's hard to say whether the last week of January will be colder than the first, but you can confidently predict that it will be colder during January than in July.

So making forecasts is all about figuring what dominates the state of the atmosphere on various timescales. Some things, like accumulating greenhouse gases, matter over many decades while other things, like warm and cold fronts, dominate over days and months. Over periods of a few years, there's growing evidence that the oceans are the key -- and this is encouraging researchers to attempt short-term forecasts.

Ocean oscillations

"It takes the oceans a long time to heat up and cool down," says Doug Smith, who runs 10-year forecasting trials at the Met Office Hadley Centre in Exeter, Devon, the UK's official centre for climate change research. "That makes it a lot easier to predict than the atmosphere. We now think we can predict the key ocean fluctuations 10 to 20 years ahead."

The oceans are crucial because they store so much heat. It takes more than 1000 times as much energy to heat a cubic metre of water by 1 °C as it does the same volume of air. Globally, this means that if the oceans transfer just a tiny fraction of their heat energy to the lower atmosphere, there can be a big rise in surface air temperatures. Conversely, if the oceans soak up more heat from the atmosphere, there can be surface cooling.

Most of the natural variability in surface air temperature from year to year is due to heat sloshing back and forth between the oceans and atmosphere, rather than any overall loss or gain of heat by the entire planet. The state of the sea surface determines what happens, and it affects both temperature and rainfall. For instance, in recent years, climate scientists have successfully forecast droughts in west Africa and northeast Brazil several months ahead by measuring sea surface temperatures in the tropical Atlantic.

Huge influence

The long-standing droughts in Australia could be due to persistently low sea surface temperatures to the north of country, relative to warmer water in the Indian Ocean, say Wenju Cai and Tim Cowan of the CSIRO marine and atmospheric research centre in Aspendale, Victoria. Rainfall over southern and eastern Australia has been declining for half a century now, causing major problems in river systems like the Murray-Darling basin, which produces much of the country's crops.

The huge influence of sea surface temperatures has led many researchers to try to understand how they fluctuate over years and decades. Predict this, and you should be able to predict all sorts of other things as well.

The best known of these fluctuations is the El Niño-Southern Oscillation. In the tropical Pacific, cold water normally wells up near South America, while hot water piles up on the other side of the Pacific. Sometimes, for reasons poorly understood, the hot water spreads right across the surface of the Pacific in a shallow layer.

This increase in the area of warm water boosts the transfer of heat and moisture to the atmosphere, changing air circulation patterns and producing widespread consequences -- from droughts in Indonesia to floods in the Americas. An especially intense El Niño in 1998 made it one of the warmest years on record.

El Niño

Yet contrary to what you might expect, if El Niño has any long-term effect on global warming it may be to slow it down. Models suggest that by increasing heat radiation into space, it may reduce the net gain of heat by the entire planet as a result of increasing greenhouse gases. Actual measurements are not yet accurate enough to confirm this, however.

The opposite of El Niño, La Niña, results in a heat transfer from the lower atmosphere to the ocean. The strong La Niña during the early part of this year could make 2008 one of the coldest years since the early 1990s.

The El Niño cycle lasts anywhere from three to eight years, but its state cannot be predicted more than a year in advance. However, in the Pacific north of the tropics, there seems to be something akin to El Niño that lasts far longer. It is called the Pacific Decadal Oscillation and its influence is extensive, on land as well as at sea (see "Trendsetters").

The PDO was in a negative phase -- with cooler sea surface temperatures -- between the mid-1940s and the mid-1970s, and may have been partly responsible for the cooler global surface temperatures during this time. This does not mean a negative PDO has a cooling effect overall; on the contrary, it's likely that a negative PDO increases the planet's total heat by reducing heat transfer from the oceans to the atmosphere and thence into space. Since 1976, the PDO has been mostly positive again, which may have contributed to the strong warming in Alaska and the prolonged droughts in south-east Australia.

Droughts and monsoons

The other major ocean fluctuation is the Atlantic Multidecadal Oscillation, a semi-periodical change in surface temperatures north of the equator. Most researchers agree that the AMO is largely due to changes in the speed of the deep-ocean current known as the thermohaline circulation.

When the circulation speeds up, more warm water from the tropics moves up into the North Atlantic, transferring huge amounts of heat to the air as it goes -- the positive phase of the AMO. When a slowing circulation pushes the AMO into a negative phase, more warm water stays in the tropics, and surface temperatures fall in Europe and the eastern side of North America.

The AMO was in a negative phase from the late 1960s until the mid-1990s. We're now in the middle of a positive phase again, which may have contributed to the very rapid warming in the Arctic in recent years and the dramatic fall in the extent of its sea ice during the summer. The effect of a positive AMO on the planet's overall heat budget is not clear, but it may speed up global warming since less ice cover means less solar radiation is reflected back into space.

What's more, there is growing evidence linking the AMO to climatic trends on land, even in areas far from the Atlantic. Decades-long fluctuations in the intensity of the Indian monsoon rains, droughts in the region of west Africa called the Sahel and even the numbers of Atlantic hurricanes all seem to depend on the AMO. Droughts in the western US, including the 1930s Dust Bowl and low river levels in the 1990s, all happened during its positive phase.

The big picture

So what does the future hold? If the AMO stays positive in the coming decade, it will increase summer rainfall over India and the Sahel -- and increase Atlantic hurricane activity. However, the AMO may be poised to turn negative, says Rowan Sutton of the Walker Institute at Reading University, UK, who has studied the phenomenon in detail.

The thermohaline circulation is driven by the sinking of cold, salty water near the Arctic. Its strength, and thus the phase of the AMO, seems to depend on what happens in the waters between Greenland and Scandinavia. "There is evidence that we can sometimes predict the changes up to 10 years ahead," Sutton says.

Meanwhile, the PDO has already been negative for the past couple of years. If both ocean fluctuations were to be in a negative phase over the next few years, things will be very different.

For starters, there will be a slowdown in the rapid warming seen around the Arctic and North Atlantic in recent years. The rapid fall in the extent of sea ice in summer -- which has been happening much faster than predicted -- could slow and perhaps even reverse.

A temporary respite

Droughts could return to India and the Sahel, but for the parched American west there could be a desperately needed respite. On current trends, the great reservoirs on the Colorado river that sustain western cities like San Diego and Phoenix could be dry within a decade. "We are stunned at the magnitude of the problem, and how fast it is coming at us," says Tim Barnett of the Scripps Institution of Oceanography in San Diego. If the AMO enters a negative phase, then the river may live on.

Some also predict a decline in hurricane activity in the Atlantic. But Michael Mann of Penn State University says some things attributed to the AMO are more likely a result of global warming. He thinks the AMO has little influence on tropical sea temperatures, so he predicts that Atlantic hurricanes will intensify even if the AMO is negative. We will have to wait and see.

That's the broad-brush picture. In Europe, several groups are trying to model exactly what might happen over the next 10 years or so. Smith's team produced the first such forecast last year. It suggests that surface air temperatures will remain steady for the next six years or so as cooler sea surface temperatures keep the lower atmosphere cool despite ever higher greenhouse gas levels.

But this respite won't last. Smith expects surface temperatures will start to rise again by 2014, and that they will go into overdrive with a string of record highs at the end of the next decade if both the major ocean oscillations kick back into positive phases.

Global cooling

Earlier this year another group, headed by Noel Keenlyside of the Leibniz Institute for Marine Sciences in Kiel, Germany, produced an even more striking forecast: "Global surface temperature may not increase over the next decade."

Climate change deniers promptly proclaimed that we could expect "more global cooling ahead". But surface temperature is not the same as the overall heat content of the planet. Since the 1960s, 90% of the excess heat due to higher greenhouse gas levels has gone into the oceans, 7% into land and ice, and just 3% into warming the atmosphere. Even if the lower atmosphere doesn't warm in the next few years, that's no reason for comfort so long as the strong warming trend in the oceans continues. In the long run, warmer oceans inevitably mean a warmer atmosphere.

In any case, many climate researchers don't think the Keenlyside forecast is right. "The way they try to predict the AMO is almost guaranteed to give you the wrong answer," says Gavin Schmidt of NASA's Goddard Center for Space Studies in New York.

"The way they try to predict it is guaranteed to give you the wrong answer"

The issue is where the models start from. If you're trying to forecast natural variability, conditions in the seas in the model must match those in the real world. Thanks to a network of undersea sensors, we are now starting to get good data on both temperature and salinity levels in the crucial upper layers of the Atlantic. However, feeding this information into models is not as easy as it might seem and -- unlike Smith's team -- the Keenlyside team put only sea surface temperatures into their model.

Completely wrong

"If you match the sea surface temperatures but not the salinity values, the water density will be completely wrong," says Schmidt. Yet this density is crucial for determining the state of the thermohaline circulation and hence the AMO.

Some of the scientists who write for the RealClimate blog are so sure that the forecast is wrong that they offered the Keenlyside team a bet of €2500 that the average surface temperatures for 2005 to 2015 will, contrary to the team's forecast, turn out be higher than during 1994 to 2004. The team has not accepted the bet.

Even if the various "model initialization" problems can be solved, is it really possible to predict how the oceans will behave so far in advance? According to David Battisti at the University of Washington in Seattle, who specializes in studying natural variability, there's a growing consensus that the PDO is just the mid-latitude "debris" left by the past two or three El Niños or La Niñas. If this is right, it means the PDO cannot be predicted long in advance.

No predictability

"There is no predictability in the Pacific," he says. "If there's any hope for predicting natural variability, it's in the Atlantic." Even there, Battisti thinks it will only be possible to make accurate decadal forecasts for tropical regions where there is far less variability from year to year than in higher latitudes.

What's more, there is another aspect of natural variability that cannot be predicted years in advance: volcanoes. Major volcanic eruptions like those of El Chichón in 1982 and Pinatubo in 1991 can throw up so much dust and sulphur that they cool the entire planet. The average effect of eruptions can be included in forecasts looking several decades ahead, but not in 10-year ones. "The forecast will be wrong when one occurs," says Smith.

There is no doubt that enormous progress has been made in understanding and predicting some of the factors responsible for the tremendous variability in surface air temperatures and rainfall from year to year. But the field is in its infancy. It is still far from clear to what extent natural variability can be predicted years in advance -- and it's going to take decades to find out for sure.

In the meantime, 10-year forecasts should come with a very clear health warning. "There is a danger that if we make a forecast and it's wrong that people will lose faith," Smith acknowledges. "But I don't agree we shouldn't make them."

Climate Change – Want to know more about global warming: the science, impacts and political debate? Visit our continually updated special report.

From issue 2669 of New Scientist magazine, 13 August 2008, page 26-30.

Link to article:
http://environment.newscientist.com/channel/earth/mg19926691.500-climate-change-the-next-ten-years.html