Blog Archive

Showing posts with label typhoons. Show all posts

Wednesday, October 24, 2018

Jeff Masters: Extreme 'Grey Swan' Hurricanes in Tampa Bay: a Potential Future Catastrophe

Extreme 'Grey Swan' Hurricanes in Tampa Bay: a Potential Future Catastrophe

A “black swan” hurricane — a storm so extreme and wholly unprecedented that no one could have expected it — hit the Lesser Antilles Islands in October 1780. Deservedly called The Great Hurricane of 1780, no Atlantic hurricane in history has matched its death toll of 22,000. So intense were the winds of the Great Hurricane that it peeled the bark off of trees – something only EF5 tornadoes with winds in excess of 200 mph have been known to do. However, hurricanes even more extreme than the Great Hurricane of 1780 can occur in a warming climate, and can be anticipated by combining physical knowledge with historical data. Such storms, which have never occurred in the historical record, can be referred to as “grey swan” hurricanes, according to research published in Nature Climate Change in 2015 by Kerry Emanuel of MIT and Ning Lin of Princeton University (press release here). Using a detailed hurricane model embedded within six different global climate models, the scientists showed that the risk of extreme “grey swan” hurricanes for three specific locations  Tampa, Florida; Cairns, Australia; and the Persian Gulf  may increase by up to a factor of 14 by the end of the century, thanks to our changing climate. We'll focus in this post on the results for Tampa. 


Figure 1. Damage to Tampa’s Bayshore Boulevard after the 1921 Tampa Bay hurricane. 


Figure 2. Track of the Tampa Bay Hurricane of 1921, one of only two major hurricanes ever recorded to hit the city. This Category 3 storm with 115 mph winds brought a storm tide of 10.0
11.5 feet (3.03.5 meters) to Tampa Bay. 

Tampa’s hurricane history: only two major hurricanes since 1848

Tampa Bay doesn't get hit very often by hurricanes. This is because the city faces the ocean to the west, and the prevailing east-to-west trade winds at that latitude make it uncommon for a storm to make a direct hit on the west coast of Florida from the ocean. This is fortunate, since the large expanse of shallow continental shelf waters offshore from Tampa Bay (less than 300 feet deep out to 90 miles offshore) is conducive for allowing large storm surges to build. In a worst-case scenario, with a powerful hurricane traveling north-northwestwards at just the right speed parallel to the coast, the geometry of the coast creates a unique additional rise in the water level due to a phenomenon known as a coastally trapped Kelvin wave. 


Figure 3. Two possible tracks of the Great Gale of 1848, the most violent hurricane in Tampa's history, a Category 3 or 4 hurricane with 115
135 mph winds. A 15-foot storm surge (4.6 meters) was observed in what is now downtown Tampa.

The last time Tampa suffered a direct hit by any hurricane was 1946, when a Category 1 storm came up through the bay. The Tampa Bay Hurricane of October 25, 1921, was the last major hurricane to make landfall in the Tampa Bay Region. This low-end Category 3 storm with 115 mph winds at landfall brought a storm tide of 10.0
11.5 feet (3.03.5 meters), causing severe damage ($10 million in 1921 dollars). The only other major hurricane to hit the city occurred on September 25, 1848, when the Great Gale of 1848, the most violent hurricane in Tampa's history, roared ashore as a Category 3 or 4 hurricane with 115135 mph winds. A 15-foot storm surge (4.6 meters) was observed in what is now downtown Tampa, and the peninsula where St. Petersburg lies, in Pinellas County, was inundated, making St. Petersburg an island. A large portion of what few human structures were then in the area were destroyed.


Figure 3. Predicted height above ground of the water from a worst-case Category 4 hurricane in the Tampa Bay region, as computed using NOAA's SLOSH storm surge model. Downtown Tampa Bay would be inundated by more than 20 feet of water, and St. Petersburg would become an island, as occurred during the 1848 hurricane. Image taken from our storm surge inundation maps.

Tampa fury: global warming may make grey swan hurricanes up to 14 times more likely

The risk of grey swan hurricanes increased in the models used in the study due to an increase in both the frequency and intensity of hurricanes in the future climate. While an increase in the frequency of hurricanes due to global warming is something many models run by other hurricane scientists do not show happening, there is widespread agreement among hurricane scientists that the strongest storms should get stronger, and a number of studies have shown that Cat 4/5 storms already make up an increasing proportion of tropical cyclones, at least in some basins (though the quality of our observations adds considerable uncertainty to this finding). Stronger storms are to be expected, because hurricanes are heat engines that extract heat energy from the oceans and convert it to wind energy, and any increase in ocean heat energy due to global warming can be expected to increase the maximum potential intensity a hurricane can reach. An additional factor not considered: potential intensity theory suggests that hurricanes will increase in size; storms that have a larger diameter push up a larger and more damaging storm surge since strong winds are blowing over a larger ocean area. Also, the study did not consider the impact of sea level rise, which will steadily increase storm surge damage in the coming decades. A 2007 study by Tufts University, 
Florida, and Climate Change, found that a 2.25-foot increase in sea level 
 which many sea level rise scientists expect will happen by the end of the century  would put 152,000 people in Pinellas County (where St. Petersburg is located) under water at high tide. 

A ferocious upper-end Category 3 or stronger hurricane, capable of delivering a storm surge of 20 feet (6 meters) or higher, had about a 1-in-10,000 year recurrence interval in the historical climate of 1980–2005, the scientists estimated. In other words, such a storm had a 0.01 percent chance of occurring in any given year, or a 0.3% chance when summed up over a 30-year period. However, in a business-as-usual global warming scenario, the six climate models showed that such a storm might become between four and fourteen times more likely by the end of the century—a 1-in-2,500 to 1-in-700 year event. Summed up over a 30-year time period, a 1-in-700 year event has a 4% chance of occurrence—something disaster planners should definitely think about. 

Tampa's "Category 6" hurricane: a mind-boggling 830 mb storm with 233 mph winds
The researchers found that extreme Category 5 hurricanes capable of delivering a storm surge of 26
36 feet (811 meters) to Tampa had an extremely low or negligible probabilities in the climate of the late 20th Century, but are projected to happen as 1-in-5,000 to 1-in-150,000-year events in the late twenty-first century. We might need to invent a "Category 6" designation for the 1-in-150,000 year storm that came up in their simulations – a run of the HADGEM climate model that showed an unimaginably intense hurricane with a central pressure of 830 mb, top sustained winds of 233 mph, traveling parallel to the coast along just the right track to generate a titanic 36-foot storm surge. Even accounting for the 15% reduction in winds that would occur due to friction over land, the winds from such a “Category 6” hurricane would be like those of the EF5 tornado that leveled Joplin Missour  except that EF4 to EF5 damage would be along a swath 22 miles wide, instead of a few hundred yards wide! A July 2016 paper by Columbia University hurricane scientist Adam Sobel and colleagues in Science, "Human influence on tropical cyclone intensity," stated that we should expect to see about a 2.2 mph (1 m/s) per decade increase in the winds of the strongest hurricanes, or about 19 mph by the year 2100. If we assume the 215 mph sustained winds of 2015’s Hurricane Patricia (off the Pacific coast of Mexico) as the current maximum potential intensity that a hurricane can reach, a 235 mph hurricane by the end of the century is definitely a possibility.

Other estimates of Tampa Bay's hurricane risk
Extreme "grey swan" hurricanes are difficult to model, since they are such rare and extreme events. Thus, we should consider all the estimates of the potential return periods of such storms as highly uncertain.

In 2010, the Tampa Bay Regional Planning Council put out the Tampa Bay Catastrophic Plan, a scenario where a Category 5 "Hurricane Phoenix" hits downtown Tampa with 160 mph winds and a 26-foot storm surge. The study projected that the city would see about 2,000 deaths and nearly $250 billion dollars in damage. 

Dr. Peter Sousounis, a meteorologist for risk-modeling company AIR Worldwide, told me in an email that their maximum loss
causing event for Tampa Bay is a Category 5 storm with sustained winds of 220 mph that hits Manatee County with a central pressure of 887 mb. This nightmare storm generates $220 billion in insured losses in a four-county region (Manatee, Pinellas, Pasco, and Hillsborough counties)  a level of loss for those counties that has a 1-in-10,000 year recurrence interval. Since uninsured losses from a hurricane strike are usually roughly as much as the insured losses, the total damage from this storm might top $400 billion dollars.

An August 2015 report by Karen Clark & Company, "Most Vulnerable US Cities to Storm Surge Flooding," cited Tampa/St. Petersburg as the most vulnerable metropolitan area in the U.S. to storm surge damage. Their 1-in-100 year storm 
 a strong Category 4 hurricane with 150 mph winds  could be expected to cause $175 billion in damage just from the storm surge.

Two mass evacuations in Tampa in the past 35 years
Two hurricanes have prompted mass evacuations of more than 300,000 people from the Tampa Bay area over the past 35 years. The first was Hurricane Elena of 1985, a Category 3 hurricane that stalled 80 miles offshore for two days on Labor Day weekend, bringing a 6
7 foot storm surge, wind gusts of 80 mph, and torrential rains. On August 13, 2004, another mass evacuation was ordered for Hurricane Charley. Thanks to a late track shift, Charley missed Tampa Bay, and instead hit well to the south in Port Charlotte as a Category 4 storm with 150 mph winds. More limited evacuations of low-lying areas and mobile homes in the 4-county Tampa Bay region were ordered for three other hurricanes in the past twenty years  Hurricane Georges of 1998, Hurricane Frances of 2004, and Hurricane Jeanne of 2004. 


Figure 4. A sensible hurricane awareness effort: Hillsborough County, Florida got a $30,000 grant to post 30 of these signs around the Tampa Bay area to show how high a storm surge from a major hurricane might reach. This sign by a McDonalds at 19th Ave and Highway 41 is thirteen feet above ground level. Image credit: photonews247.com.

Tampa Bay's vulnerability to hurricanes

When the 1921 hurricane hit Tampa Bay, there were 160,000 residents in the 4-county region, most of whom lived in communities on high ground. Today there are 2.8 million residents in the region, and that number is growing by about 50,000 people per year. Most of the population in the 4-county Tampa Bay region lives along the coast in low-lying areas; about 50% of the population lives at an elevation less than 10 feet. Over 800,000 people live in evacuation zones for a Category 1 hurricane, and 2 million people live in evacuation zones for a Category 5 hurricane, according to 
the 2010 Statewide Regional Evacuation Study for the Tampa Bay Region. Given that only 46% of the people in the evacuation zones for a Category 1 hurricane evacuated when an evacuation order was given when 2004's Category 4 Hurricane Charley threatened the region, the potential exists for hundreds or even thousands of people to die when the next major hurricane hits. 

References
Barnes, J., 1999, Florida’s Hurricane History. The University of North Carolina Press.

Weisberg, R.H, and L. Zheng, 2006, "Hurricane storm surge simulations for Tampa Bay," Estuaries and Coasts Vol 29, No. 6A, pp 899-913.

History of Pasco County: The 1921 Hurricane

A July 2016 paper in ScienceHuman influence on tropical cyclone intensity.

The 2010 Statewide Regional Evacuation Study for the Tampa Bay Region.

The Tampa Bay Catastrophic Plan for a Category 5 $250 billion hurricane.

My August 14, 2012, post, The odds of a hurricane spoiling the Republican National Convention in Tampa.

My February 2016 post, Hurricane Patricia's 215 mph Winds: A Warning Shot Across Our Bow.

My 2013 post, Hurricanes and Climate Change: Huge Dangers, Huge Unknowns.

Latest 2016 disaster planning info from the Tampa Bay Regional Planning Council.

Climate Central's interactive Risk Zone Map for sea level rise in the Tampa Bay area.


Video 1. A newscast I hope I never see the likes of: a frightening look at the potential effects of a catastrophic Category 5 hurricane making a direct landfall on the Tampa Bay metro area, as envisioned by the 2010 Tampa Bay Catastrophic Plan Hurricane Phoenix scenario. 

https://www.wunderground.com/blog/JeffMasters/extreme-grey-swan-hurricanes-in-tampa-bay-a-potential-future-catast.html

Wednesday, January 17, 2018

2017’s costly climate change-fueled disasters are the ‘new normal,’ warns major reinsurer Munich Re

“We have a new normal” thanks to climate change, explains leading reinsurer.


by Joe Romm, Climate Progress, January 4, 2018


Hurricane Harvey Impacts. CREDIT: Getty Images
HURRICANE HARVEY IMPACTS. CREDIT: GETTY IMAGES


It turns out 2017 was a uniquely disastrous year in more ways than one, evidenced by German reinsurer Munich Re’s recently released review of the year’s global catastrophes.
Led by massive, climate change-fueled hurricanes Harvey, Irma, and Maria, 2017’s natural disasters will cost insurers a record $135 billion. Adding in uninsured losses brings the total global damages to $330 billion, which is second only to 2011.
“We have a new normal,” Munich Re’s Ernst Rauch told Reuters. Rauch, who runs the group tracking climate change risks, pointed out that “2017 was not an outlier” in having more than $100 billion in insured losses (see chart below). “We must have on our radar the trend of new magnitudes,” Rauch said.
The big reinsurers like Munich Re make their money by insuring the companies that directly insure your property. Those smaller companies are often required by law to buy reinsurance because they lack the capital resources to pay out if there is a major disaster, like superstorm Harvey for instance.
Since the reinsurers must pay out billions and billions of dollars for such mega-disasters, they have a unique incentive to understand and predict trends in mega-disasters. That’s why companies like Munich Re and Swiss Re have been at the forefront of warning businesses and the public about the rise in extreme weather events due to climate change.
Indeed, back in September 2010, another year of stunning warming-driven extreme weather events, Munich Re issued a release noting it had analyzed its catastrophe database, “the most comprehensive of its kind in the world,” and concluded, “the only plausible explanation for the rise in weather-related catastrophes is climate change.” 
Then in October 2012, the company released a massive 274-page report, “Severe weather in North America,” analyzing weather catastrophes and related losses since 1980 to understand trends and their causes, including man-made climate change.
Munich Re found that the number of weather-related loss disasters has been rising much faster in North America than anywhere else, and concluded, “Climate-driven changes are already evident over the last few decades for severe thunderstorms, for heavy precipitation and flash flooding, for hurricane activity, and for heatwave, drought and wild­fire dynamics in parts of North America.”
Prof. Peter Höppe, who heads Munich Re’s Geo Risks Research unit, said at the time, “In all likelihood, we have to regard this finding as an initial climate-change footprint in our U.S. loss data from the last four decades.”
And last April, Munich Re published an article on “rapid attribution,” which explained that we can now rapidly determine how much intensity or frequency of some extreme weather events is affected by man-made climate change. Learning that, for instance, climate change has sharply increased the chances of individual extreme rain and flooding events – such as devastating August 2016 deluge and flooding of Baton Rouge, Louisiana – allows communities to do better planning and Munich Re to do better risk management.
The latest annual report amplifies the message that humans are changing the climate, boosting the intensity and frequency of extreme weather events, and that the longer we dawdle, the higher the costs we will incur. The only question is, is anyone listening?

Sunday, April 2, 2017

Climate Code Red: Climate change pushing floods, cyclones to new extremes, with worse to come

by David Spratt, Climate Code Red, April 1, 2017


With Australia experiencing the aftermath of Cyclone Debbie and record-breaking rains and severe flooding in southeast Queensland and along the north coast of New South Wales, here’s a look at how global warming has, and will, push floods and cyclones to new extremes.

Flooding extremes

Warm air can be more humid than cold air, that is, it can hold more water vapour in absolute terms. And atmospheric water vapour content increases 7% for each 1-degree-Celsius increase in global average temperature, establishing the conditions for more intense rainfall events. 

Flash floods are likely to sweep across the Australian landscape with increasing intensity, particularly in urban or residential areas. Peak rainfall is predicted to soar with rising surface temperatures as Australia experiences ever greater extremes of heat.  

The frequency of major flood events (defined as events which caused extensive flooding within 50 kilometres of the coast, or inundation that extended 20 kilometres along the coast) along Australia's eastern seaboard has doubled in last 150 years, with climate change one of the possible factors, senior Bureau of Meteorology researchers say. 

Record-breaking heavy rainfall and a clear upward trend in downpours over the last 30 years fits in with global temperature rise caused by greenhouse gases. Statistical analysis of rainfall data from 1901 to 2010 around the globe, shows that from 1980 to 2010 there were 12% more of these intense events than would be expected in a climate without global warming. Wet regions generally saw a bigger increase in deluges and drier regions a smaller one. In southeast Asia, the observed increase in record-breaking rainfall events is as high as 56%.

Giant air streams pushing new extremes: The increase of devastating weather extremes in summer, including floods, is likely linked to human-made climate change, mounting evidence shows, with the recent discovery of giant airstreams circling the Earth, waving up and down between the Arctic and the tropics. These planetary waves transport heat and moisture. When these planetary waves stall, droughts or floods can occur. Warming caused by greenhouse-gases from fossil fuels creates favourable conditions for such events.

 “The unprecedented 2016 California drought, the 2011 U.S. heatwave and 2010 Pakistan flood, as well as the 2003 European hot spell, all belong to a most worrying series of extremes,” says Michael Mann, a lead author of the study. “The increased incidence of these events exceeds what we would expect from the direct effects of global warming alone, so there must be an additional climate change effect. In data from computer simulations as well as observations, we identify changes that favour unusually persistent, extreme meanders of the jet stream that support such extreme weather events. Human activity has been suspected of contributing to this pattern before, but now we uncover a clear fingerprint of human activity.”

Attribution studies show how the risk of a particular event may have changed due to the human influence on climate. Some attribution results surveyed by the World Meteorological Organisation include:

  • The US National Oceanic and Atmospheric Administration determined that human-caused climate change increased chances of the fatal and record rains in Louisiana by at least 40% and could have nearly doubled the odds of such a storm.
  • A scientific analysis of devastating 2014 floods in the United Kingdom, which cost an estimated $646 million in insurance losses, found that human-caused climate change has increased the chance of the extreme rain event by 43%.
  • In May–June 2016, portions of northeast France received 6 full weeks of rain in 24 hours. A formal attribution study released June 9, 2016, found that such extreme rains are at least 40%—and as much as 90%—more likely in some areas of France.
Cyclone extremes

Cyclones, in part, draw their energy from the temperature of the ocean's surface waters, so a warming climate and ocean puts more energy into storms, including cyclones, loading them with more rainfall, and stronger winds pushing more of a storm surge.
The recent Climate Council brief notes, “Increasing temperature of the surface ocean affects the intensity of cyclones, both maximum wind speeds and in the intensity of rainfall that occurs in association with the cyclone.”  The force exerted on buildings and structures when cyclones make landfall increases disproportionately with wind speed.

The Council also notes that: “Tropical cyclones form most readily when there are very warm conditions at the ocean surface and when the vertical temperature gradient through the atmosphere is strong. As this vertical gradient weakens as the climate continues to warm, it is likely that fewer tropical cyclones will form.”

Whilst the best evidence scientists have suggests cyclones are unlikely to increase in number, a 2013 study challenges the status quo, suggesting they will occur more frequently, as well becoming more intense. 

In 2013, researchers reported that the stronger hurricanes in the North Atlantic, the South Pacific, and South Indian Oceans have become more intense.  The same year, the UN meteorological agency concluded that climate change is making super typhoons worse. 

In 2015, an international research team found that a warming planet is already stoking the intensity of tropical cyclones in the northwest Pacific, and their ferocity will continue to increase even with moderate climate change over this century.

More broadly, a 2010 study found that "future projections based on theory and high-resolution dynamical models consistently indicate that greenhouse warming will cause the globally averaged intensity of tropical cyclones to shift towards stronger storms, with intensity increases of 2–11% by 2100...higher resolution modelling studies typically project substantial increases in the frequency of the most intense cyclones, and increases of the order of 20% in the precipitation rate within 100 km of the storm centre.

Recent records

With sustained wind speeds of more than 310 kilometres per hour, Typhoon Haiyan in the Philippines in November 2013 was the most powerful tropical cyclone to make landfall in recorded history. The previous record was held by Hurricane Camille, which in 1969 hit the state of Mississippi with wind speeds of just over 300 km/h. Data compiled from the US National Oceanic and Atmospheric Administration shows sea temperatures were about 0.5
1.0 degree Celsius above normal in the waters to the east of the Philippines as Haiyan began forming. The waters cooled in the storm's wake, an indication of how the storm sucked up energy.   

Hurricane Patricia which hit Mexico in October 2015 achieved a record peak intensity with maximum sustained winds 345 km/h, making it the most intense tropical cyclone on record in the Western Hemisphere, and the strongest globally in terms of 1-minute maximum sustained winds. Cyclone Winston in February 2016 was the strongest tropical cyclone to make landfall in Fiji and the South Pacific Basin in recorded history.

Attribution studies 

  • Superstorm Sandy which hit the northeast coast of the USA with devastating effect in October 2012 was made worse by unusually warm waters which increased the hurricane’s intensity. As well, human-caused sea level rise added to the storm surge, and on the stretch of the Atlantic Coast that spans from Norfolk to Boston, sea levels have been rising four times faster than the global average. Researchers say that “It is possible that subways and tunnels may not have been flooded without the warming-induced increases in sea level and storm intensity and size.”  More broadly, the authors say that “‘snowmaggedon’ in February 2010, superstorm Sandy in October 2012 , supertyphoon Haiyan in November 2013, and the Boulder floods of September 2013 were all influenced by high sea-surface temperatures that had a discernible human component.
  • The Climate Council reported that climate change exacerbated the damage caused by Cyclone Pam, which left a trail of destruction across Vanuatu in 2015.
Damage 

Reinsurance giant, MunichRe, says that "nowhere in the world are weather risks changing faster than in Eastern Asia," and concludes that "as a result of climate change... the intensity of typhoons will increase" in Eastern Asia.  On 11 November 2013, in the aftermath of super-typhoon Haiyan, MunichRe surveyed losses:

Eastern Asia has been hard hit by weather-related loss events in the past three decades. Their number has increased by more than a factor of four, causing overall losses from weather-related events of some US$ 700bn during this period. The insured losses of US$ 76bn amounted to only around 10% of overall losses, with 62% of these attributable to Japan. Floods caused 56% of the overall losses in Eastern Asia, but only 30% of insured losses. The number of floods has increased strongly and is expected to increase further in the coming decades. With insured losses of US$ 16bn, the 2011 Thailand floods caused the biggest-ever weather-related insured loss in the region. After floods, it is typhoons that cause the greatest weather-related losses. New analyses indicate a clear cycle of activity for typhoons, and increased typhoon activity is expected over the coming years..."
And in Australia, The Age reports that new modelling has shown that a cyclone the size of Debbie could have catastrophic consequences on the Gold Coast and as far as Brisbane, with winds of 260km/h, in areas where many homes and towers do not meet cyclonic safety standards. As climate change pushes cyclones further south, tens of billions of dollars worth of infrastructure is at risk. Actuaries, who predict and model scenarios for banks and insurers, have warned properties could become "uninsurable" as premiums rise up to 250% to meet this global warming challenge.

http://www.climatecodered.org/2017/04/climate-change-pushing-floods-cyclones.html

Sunday, September 11, 2016

Ocean warming intensifies power of typhoons

The violence of typhoons that devastate Asian coastal regions is being magnified by rising sea surface temperatures caused by greenhouse gas emissions.


by Tim Radford, Climate News Network, September 11, 2016


LONDON – The typhoons that have slammed into the coasts of east and southeast Asia have become more violent, increasing in intensity by between 12% and 15% over the last four decades, according to a new study.
And the proportion of storms that meet the classification of category 4, with winds at 200 kilometres per hour, and category 5, with gusts of more than 250 kph, has at least doubled and may have tripled.
The good news for mariners is that those tropical cyclones that stay over the open ocean have not gotten significantly worse. The windstorms that pound the land, though, are potentially more destructive.
The cause of the intensity is an overall warming of ocean surface waters in the northwest Pacific Ocean.
And the researchers say: “The projected ocean surface warming pattern under increasing greenhouse gas forcing suggests that typhoons striking eastern mainland China, Taiwan, Korea and Japan will intensify further.

Damage by typhoons

“Given disproportionate damages by intense typhoons, this represents a heightened threat to people and properties in the region.”
It confirms that the number of severe hurricanes has increased by 25% to 30% for each degree of global warming so far. And, once again, greenhouse gas emissions are to blame.
“Most of the heat from human-induced warming since the 1970s – a staggering 93% – has been absorbed by the ocean, which acts as a buffer against climate change, but this comes at a price,” says Dan Laffoley, marine vice-chair of the World Commission on Protected Areas at IUCN, and one of the study’s authors.
“We were astounded by the scale and extent of ocean warming effects on entire ecosystems made clear by this report.”

“Ocean warming is one of this generation’s
greatest hidden challenges – and one for which
we are completely unprepared”

The IUCN study was compiled by 80 scientists from 12 nations, and it highlights the scientific evidence of impacts on marine life – from microbes to the great sea mammals – that are likely to increase significantly even if humans drastically reduce fossil fuel combustion and cut the carbon dioxide emissions that drive global warming.
The scientists say ocean warming is already affecting ecosystems from the poles to the Equator, driving plankton, jellyfish, seabirds, and turtles up to 10 degrees of latitude nearer to the poles.
In East Africa, ocean warming has reduced fish numbers by destroying parts of the reefs the fish depend upon. If humans go on releasing carbon dioxide emissions at the current rate, by 2050, marine fisheries harvests in southeast Asia are expected to be up to 30% lower than the average for the years 1970-2000.
Both studies are confirmatory rather than ground-breaking. Researchers have repeatedly warned that Pacific tropical cyclones and Atlantic hurricanes are likely to become more destructive.

 Landfalling storms

Atmospheric scientists Now Wei Mei and Professor Shang-Ping Xie, of the Scripps Institution of Oceanography in California, report that they looked again at the data, to confirm first that landfalling storms – about half of all typhoons hit the coasts – have intensified, and secondly that rising sea surface temperatures are the cause.
The IUCN research, too, is a re-examination: other studies have confirmed the link between ocean warming and climate change, and between ocean warming and ecosystem destruction. But, on a planet that is 70% ocean, nobody can be sure of the consequences.
“Ocean warming is one of this generation’s greatest hidden challenges – and one for which we are completely unprepared,” says Inger Andersen, director general of the IUCN.
“The only way to preserve the rich diversity of marine life, and to safeguard the protection and resources the ocean provides us with, is to cut greenhouse emissions rapidly and substantially.” 

Friday, November 27, 2015

90% of disasters are now weather-related, COP 21: New study informs Paris summit delegates that extreme weather in the last two decades has claimed well over half a million lives and cost trillions of dollars

by Tim Radford, Climate News Network, November 27, 2015

LONDON – In the 20 years since the first UN conference on climate change, weather-related disasters have claimed 606,000 human lives, damaged or destroyed 87 million homes, and injured, displaced or left helpless a total of 4.1 billion people.

A new study from the UN Office for Disaster Risk Reduction (UNISDR) demonstrates that 90% of all disasters are now weather-related. And the average of 335 weather-related disasters per year in the last 10 years is twice that recorded between 1985 and 1995

The report, "The Human Cost of Weather-Related Disasters 19952015," is intended to focus attention during the UN climate change conference – which opens in Paris on Monday − on the damage already inflicted by global warming as a consequence of rising levels of greenhouse gases in the atmosphere, in turn as a consequence of the human combustion of fossil fuels and the destruction of the planet’s forests.


Development cost

As world leaders head for the summit, referred to as COP21, the numbers alone tell the story. In the last 20 years, there have been 6,457 floods, storms, heatwaves, droughts and other climatic events that meet the UN definition of a disaster − that is, they killed people, displaced communities, or caused damage calculated in millions.

But there are figures nobody can assess. One of these is the true economic cost, especially in terms of economic development.

The UN’s Centre for Research on the Epidemiology of Disasters, based at the Catholic University of Louvain in Belgium, puts the tally at US$1.891 trillion over the last 20 years.

However, that accounts for about only 71% of all losses attributable to natural hazards. The true figure for disasters – including earthquakes and tsunamis – could be between $250bn and $300bn a year, which would mean a total of up to $6 trillion just for the last decade.

In terms of numbers, the US was hit most often, with 472 recorded tornadoes, ice storms, hurricanes, floods, heatwaves, droughts and other events. China followed with 441, India with 228, the Philippines with 274, and Indonesia with 263.

The greatest loss of lives was in Asia, where 332,000 people died and 3.7 billion were affected. Cyclone Nargis, which hit Myanmar in 2008, claimed 138,000 lives.

Floods accounted for 47% of all weather-related disasters in the 20 years, affecting 2.3 billion people and killing 157,000. Storms accounted for 242,000 deaths, or 40% of the total. Almost 90% of these deaths were in the lower-income nations.

Paradoxically, higher-income countries felt the impact of temperature extremes. Of the 164,000 who perished when the thermometer dropped or climbed to catastrophic levels, 148,000 died during heat waves, and 90% of these deaths were in Europe.

Greater extremes

But drought hit Africa more than any other continent, with 136 arid spells between 1995 and 2015, and 77 of these were in East Africa.

Researchers have repeatedly given warnings that global warming is likely to be accompanied by greater extremes.

“In the long term, an agreement in Paris at COP21 on reducing greenhouse gas emissions will be a significant contribution to reducing damage and loss from disasters, which are partly driven by a warming globe and rising sea levels,” says Margareta Wahlström, head of UNISDR.

“For now, there is a need to reduce existing levels of risk and avoid creating new risk by ensuring that public and private investments are risk-informed and do not increase the exposure of people and economic assets to natural hazards on flood plains, vulnerable low-lying coastlines, and other locations unsuited for human settlement.” 

Monday, July 6, 2015

Van Gogh Weather Patterns in Pacific: a climate change connection?

by A. Siegel, "Get Energy Smart! NOW!", July 6, 2015

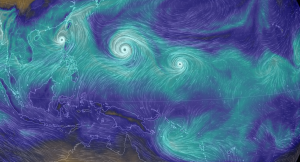
Science combined with nature can turn imageterrifying realities, at times, into gorgeous art. At this moment, there are three active typhoons in the Pacific.  Above is an image capturing them.
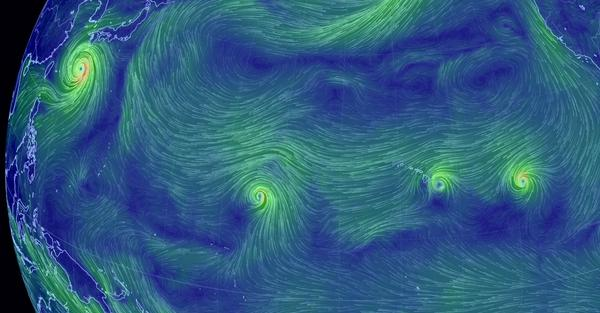
This reminds me strongly of last August when the Pacific Ocean (centered around the Hawaiian Archipelago) had a major meteorological phenomena: a massive set of hurricanes.
Regard this image from that event.
From West to East, these are hurricanes Halong, Genevieve, Iselle, and Julio.
Documentation of severe weather often provides quite striking and even beautiful images.
On first glance, last year and today, my impression was “Van Gogh, not “storm disaster.”

And, even when registering this as a rather impressive (and beautiful image from a) weather pattern, my first thought was not ‘climate change’; yet, this set of four hurricanes is not just occurring within the context of global climate change but could well be a strong indicator of actual change.

Wednesday, November 20, 2013

Will extreme weather like super typhoon Haiyan become the new norm?

The strongest hurricanes are becoming stronger, fueled by warmer oceans caused by climate change

by Dana Nuccitelli, "Climate Consensus -- The 97%," The Guardian, November 20, 2013

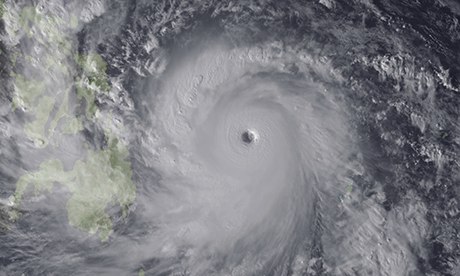
Satellite image of typhoon Haiyan 7/11/13
Typhoon Haiyan over the Leyte Gulf, east of the central Philippines. Photograph: Zuma/Rex Features
Typhoon Haiyan may have been the strongest storm ever recorded; a fact that has triggered an array of stories discussing its possible links to climate change.

Global Warming Fuels Hurricanes

Climate scientists are confident in three ways that climate change will make the impacts of hurricanes worse. First, global warming causes sea level rise, which amplifies storm surges and flooding associated with hurricanes. As a paper published in the Proceedings of the National Academy of Sciences by Aslak Grinsted and colleagues concluded,
"we have probably crossed the threshold where Katrina magnitude hurricane surges are more likely caused by global warming than not."
Second, as climate scientist Kevin Trenberth has noted, global warming has also increased the amount of moisture in the air, causing more rainfall and amplifying flooding during hurricanes.
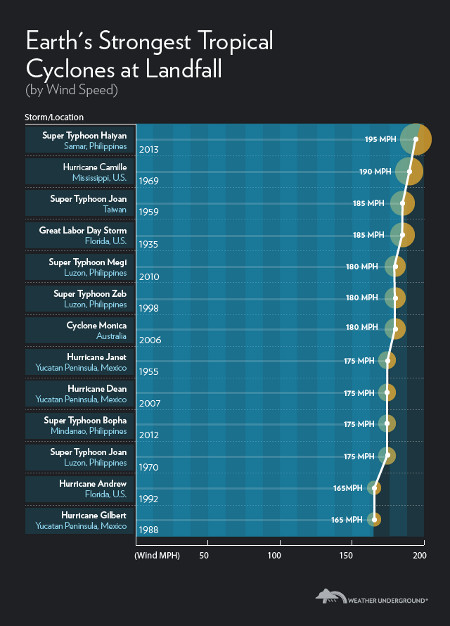
Third, warmer oceans are fuel for hurricanes. Research has shown that the strongest hurricanes have grown stronger in most ocean basins around the world over the past several decades, and climate models consistently project that this trend will continue. Chris Mooney recently documented the past decade's worth of monster hurricanes around the world, and Jeff Masters estimates that 6 of the 13 strongest tropical cyclones on record at landfall have happened since 1998.
The 13 strongest tropical cyclones at landfallThe 13 strongest tropical cyclones at landfall. 6 have happened since 1998. Source: wunderground.com

What about Typhoon Intensity Near the Philippines?

Chapter 2.6.3 of the 2013 IPCC report notes,
"Time series of cyclone indices such as power dissipation ... show upward trends in the North Atlantic and weaker upward trends in the western North Pacific since the late 1970s"
The hurricane intensity trend in the western North Pacific (where the Philippines are located) isn't crystal clear. One recent paper finds that over the past few decades their intensity has slightly fallen (but has grown for the planet as a whole), while others suggest it's slightly risen, or that there are fewer but stronger hurricanes in that western North Pacific region.
However, a paper published earlier this year in the Proceedings of the National Academy of Sciences by MIT hurricane expert Kerry Emanuel found that future "Increases in tropical cyclone activity are most prominent in the western North Pacific." So while we're not certain about the trend over the past few decades, the evidence indicates that hurricanes near the Philippines will both become stronger and form more frequently in a warmer world.

Hurricane Frequency Used to Sow Doubt

The frequency of hurricane formation overall is another story. To this point the evidence does not indicate that hurricanes are forming or making landfall more often than in the past, nor are climate scientists confident how global hurricane frequency will change. Thus it's not a surprise that climate contrarians have focused on hurricane frequency while ignoring hurricane intensity. This is a clear sign of bias by writers like the Mail on Sunday's David Rose, who even went as far as to once again repeat the myth of a global warming 'pause' (a myth that was comprehensively debunked by a new study last week).
Similarly, in a piece published in The Guardian Political Science section, Roger Pielke, Jr., criticized President Obama, climate scientist Michael Mann, and others for linking extreme weather to climate change. Pielke lamented that those he criticized didn't reference the 2012 IPCC special report on extreme weather (SREX). However, Pielke's reading of that report was very selective.

Climate Change Intensifies Many Types of Extreme Weather

The IPCC SREX emphasizes that hurricane data include significant uncertainties. However, it's important to note that absence of evidence is not the same as evidence of absence. For example the fact that the data aren't good enough to confidently link rising hurricane intensity to human greenhouse gas emissions so far doesn't mean there isn't a link. It means we need better data to make a conclusive determination.
However, the report does note that several types of extreme weather will intensify as climate change continues:
"Heavy rainfalls associated with tropical cyclones are likely to increase with continued warming."
"Average tropical cyclone maximum wind speed is likely to increase."
"There is medium confidence that some regions of the world have experienced more intense and longer droughts ... There ismedium confidence that droughts will intensify in the 21st century in some seasons and areas ... This applies to regions including southern Europe and the Mediterranean region, central Europe, central North America, Central America and Mexico, northeast Brazil, and southern Africa."
"It is virtually certain that increases in the frequency and magnitude of warm daily temperature extremes and decreases in cold extremes will occur in the 21st century at the global scale. It is very likely that the length, frequency, and/or intensity of warm spells or heat waves will increase over most land areas."
When considering all the available evidence, most of the comments about climate change and extreme weather criticized by Pielke were on solid scientific footing. It's important that we face up to not just the changes in extreme weather that we've seen so far, but those which are soon to come if we continue on our current path. It's not so much the climate change we've seen so far that we're worried about; it's what's yet to come.

What Do We Do About It?

Some climate contrarians have claimed that climate realists are exploiting the victims of Haiyan by discussing the link between hurricanes and climate change. But it was Yeb Saño, the Philippines' lead negotiator to this year's United Nations climate talks who pleaded that we stop procrastinating in addressing climate change.

As Michael Mann noted, we can't say for sure what impact climate change had on Haiyan because we only have one planet, and we're running a dangerous experiment with it. But it's important to ask the right questions when it comes to extreme events like Haiyan. Asking if global warming caused Haiyan is the wrong question.
Human-caused climate change makes the impacts of these storms and many other types of extreme weather worse. It fuels hurricanes such that we'll see superstorms like Haiyan more frequently in the future. Eventually we'll have to stop denying that reality and start doing something to address it, or these types of extreme weather events will become the new norm.