- Greenland ice sheet notes
- Faster Rise In Sea Level Predicted From Melting Gr...
- Climatologist Dr. Jason E. Box, Byrd Polar Researc...
- Bering Glacier Melting Faster Than Scientists Thou...
- Frozen Arctic floor has started to thaw and releas...
- Achim Brauer et al.: An abrupt wind shift in weste...
- Chien-Lu Ping et al.: High stocks of soil organic ...
- Walter, Chanton, Chapin III, Schuur, Zimov: Methan...
- 2008 Arctic Sea ice loss as point of no return
- Geert Lenderink & Erik van Meijgaard: Increase in...
- NSIDC: Arctic sea ice now second-lowest on record...
- Arctic Tundra Holds Global Warming Time Bomb
- Heavy Rain Triggers Destructive Tornadoes
- Air Circulates Above The Earth In Four Distinct Ce...
- NOAA: Fifth Warmest July on Record for Globe
- Fewer April Showers for U.S. Southwest as Climate ...
- U.S. Court of Appeals rejects E.P.A. limits on emi...
- 9 Polar Bears Spotted on Risky Open Ocean Swims
- Expansion of oxygen-minimum zones in the oceans
- Jeremy B. C. Jackson: Ecological extinction and e...
- Scripps scientist Jeremy Jackson warns of mass ext...
- Bob Tisdale on the Thermohaline Circulation and SS...
- 'Clock ticking' on global warming: UN climate chie...
- At top of Greenland, new worrisome cracks in ice
- Northern Greenland's Petermann Glacier front break...
- APA psychologists rally to fight climate change fa...
- Peak temps may rise twice as fast as average temps...
- Jakobshavn Glacier Retreats to New Minimum
- Zager and Evans: "In the Year 2525"
- Parts of British coast may be "abandoned to the se...
- Global Temperatures of the Last Five Centuries
- James Hansen: "We need politicians with the guts t...
- Atmospheric Scientists Map Pollution Decrease
- Climate Change Threatens One In Five Plant Species...
- Climate Changes Creating Green And Flowering Mount...
- George Monbiot: A Sudden Change of State
- India Goes Mega-Solar
- Climate Change Caused Widespread Tree Death In Cal...
- Bush Aims to Gut Endangered Species Rules, Cut Inp...
- NASA Study Improves Ability to Predict Aerosols' E...
- Michael Le Page: Climate myths -- Global warming ...
- Climate change: The next ten years, by Fred Pearce...
- Ocean 'dead zones' becoming global problem
- JPL: Slowdown of North Atlantic sub-polar gyre fo...
- WAIS: Short-Term Spikes, Long-Term Warming Linked ...
- NSIDC: Arctic Sea ice decline accelerates, Amundse...
- Thomas L. Friedman: Flush with Energy
- UPDATE: Arctic Sea ice well on its way to disappea...
- Roger Pielke, Jr.: NCAR's NSF Budget -- The Real F...
- Roger Pielke, Jr.'s take on the budget cuts at NCA...
- Arctic meltdown is speeding up
- NASA's GISS-TEMP Surface Temperature Analysis Meth...
- Satellites help explain Greenland ice loss mystery...
- Prepare for global temperature rise of 4C, warns t...
- George Monbiot: Stopping Coal -- Everything Hinges...
- Some African Drought Linked To Warmer Indian Ocean...
- Andrew Revkin: Dismay over cuts at Michael Glantz'...
- Andrew Revkin: Tropical Warming Tied to Flooding R...
- Allan and Soden: Atmospheric Warming and the Ampli...
- Warming causing more extreme rainfall events
- Andrew H. MacDougall et al.: Quantification of sub...
- Thomas L. Friedman: Learning to Speak Climate
- Wind Farms in Nebraska by Dan Barry
- Younger Dryas deep freeze came about in just a sin...
- NASA: Planetary Waves Break Ozone Holes
- Jürgen Hubert: More Monckton Manipulations
- Fyfe and Saenko: Role of Poleward-Intensifying Win...
- Global warming speeding up planetary ocean waves
- Thomas L. Friedman: The Iceman Cometh
- Greenhouse Earth 40 million years ago with little ...
Sunday, August 31, 2008
A list of posts from August
August 2008 posts:
Greenland ice sheet notes
Science, 9 May 1997, Vol. 276, No. 5314, pp. 934–937 |
Reports
North and Northeast Greenland Ice Discharge from Satellite Radar Interferometry
Ice discharge from north and northeast Greenland calculated from satellite radar interferometry data of 14 outlet glaciers is 3.5 times that estimated from iceberg production. The satellite estimates, obtained at the grounding line of the outlet glaciers, differ from those obtained at the glacier front, because basal melting is extensive at the underside of the floating glacier sections. The results suggest that the north and northeast parts of the Greenland ice sheet may be thinning and contributing positively to sea-level rise.
* To whom correspondence should be addressed. e-mail: eric@adelie.jpl.nasa.gov
Link to abstract: http://www.sciencemag.org/cgi/content/abstract/276/5314/934
_________________________________________________________________
Science, 17 February 2006, Vol. 311, No. 5763, pp. 986–990 |
Reports
Changes in the Velocity Structure of the Greenland Ice Sheet
Using satellite radar interferometry observations of Greenland, we detected widespread glacier acceleration below 66° north between 1996 and 2000, which rapidly expanded to 70° north in 2005. Accelerated ice discharge in the west and particularly in the east doubled the ice sheet mass deficit in the last decade from 90 to 220 cubic kilometers per year. As more glaciers accelerate farther north, the contribution of Greenland to sea-level rise will continue to increase.
1 Jet Propulsion Laboratory, California Institute of Technology, Mail Stop 300-319, Pasadena, CA 91109–8099, U.S.A.
2 Center for Remote Sensing of Ice Sheets (CReSIS), University of Kansas, Lawrence, KS 66045, U.S.A.
* To whom correspondence should be addressed. e-mail: eric.rignot@jpl.nasa.gov (E.R), pannir@ku.edu (P.K.)
_________________________________________________________________
Science, 20 June 2008, Vol. 320, No. 5883, pp. 1622–1625 |
Reports
Natural Variability of Greenland Climate, Vegetation, and Ice Volume During the Past Million Years
The response of the Greenland ice sheet to global warming is a source of concern notably because of its potential contribution to changes in the sea level. We demonstrated the natural vulnerability of the ice sheet by using pollen records from marine sediment off southwest Greenland that indicate important changes of the vegetation in Greenland over the past million years. The vegetation that developed over southern Greenland during the last interglacial period is consistent with model experiments, suggesting a reduced volume of the Greenland ice sheet. Abundant spruce pollen indicates that boreal coniferous forest developed some 400,000 years ago during the "warm" interval of marine isotope stage 11, providing a time frame for the development and decline of boreal ecosystems over a nearly ice-free Greenland.
1GEOTOP Geochemistry and Geodynamics Research Center–Université du Québec à Montréal, Case Postale 8888, succursale Centre-Ville, Montréal, Québec H3C 3P8, Canada.
* To whom correspondence should be addressed. e-mail: devernal.anne@uqam.caLink to abstract: http://www.sciencemag.org/cgi/content/abstract/320/5883/1622
_________________________________________________________________
Faster Rise In Sea Level Predicted From Melting Greenland Ice Sheet, Based On Lessons From Ice Age
ScienceDaily (Aug. 31, 2008) — If the lessons being learned by scientists about the demise of the last great North American ice sheet are correct, estimates of global sea level rise from a melting Greenland ice sheet may be seriously underestimated.
Writing in the journal Nature Geoscience, a team of researchers led by University of Wisconsin-Madison geologist Anders Carlson reports that sea level rise from greenhouse-induced warming of the Greenland ice sheet could be double or triple current estimates over the next century.
"We're not talking about something catastrophic, but we could see a much bigger response in terms of sea level from the Greenland ice sheet over the next 100 years than what is currently predicted," says Carlson, a UW-Madison professor of geology and geophysics. Carlson worked with an international team of researchers, including Allegra LeGrande from the NASA Center for Climate Systems at Columbia University, and colleagues at the Woods Hole Oceanographic Institution, the California Institute of Technology, University of British Columbia and University of New Hampshire.
Scientists have yet to agree on how much melting of the Greenland ice sheet — a terrestrial ice mass encompassing 1.7 million sq. km — will contribute to changes in sea level. One reason, Carlson explains, is that in recorded history there is no precedent for the influence of climate change on a massive ice sheet.
"We've never seen an ice sheet disappear before, but here we have a record," says Carlson of the new study that combined a powerful computer model with marine and terrestrial records to provide a snapshot of how fast ice sheets can melt and raise sea level in a warmer world.
Carlson and his group were able to draw on the lessons of the disappearance of the Laurentide ice sheet, the last great ice mass to cover much of the northern hemisphere. The Laurentide ice sheet, which encompassed large parts of what are now Canada and the United States, began to melt about 10,000 years ago in response to increased solar radiation in the northern hemisphere due to a cyclic change in the orientation of the Earth's axis. It experienced two rapid pulses of melting — one 9,000 years ago and another 7,600 years ago — that caused global sea level to rise by more than half an inch per year.
Those pulses of melting, according to the new study, occurred when summer air temperatures were similar to what are predicted for Greenland by the end of this century, a finding the suggests estimates of global sea level rise due to a warming world climate may be seriously underestimated.
The most recent estimates of sea level rise due to melting of the Greenland ice sheet by the Intergovernmental Panel on Climate Change (IPCC) suggest a maximum sea level rise during the next 100 years of about 1 to 4 inches. That estimate, Carlson and his colleagues note, is based on limited data, mostly from the last decade, and contrasts sharply with results from computer models of future climate, casting doubt on current estimates of change in sea level due to melting ice sheets.
According to the new study, rising sea levels up to 1/3 inch per year (or 1-2 feet over the course of a century) are possible.
Even slight rises in global sea level are problematic as a significant percentage of the world's human population — hundreds of millions of people — lives in areas that can be affected by rising seas.
"For planning purposes, we should see the IPCC projections as conservative," Carlson says. "We think this is a very low estimate of what the Greenland ice sheet will contribute to sea level."
The authors of the new Nature Geoscience report were able to document the retreat of the Laurentide ice sheet and its contributions to changes in sea level by measuring how long rocks once covered by ice have been exposed to cosmic radiation, estimates of ice retreat based on radiocarbon dates from organic material as well as changes in ocean salinity.
In addition to Carlson and LeGrande, co-authors of the study, which was funded primarily by the National Science Foundation, are Gavin A. Schmidt of Columbia University, Delia W. Oppo of the Woods Hole Oceanographic Institution, Rosemarie E. Came of the California Institute of Technology, Faron S. Anslow of the University of British Columbia, Joseph M. Licciardi of the University of New Hampshire, and Elizabeth A. Obbink of UW-Madison.
Journal reference:
- Anders Carlson et al. Rapid early Holocene deglaciation of the Laurentide ice sheet. Nature Geoscience, August 31, 2008
Adapted from materials provided by University of Wisconsin-Madison, via EurekAlert!, a service of AAAS.
Link to article: http://www.sciencedaily.com/releases/2008/08/080831151346.htm
Link to article: http://www.sciencedaily.com/releases/2008/08/080831151346.htm
Saturday, August 30, 2008
Climatologist Dr. Jason E. Box, Byrd Polar Research Center, to give talk on Greenland ice sheet melt
Greenland: Climate Change’s Hot Topic
Aug 29, 2008 | 128 views | 0  | 0
| 0  |
|  |
| 
| 
TELLURIDE – Greenland is melting much faster than anyone predicted. This Arctic country, a Climate Change Indicator, is a vital player not just in our understanding and monitoring of climate change. It has a direct influence in how such changes will manifest across the globe.
For those of us in Colorado, what does this rapid, accelerated decrease in the Greenland Continental Icecap mean?
Climatologist Jason E. Box, Ph.D., with the Byrd Polar Research Center, has spent the last 14 years monitoring Greenland’s massive ablation.
Box will be coming to Telluride to present his research, and answer questions, on Sept. 4, at 7 p.m. at the Sheridan Opera House. The event is sponsored by the Telluride Institute, and is free and open to the public.
After 17 expeditions in Greenland, Box has documented some of the most startling ablation events, including the largest iceberg calving ever filmed: Eight square kilometers of ice, a half-mile thick, disintegrating in 90 minutes. Picture a city of skyscraper-sized ice vanishing in an hour-and-a-half.
“Estimates of sea level rise are now known to be significantly underestimated,” said Box. “The IPCC [Intergovernmental Panel on Climate Change] projected sea level rise of around one-and-a-half feet. But this did not take into account the profound ice sheet sensitivity now documented [in Greenland]. Sea level rise could be double, or more [than these predictions]. My best guess is a sea level rise of between three and six feet by the end of this century.”
This will have implications for global populations during our lifetimes. Coastal populations will have to move from low-lying areas, creating sociopolitical turmoil in countries like Bangladesh – one of the most populous, poorest and low-lying countries in the world. Parts of Florida could disappear.
Box sees a vast expenditure on a global scale to “hold back the sea.”
“We will end up spending a lot of money building a lot of flood breakers and sea walls,” he said in a telephone interview Wednesday. “I’m concerned the cost that the U.S. and the world will spend on mitigating sea level rise will slow down global economies. Technology exists to hold back the sea, but it’s very expensive. We need to act now to prevent sea level rise.”
In 2002, monitoring of the Greenland Icecap showed annual losses of 100 cubic kilometers of ice, alarming the scientific community, a bigger and faster loss than had been predicted.
In 2007, however, an even larger ice loss – of more than 300 cubic kilometers (300 gigatons) – was documented.
This is hugely significant for the world at large. No one really knows what will happen as a result – from fresh water plumes altering the Atlantic Ocean’s great gyres (which keep Europe temperate), to dramatic sea level rise. Last year the Intergovernmental Panel on Climate Change predicted an expected sea level rise of two feet over the course of this century. That’s significant enough to inundate areas like Washington, D.C., much of North Carolina, parts of the Gulf Coast, and Florida. It will alter global coastlines like never before. But this may be a low estimate: Even the IPCC noted in its important study last year that, “Larger values [in sea-level rise] cannot be excluded.”
Although Colorado doesn’t have to worry about the direct effects of rising sea levels, the economic ramifications will surely affect us all. Moreover, the warming inherent in climate change, while increasing precipitation events, will only shorten the ski season. Some estimates have quoted a reduction in the ski season by as much as one-third or more. In a state whose majority of revenues come from winter sports, that’s a lot of lost revenue – potentially one third of the winter take, or more than one-sixth of statewide annual revenue.
A further problem may result in the release of CO2 and methane from thawing permafrost regions, creating what is known as runaway climate heating, a positive-feedback loop that spirals climate crisis out of control.
“Melt down in the Artic will likely release a lot of carbon in permafrost in northern Eurasia and Canada and carbon in methane hydrates,” Box said. “This could contribute to runaway climate heating. We could double atmospheric CO2 in one- or two-hundred years. Then, it’s too late. This is the doomsday scenario, but we’re right on course for that. We have to change course now.”
Box noted that a panoply of strategies must be enacted to be effective to preempt runaway climate heating. Conservation, he said, is not enough. A systems approach that involves renewable energy, reforestation, geo-engineering, as well as conservation is needed.
“Conservation is not going to come close to the type of action we need to avert disaster. Conservation at best buys us some time. We need a proactive, portfolio response,” he said, including wind, solar and geothermal energy systems acting together to augment mitigation.
“Science has been looking for a silver bullet to address the climate crisis. But what we need is silver buckshot.”
His presentation Sept. 4 at the Opera House will be full of satellite images, time-lapse photography and graphic products. This is a world first: much of this imagery has yet to be published or released to the public.
Box has been featured in the New York Times, on CBS News, NBC’s Today Show, and the Discovery Channel, among others. This February 60 Minutes will be flying to Greenland with Box to film a special on climate change.
He will show footage of his research, outline repercussions across the world, answer questions, and offer some potential solutions to deal with an accelerating problem, now more evident than ever.
Link to article: http://www.telluridewatch.com/pages/full_story?article-Greenland-Climate-Change-s-Hot-Topic
Friday, August 29, 2008
Bering Glacier Melting Faster Than Scientists Thought
18.08.2008
The glacier is releasing approximately 30 cubic kilometers of water a year, more than twice the amount of water in the entire Colorado River, said Robert Shuchman, co-director of the Michigan Tech Research Institute (MTRI).
A new technology for measuring glacial water melt reveals that the Bering Glacier is melting at twice the rate that scientists believed.
A new system of measuring water melt shows that the Bering Glacier--the largest glacier in North America--is melting at double the rate that scientists thought.The glacier is releasing approximately 30 cubic kilometers of water a year, more than twice the amount of water in the entire Colorado River, said Robert Shuchman, co-director of the Michigan Tech Research Institute (MTRI).
"This could potentially change the circulation of coastal currents in the Gulf of Alaska," Shuchman said. Those currents are key factors in tempering climate, redistributing nutrients in the water and providing adequate food for the salmon and marine animals, he explained.
As glaciers melt, sea levels rise, and "sea level rise affects everyone," Shuchman added. "If it continues to rise at this rate, parts of the state of Florida could be under water at the turn of the next century."
The MTRI team, working with U.S. Geological Survey (USGS) and U.S. Bureau of Land Management (BLM) scientists, designed the sensor that enabled BLM to accurately measure and analyze the melting of this Alaskan glacier. Shuchman and his team, along with BLM and USGS, have been studying the glacier for the past decade with an interdisciplinary team of geologists, oceanographers, botanists, and marine mammal, bird and fish experts.
"Our glacier observations are 10 times better and 10 times less costly than data collected the old way," Shuchman said. Before MTRI developed its autonomous sensor to collect data as it occurs, scientists had to make dangerous and difficult treks to remote regions to measure glacial melting.
Jennifer Donovan | Source: Newswise Science News
Further information: www.mtu.edu
Thursday, August 28, 2008
Frozen Arctic floor has started to thaw and release long-stored methane gas
Frozen Arctic floor has started to thaw and release long-stored methane gas
By Volker Mrasek, Spiegel, 17 avril 2008
Researchers have found alarming evidence that the frozen Arctic floor has started to thaw and release long-stored methane gas. The results could be a catastrophic warming of the earth, since methane is a far more potent greenhouse gas than carbon dioxide. But can the methane also be used as fuel ?
It’s always been a disturbing what-if scenario for climate researchers : Gas hydrates stored in the Arctic ocean floor — hard clumps of ice and methane, conserved by freezing temperatures and high pressure — could grow unstable and release massive amounts of methane into the atmosphere. Since methane is a potent greenhouse gas, more worrisome than carbon dioxide, the result would be a drastic acceleration of global warming. Until now this idea was mostly academic ; scientists had warned that such a thing could happen. Now it seems more likely that it will.
Russian polar scientists have strong evidence that the first stages of melting are underway. They’ve studied largest shelf sea in the world, off the coast of Siberia, where the Asian continental shelf stretches across an underwater area six times the size of Germany, before falling off gently into the Arctic Ocean. The scientists are presenting their data from this remote, thinly-investigated region at the annual conference of the European Geosciences Union this week in Vienna.
In the permafrost bottom of the 200-meter-deep sea, enormous stores of gas hydrates lie dormant in mighty frozen layers of sediment. The carbon content of the ice-and-methane mixture here is estimated at 540 billion tons. “This submarine hydrate was considered stable until now,” says the Russian biogeochemist Natalia Shakhova, currently a guest scientist at the University of Alaska in Fairbanks who is also a member of the Pacific Institute of Geography at the Russian Academy of Sciences in Vladivostok.
The permafrost has grown porous, says Shakhova, and already the shelf sea has become “a source of methane passing into the atmosphere.” The Russian scientists have estimated what might happen when this Siberian permafrost-seal thaws completely and all the stored gas escapes. They believe the methane content of the planet’s atmosphere would increase twelvefold. “The result would be catastrophic global warming,” say the scientists. The greenhouse-gas potential of methane is 20 times that of carbon dioxide, as measured by the effects of a single molecule.
Shakhova and her colleagues gathered evidence for the loss of rigor in the frozen sea floor in a measuring campaign during the Siberian summer. The seawater proved to be “highly oversaturated with solute methane,” reports Shakhova. In the air over the sea, greenhouse-gas content was measured in some places at five times normal values. “In helicopter flights over the delta of the Lena River, higher methane concentrations have been measured at altitudes as high as 1,800 meters,” she says.
The methane climate bomb is also ticking on land : A few years ago researchers noticed higher concentrations of methane in northern Siberia. The Siberian permafrost is known as one of the tipping points for the earth’s climate, since the potent greenhouse gas develops wherever microorganisms decompose the huge masses of organic material from warmer eras that has been frozen here for thousands of years.
“A Wake-Up Call for Science”
Data from offshore drilling in the region, studied by experts at the Alfred Wegener Institute for Polar and Marine Research (AWI), also suggest that the situation has grown critical. AWI’s results show that permafrost in the flat shelf is perilously close to thawing. Three to 12 kilometers from the coast, the temperature of sea sediment was -1 to -1.5 degrees Celsius, just below freezing. Permafrost on land, though, was as cold as -12.4 degrees Celsius. “That’s a drastic difference and the best proof of a critical thermal status of the submarine permafrost,” said Shakhova.
Paul Overduin, a geophysicist at AWI, agreed. “She’s right,” he said. “Changes are far more likely to occur on the sea shelf than on land.”
Climate change could give an additional push to these trends. “If the Arctic Sea ice continues to recede and the shelf becomes ice-free for extended periods, then the water in these flat areas will get much warmer,” said Overduin. That could lead to a situation in which the temperature of the sea sediment rises above freezing, which would thaw the permafrost.
“We don’t have any data on that — those are just suspicions,” the Canadian scientist said. Natalia Shakhova also passed on the question of whether to expect a gradual gas emission or an abrupt burst of large quantities of methane. “No one can say right now whether that will take years, decades or hundreds of years,” she said. But one cannot rule out sudden methane emissions. They could happen at “any time.”
One thing is clear, though : The thawing of the Arctic sea floor will create “new potential sources for methane … which no one had reckoned with until now,” said Laurence Smith, a professor for geography at the University of California in Los Angeles. Smith is researching North Pole frost zones and expects that a thawing of the permafrost will “supply fuel for methane engines.”
The first methane rocket thruster was tested by the US’s National Aeronautics and Space Administration (NASA) in 2007, and methane from manure has been collected as “biogas” to heat and power homes (more…) in experimental German towns.
In any case, the team taking part in the Siberian study installed a number of probes in the Laptev Sea, a central part of the broad Siberian shelf sea. These probes are measuring the temperature on the upper edge of the submarine permafrost. Overduin wants to pull up the probes in August. Then, for the first time, scientists will have access to a full year’s worth of data on the conditions of the sea floor.
For her part, Shakhova thinks researchers should be doing a lot more. She says too little is known about the fragile shelf sediment and the methane it stores, which could be explosive for the environment. “Actually,” she says, “this is a wake-up call for science.”
Achim Brauer et al.: An abrupt wind shift in western Europe at the onset of the Younger Dryas cold period
Letter abstract
Nature Geoscience 1, 520-523 (2008)
Published online: 1 August 2008 | doi:10.1038/ngeo263
An abrupt wind shift in western Europe at the onset of the Younger Dryas cold period
Achim Brauer1, Gerald H. Haug2,3, Peter Dulski1, Daniel M. Sigman4 & Jörg F. W. Negendank1
The Younger Dryas cooling 12,700 years ago is one of the most abrupt climate changes observed in Northern Hemisphere palaeoclimate records1, 2, 3, 4. Annually laminated lake sediments are ideally suited to record the dynamics of such abrupt changes, as the seasonal deposition responds immediately to climate, and the varve counts provide an accurate estimate of the timing of the change. Here, we present sub-annual records of varve microfacies and geochemistry from Lake Meerfelder Maar in western Germany, providing one of the best dated records of this climate transition5. Our data indicate an abrupt increase in storminess during the autumn to spring seasons, occurring from one year to the next at 12,679 yr BP, broadly coincident with other changes in this region. We suggest that this shift in wind strength represents an abrupt change in the North Atlantic westerlies towards a stronger and more zonal jet. Changes in meridional overturning circulation alone cannot fully explain the changes in European climate6, 7; we suggest the observed wind shift provides the mechanism for the strong temporal link between North Atlantic Ocean overturning circulation and European climate during deglaciation.
- GFZ German Research Centre for Geosciences, Telegrafenberg, D-14473 Potsdam, Germany
- Geological Institute, Department of Earth Sciences, ETH Zürich, 8092 Zürich, Switzerland
- DFG-Leibniz Center for Surface Process and Climate Studies, Institute for Geosciences, Potsdam University, 14476 Potsdam, Germany
- Department of Geosciences, Princeton University, Princeton, New Jersey 08544, USA
Correspondence to: Achim Brauer1 e-mail: brau@gfz-potsdam.de
Chien-Lu Ping et al.: High stocks of soil organic carbon in the North American Arctic region
Nature Geoscience
Published online: 24 August 2008 | doi:10.1038/ngeo284
High stocks of soil organic carbon in the North American Arctic region
Chien-Lu Ping1, Gary J. Michaelson1, Mark T. Jorgenson2, John M. Kimble3, Howard Epstein4, Vladimir E. Romanovsky5 & Donald A. Walker6
Abstract
The Arctic soil organic-carbon pool is a significant, but poorly constrained, carbon store. The most cited pool size estimates are based on a study that severely undersamples Arctic soils, with only five out of the 48 soils examined actually from the Arctic region. Furthermore, previous measurements have been confined to the top 40 cm of soil. Here, we present 1-m-deep measurements of soil organic carbon obtained at 117 locations in the North American Arctic region. To this dataset we add previously published measurements to generate a total sample size of 139 North American Arctic soils. We show that soil organic-carbon stores are highly dependent on landscape type, being highest in lowland and hilly upland soils, where values average 55.1 and 40.6 kg soil organic carbon m-2 respectively, and lowest in rubbleland and mountain soils, where values average 3.4 and 3.8 kg soil organic carbon m-2, respectively. Extrapolating our measurements using known distributions of landscape types we estimate that the total organic carbon pool in North American Arctic soils, together with the average amount of carbon per unit area, is considerably higher than previously thought. Our estimates of the depth distribution and total amount of organic carbon in North American Arctic soils will form an important basis for studies examining the impact of climate warming on CO2 release in the region.
- Agriculture and Forestry Experiment Station, University of Alaska Fairbanks, 533 E. Fireweed, Palmer, Alaska 99645, USA
- Alaska Biological Research, Box 80410, Fairbanks, Alaska 99708, USA
- Professional Soil Scientist, 151 East Hill Church Road, Addison, New York 14801, USA
- Department of Environmental Sciences, University of Virginia, PO Box 400123, Charlottesville, Virginia 22904, USA
- Geophysical Institute, University of Alaska Fairbanks, PO Box 755780, Fairbanks, Alaska 99775, USA
- Institute of Arctic Biology, University of Alaska Fairbanks, PO Box 757000, Fairbanks, Alaska 99775, USA
Correspondence to: Chien-Lu Ping1 e-mail: ffcp@uaf.edu
Walter, Chanton, Chapin III, Schuur, Zimov: Methane production and bubble emissions from arctic lakes: Isotopic implications for source pathways, ages
Journal of Geophysical Research, Vol. 113, 2008, G00A08; doi:10.1029/2007JG000569
Methane production and bubble emissions from arctic lakes: Isotopic implications for source pathways and ages
K. M. Walter (Institute of Northern Engineering and International Arctic Research Center, University of Alaska Fairbanks, Fairbanks, Alaska, U.S.A.)
F. S. Chapin III (Institute of Arctic Biology, University of Alaska Fairbanks, Fairbanks, Alaska, USA)
E. A. G. Schuur (Department of Botany, University of Florida, Gainesville, Florida, USA)
S. A. Zimov (Northeast Science Station, Cherskii, Republic of Sakha, Russia)
Abstract
This study reports an atmospheric methane (CH4) source term previously uncharacterized regarding strength and isotopic composition. Methane emissions from 14 Siberian lakes and 9 Alaskan lakes were characterized using stable isotopes (13C and D) and radiocarbon (14C) analyses. We classified ebullition (bubbling) into three categories (background, point sources, and hot spots) on the basis of fluxes, major gas concentrations, and isotopic composition. Point sources and hot spots had a strong association with thermokarst (thaw) erosion because permafrost degradation along lake margins releases ancient organic matter into anaerobic lake bottoms, fueling methanogenesis. With increasing ebullition rate, we observed increasing CH4 concentration of greater radiocarbon age, depletion of 13CCH4, and decreasing bubble N2 content. Microbial oxidation of methane was observed in bubbles that became trapped below and later within winter lake ice; however, oxidation appeared insignificant in bubbles sampled immediately after release from sediments. Methanogenic pathways differed among the bubble sources: CO2 reduction supported point source and hot spot ebullition to a large degree, while acetate fermentation appeared to contribute to background bubbling. To provide annual whole-lake and regional CH4 isofluxes for the Siberian lakes, we combined maps of bubble source distributions with long-term, continuous flux measurements and isotopic composition. In contrast to typical values used in inverse models of atmospheric CH4 for northern wetland sources (δ 13CCH4 = −58‰, 14C age modern), which have not included northern lake ebullition as a source, we show that this large, new source of high-latitude CH4 from lakes is isotopically distinct (δ 13CCH4 = −70‰, 14C age 16,500 years, for North Siberian lakes).
(Received 9 August 2007; accepted 11 April 2008; published 2 August 2008.)
Key words: arctic lakes, methane, ebullition, isotopes, thermokarst
Index Terms: 0490 Biogeosciences: Trace gases; 0454 Biogeosciences: Isotopic composition and chemistry (1041, 4870); 0428 Biogeosciences: Carbon cycling (4806); 0458 Biogeosciences: Limnology (1845, 4239, 4942); 0708 Cryosphere: Thermokarst.
Read Full Article (file size: 1284938 bytes) Cited by
Citation: (2008), Methane production and bubble emissions from arctic lakes: Isotopic implications for source pathways and ages, J. Geophys. Res., 113, G00A08, doi:10.1029/2007JG000569.
2008 Arctic Sea ice loss as point of no return
WASHINGTON (AP) — The National Snow and Ice Data Center has reported that sea ice in the Arctic now covers about 2.03 million square miles. The lowest point since satellite measurements began in 1979 was 1.65 million square miles, last September.
With about three weeks left in the Arctic summer, this year could wind up breaking that record, scientists said.
Arctic ice always melts in summer and refreezes in winter. But over the years, more of the ice is lost to the sea with less of it recovered in winter. While ice reflects the sun’s heat, the open ocean absorbs more heat, and the melting accelerates warming in other parts of the world.
Sea ice also serves as primary habitat for threatened polar bears.
“We could very well be in that quick slide downward in terms of passing a tipping point,” said Mark Serreze, a senior scientist at the data center, in Boulder, Colo. “It’s tipping now. We’re seeing it happen now.”
Five climate scientists, four of them specialists on the Arctic, told The Associated Press that it was fair to call what was happening in the Arctic a “tipping point.”
Last year was an unusual year when wind currents and other weather conditions coincided with global warming to worsen sea ice melt, Dr. Serreze said. Scientists wondered if last year was an unusual event or the start of a new and disturbing trend.
This year’s results suggest the latter because the ice had recovered a bit more than usual thanks to a somewhat cooler winter, Dr. Serreze said. Then this month, when the melting rate usually slows, it sped up instead, he said.
The most recent ice retreat primarily reflects melt in the Chukchi Sea, off Alaska’s northwest coast, and the East Siberian Sea, off the coast of eastern Russia, according to the center.
The Chukchi Sea is home to one of two populations of Alaska polar bears.
Federal observers flying for a whale survey on Aug. 16 spotted nine polar bears swimming in open ocean in the Chukchi. The bears were 15 to 65 miles off the Alaska shore. Some were swimming north, apparently trying to reach the polar ice edge, which on that day was 400 miles away.
Polar bears are powerful swimmers and have been recorded on swims of 100 miles, but the ordeal can leave them exhausted and susceptible to drowning.
And the melt in sea ice has kicked in another effect, long predicted, called “Arctic amplification,” Dr. Serreze said.
That is when the warming up north is increased in a feedback mechanism and the effects spill southward starting in autumn, Dr. Serreze said. Over the last few years, the bigger melt has meant more warm water that releases more heat into the air during fall cooling, making the atmosphere warmer than normal.
On top of that, researchers are investigating “alarming” reports in the last few days of the release of methane from long-frozen Arctic waters, possibly from the warming of the sea, said Bill Hare, a Greenpeace climate scientist, who was attending a climate conference in Ghana. Giant burps of methane, which is a potent greenhouse gas, is a long-feared effect of warming in the Arctic that would accelerate warming even more, according to scientists.
Over all, the picture of what is happening in the Arctic is getting worse, said Bob Corell, who headed a multinational scientific assessment of Arctic conditions a few years ago. “We’re moving,” he said, “beyond a point of no return.”
Link to article: http://www.nytimes.com/2008/08/28/science/earth/28seaice.html
Tuesday, August 26, 2008
Geert Lenderink & Erik van Meijgaard: Increase in hourly precipitation extremes beyond expectations from temperature changes
Letter abstract
Nature Geoscience 1, 511–514 (2008)
Published online: 20 July 2008 | doi:10.1038/ngeo262
Subject Categories: Atmospheric science | Climate science | Hydrology, hydrogeology and limnology
Increase in hourly precipitation extremes beyond expectations from temperature changes
Geert Lenderink & Erik van Meijgaard
Changes in precipitation extremes under greenhouse warming are commonly assumed to be constrained by changes in the amounts of precipitable water in the atmosphere1, 2, 3, 4. Global climate models generally predict only marginal changes in relative humidity5, implying that the actual amount of atmospheric precipitable water scales with the water vapour content of saturation, which is governed by the Clausius–Clapeyron relation. Indeed, changes in daily precipitation extremes in global climate models seem to be consistent with the 7% increase per degree of warming given by the Clausius–Clapeyron relation3, 4, but it is uncertain how general this scaling behaviour is across timescales. Here, we analyse a 99-year record of hourly precipitation observations from De Bilt, the Netherlands, and find that one-hour precipitation extremes increase twice as fast with rising temperatures as expected from the Clausius–Clapeyron relation when daily mean temperatures exceed 12 °C. In addition, simulations with a high-resolution regional climate model show that one-hour precipitation extremes increase at a rate close to 14% per degree of warming in large parts of Europe. Our results demonstrate that changes in short-duration precipitation extremes may well exceed expectations from the Clausius–Clapeyron relation. These short-duration extreme events can have significant impacts, such as local flooding, erosion and water damage.
- Royal Netherlands Meteorological Institute (KNMI), 3730 AE De Bilt, The Netherlands
Correspondence: Geert Lenderink e-mail: lenderin@knmi.nl
Link to abstract: http://www.nature.com/ngeo/journal/v1/n8/abs/ngeo262.htmlNSIDC: Arctic sea ice now second-lowest on record
From the National Snow and Ice Data Center, August 26, 2008
Sea ice extent has fallen below the 2005 minimum, previously the second-lowest extent recorded since the dawn of the satellite era. Will 2008 also break the standing record low, set in 2007? We will know in the next several weeks, when the melt season comes to a close. The bottom line, however, is that the strong negative trend in summertime ice extent characterizing the past decade continues.
Note: The NSIDC will issue an an update with finalized numbers tomorrow morning.
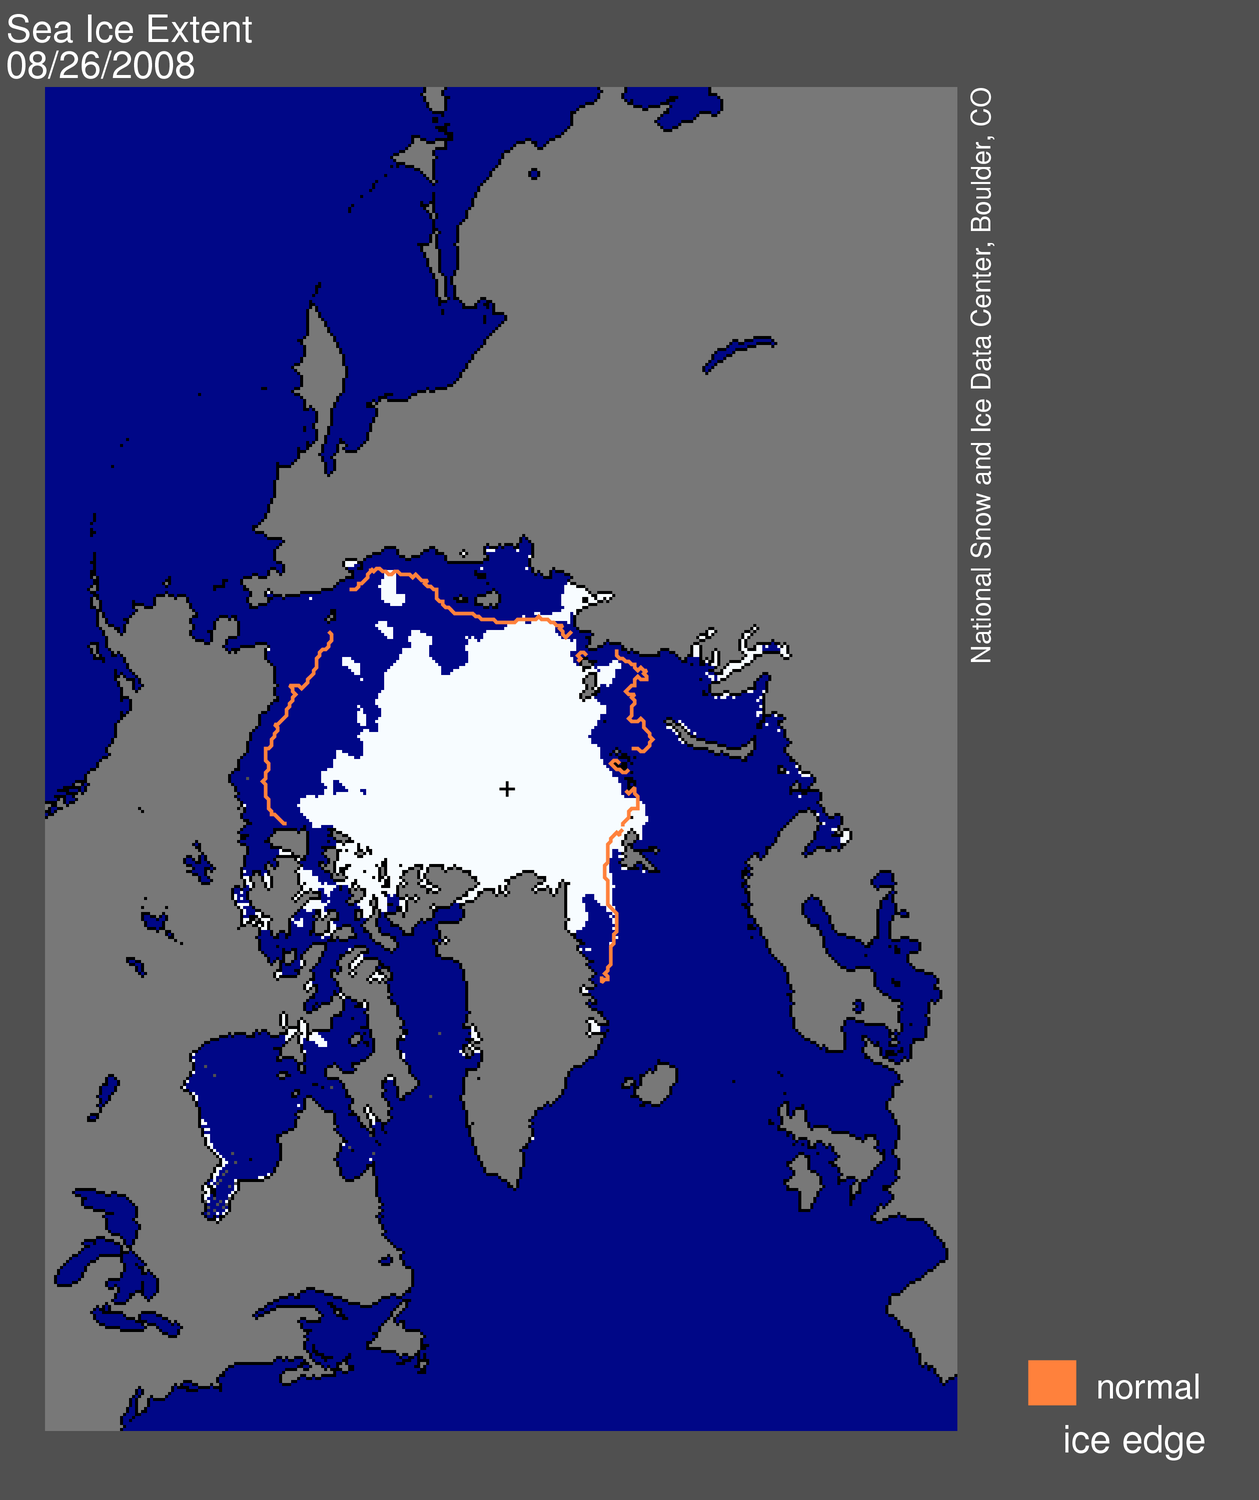
Figure 1. Daily Arctic sea ice extent for August 25, 2008, fell below the 2005 minimum, which was 5.32 million square kilometers (2.05 million square miles). The orange line shows the 1979 to 2000 average extent for that day. The black cross indicates the geographic North Pole. Sea Ice Index data. About the data. —Credit: National Snow and Ice Data Center.
Overview of conditions
With several weeks left in the melt season, sea ice extent dipped below the 2005 minimum to stand as the second-lowest in the satellite record. The 2005 minimum, at 5.32 million square kilometers (2.05 million square miles), held the record-low minimum until last year.
Recent ice retreat primarily reflects melt in the Chukchi Sea off the Alaskan coast and the East Siberian Seas off the coast of eastern Russia.
Note: The NSIDC will issue an update with finalized numbers tomorrow morning.
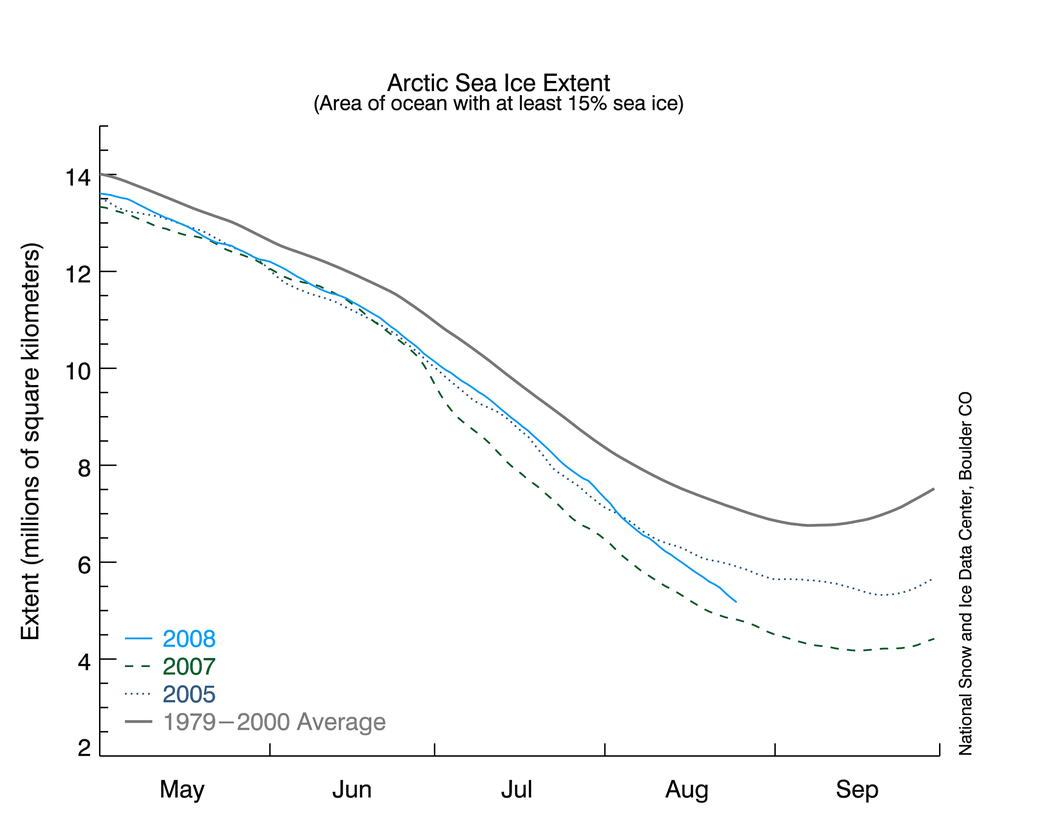 Figure 2. The graph above shows daily sea ice extent.The dashed blue line indicates 2008; the dark blue dotted line indicates 2005; the dotted green line shows extent for 2007; the gray line indicates average extent from 1979 to 2000. Sea Ice Index data. —Credit: National Snow and Ice Data Center.
High-resolution image
Conditions in context
Through the beginning of the melt season in May until early August, daily ice extent for 2008 closely tracked the values for 2005.
In early August of 2005, the decline began to slow; in August of 2008, the decline has remained steadily downward at a brisk pace. The 2005 minimum of 5.32 million square kilometers (2.05 million square miles) occurred on September 21.
Link: http://nsidc.org/arcticseaicenews/
Arctic Tundra Holds Global Warming Time Bomb
by Michael Reilly, Discovery News, August 25, 2008
Aug. 25, 2008 -- Locked away in the frozen soils of the Arctic tundra, there lies a ticking time bomb.
Nothing more than accumulated leaves, roots and other plant matter, the unassuming detritus is rich in carbon, giving it the power to dramatically enhance the effects of global warming should it ever get into the atmosphere. But for now it mostly lies dormant, in cold storage in the permafrosts of Siberia, Alaska, and Canada.
That's starting to change, according to some scientists. The planet has already begun to warm as a result of humans pumping billions of tons of carbon into the atmosphere each year. The permafrost is starting to melt, and that pent-up carbon is already leaking into the air in the form of carbon dioxide and methane, powerful greenhouse gases.
Even worse, there may be more of the stuff than anyone ever thought.
Chien-Liu Ping and a team of researchers at the University of Alaska, Fairbanks spent the last 13 years meticulously sampling tundra soils across North America. In a study published this week in the journal Nature Geoscience, they estimate there may be almost 100 billion tons of carbon in the first meter of soil alone.
That's equivalent to about a quarter of the amount currently in Earth's atmosphere, or 10 years' worth of global emissions from human activity.
It also nearly doubles previous estimates of carbon content in Arctic soil. Despite decades of work, such approximations are rough at best, because land in the far North is vast, remote, and inhospitably cold. Even in the height of summer, soil scientists can rarely dig deeper than 50 centimeters before they hit rock-solid permafrost.
But worst-case scenario climate projections from the Intergovernmental Panel on Climate Change (IPCC) suggest Arctic temperatures could climb as much as 6 degrees centigrade by the end of the century.
If that happens, the Arctic region, which has already shown signs of thawing, will change dramatically. Already scientists have begun seeing areas where permafrost tundra has melted into muddy bogs called 'thermokarsts.' In other places, steep hillsides, no longer supported by rigid ice crystals, are giving way in landslides.
As the land melts bacteria intrude, decomposing the plant matter that has built up over thousands of years. They release methane and carbon dioxide into the air as byproducts, gases that warm the planet by trapping heat energy from the sun.
"Permafrost temperatures in Alaska have gone up about 1 degree Centigrade over the last 50 years," Ping said, pushing soils to within a fraction of a degree of freezing temperature. "In Russia, they've been monitoring permafrost for over a century. It has warmed 2 degrees Centigrade, so almost 5 degrees Fahrenheit."
It's not all bad news though. The warmer temperatures should allow plants to grow vigorously, and they can suck up huge amounts of carbon out from the atmosphere through photosynthesis -- perhaps even enough to cancel out greenhouse gas emissions from the soil.
In fact, many scientists say the jury is still out on whether or not the thawing Arctic could quicken the pace of global warming.
"The carbon losses you have to have from soil to affect climate need to be fast and big," David McGuire of the University of Alaska, Fairbanks said. "There are two ways do that: mass erosion from slumping or along the coasts and rivers, and through fires."
Last year, McGuire, who was not involved with Ping's research, ran computer simulations of what would happen if catastrophe struck vast swaths of Arctic tundra in the form of wildfires and massive erosion.
"The most carbon we could get into the atmosphere was about 50 billion tons," he said, or about half of what Ping's team thinks is stored in the soil.
That's not enough to make much difference by the year 2100, but Ted Schuur of the University of Florida thinks we need to look further into the future.
In a paper to be published in the September issue of the journal Bioscience, he estimates that 1,672 billion tons of carbon are locked in Arctic permafrosts, much of it in Siberia. The carbon leak is slow -- he estimates it could only be as high as 1 billion tons each year worldwide, or about 10 percent of what is emitted today through human activity emissions. But over the next four centuries it could end up in the atmosphere, drastically altering Earth's climate.
"The Ping paper is great so far as it goes, but it's only dealing with this one zone: North America," Schuur said. "That's like describing what an elephant looks like by talking all about its foot. We're trying to describe the whole elephant."
If Schuur's estimate is right, Arctic soils harbor two to three times more carbon than is currently aloft in Earth's atmosphere. If it were to be released as greenhouse gases over the course of the next few centuries, the effect on the climate might not be noticeable by the year 2100. But by the year 2400 or 2500 it would be tremendous.
"Right now there's about 780 billion tons of carbon in the atmosphere. And now you say you're going to take and slowly put much of 1,600 billion tons from the soil up there. That's going to have a huge effect on the heat-trapping capacity of the Earth," Schuur said.
"Say you look at Earth in 500 years," he said. "It's probably going to be a very different place."
Link to article: http://dsc.discovery.com/news/2008/08/25/warming-arctic-tundra.html
Friday, August 22, 2008
Heavy Rain Triggers Destructive Tornadoes
by Michael Reilly, Discovery News, August 22, 2008
When the spring skies blacken over the Midwestern United States and the clouds begin to rotate ominously, residents know a tornado could be on its way.
But just how the deadly twisters form is a mystery that has puzzled scientists for decades. They know a range of atmospheric conditions must be in place, including strong, closely paired up- and downdrafts, windshear at high altitudes, and usually a foreboding supercell thunderstorm, spinning slowly in the sky.
Amid this stormy cocktail, new research suggests that the heavy rains that often accompany supercells may be key in triggering tornadoes to form. According to Robert Davies-Jones of the National Severe Storms Laboratory in Oklahoma, rain falling in heavy sheets from a supercell storm cloud provides a strong push to updrafting air, causing it to spin up into a fully fledged twister.
"You can have a rotating storm but until you have rain you don't get a tornado," Robert Davies-Jones of the National Severe Storm Laboratory said.
Scientists have known this simple fact since 1953, when radar first allowed meteorologists to peer into supercells. In tornadic storms, they noticed the rain swirled into a hook shape. The feature, called a 'hook echo' quickly became known as a tell-tale radar marker for a tornado.
But the swirling rain was regarded as a by-product of a tornado, merely the effect of its powerful corkscrewing winds. Davies-Jones believes the opposite may be true.
"The hook echo is usually thought to be a passive feature of tornadoes," he said. "I'm saying it's not passive, it's an active mechanism for tornado formation."
His work is published in the August issue of Journal of the Atmospheric Sciences.
Davies-Jones ran computer simulations of supercell storms to see if falling rain could provide the needed kick that turned diffuse updrafts rising off the warm plains into tight-spinning, lethal tornadoes. As the rain falls out of a rotating supercell cloud it is also twisting, and as it falls he found it transfers the rotational energy into the updrafting air adjacent to it.
The rain also acts as a sort of wall, confining the swirling, rising air. As it continues to head skyward the air inside the rain curtain stretches out like a figure skater raising her arms. The spinning speeds up, and a tornado is born.
"The mechanism is a good one," David Lewellen of the University of West Virginia said. "But until these things are seen more conclusively out in the field, it's not at all clear whether rain is involved in the formation of most tornadoes, a few, or none at all."
Lewellen points out that rain is only one of myriad weather conditions that have to be just right for a tornado to form. A massive field campaign of experiments is scheduled for the spring season in 2009 and 2010 that he hopes will determine if the implications in the models are correct.
Link to article: http://dsc.discovery.com/news/2008/08/22/tornado-rain.html
NOAA 2008 Monthly Tornado Statistics
| Number of Tornadoes | Number of Tornado Deaths | Killer Tornadoes | |||||||||||||||
|---|---|---|---|---|---|---|---|---|---|---|---|---|---|---|---|---|---|
| 2008 | 2007 | 2006 | 2005 | 3 Year Avg. | 2008 | 2007 | 2006 | 2005 | 3 Year Avg. | 2008 | 2007 | 2006 | 2005 | 3 Year Avg. | |||
| Prelim | Actual | Prelim | Actual | Final | Final | Prelim | Final | Final | Final | Prelim | Final | Final | Final | ||||
| JAN | 136 | 84 | 29 | 21 | 47 | 33 | 34 | 7 | 2 | 1 | 4 | 2 | 4 | 1 | 1 | 2 | 1 |
| FEB | 230 | 148 | 87 | 52 | 12 | 10 | 25 | 59 | 22 | 0 | 0 | 7 | 12 | 3 | 0 | 0 | 1 |
| MAR | 150 | 126 | 214 | 171 | 150 | 62 | 128 | 4 | 27 | 11 | 1 | 13 | 3 | 10 | 7 | 1 | 6 |
| APR | 189 | 189 | 187 | 165 | 245 | 132 | 181 | 0 | 9 | 38 | 0 | 16 | 0 | 3 | 9 | 0 | 4 |
| MAY | 597 | 460 | 282 | 250 | 139 | 123 | 171 | 43 | 14 | 3 | 0 | 6 | 10 | 4 | 1 | 0 | 2 |
| JUN | 394 | ? | 152 | 128 | 120 | 316 | 188 | 7 | 0 | 0 | 0 | 0 | 4 | 0 | 0 | 0 | 0 |
| JUL | 120 | ? | 55 | 69 | 71 | 138 | 93 | 1 | 0 | 0 | 0 | 0 | 1 | 0 | 0 | 0 | 0 |
| AUG | 59 | ? | 87 | 73 | 80 | 123 | 92 | ? | 1 | 1 | 4 | 2 | ? | 1 | 1 | 3 | 2 |
| SEP | ? | ? | 63 | 51 | 84 | 133 | 89 | ? | 0 | 1 | 1 | 1 | ? | 0 | 1 | 1 | 1 |
| OCT | ? | ? | 115 | 87 | 76 | 18 | 60 | ? | 5 | 0 | 0 | 2 | ? | 3 | 0 | 1 | 1 |
| NOV | ? | ? | 7 | 7 | 42 | 150 | 66 | ? | 0 | 10 | 28 | 13 | ? | 0 | 3 | 5 | 3 |
| DEC | ? | ? | 22 | 19 | 40 | 26 | 33 | ? | 1 | 2 | 0 | 1 | ? | 1 | 2 | 0 | 1 |
| Total | 1875 | 1007 | 1300 | 1093 | 1106 | 1264 | 1159 | 121 | 81 | 67 | 38 | 62 | 34 | 26 | 25 | 13 | 21 |
Note:? means final number not yet available.
Important! Prelim. numbers represent tornado reports. Columns marked Final represent total tornadoes.
2008 numbers updated through May.

Air Circulates Above The Earth In Four Distinct Cells
Air Circulates Above The Earth In Four Distinct Cells
From Live Science, submitted by News Staff on 21 August 2008 - 11:00am. AtmosphericAir circulates above the Earth in four distinct cells, with two either side of the equator, says new research out today in Science.
The new observational study describes how air rises and falls in the atmosphere above the Earth’s surface, creating the world’s weather. This process of atmospheric circulation creates weather patterns and influences the climate of the planet. It is important to understand these processes in order to predict weather events, and to improve and test climate models.
Previous theories have claimed that there are just two large circular systems of air in the atmosphere, one either side of the equator. These theories suggested that air rises at the equator and then travels towards either the north or south polar regions, where it falls.
The new research suggests instead that there are two cells in both the northern and southern hemispheres. In the first cell, air rises at the equator and then falls in the subtropics. In the second cell, air rises in the mid-latitudes - approximately 30 to 60 degrees north and south of the equator – and then falls in the polar regions.
The researchers say that this second cell of rising air is a mechanism responsible for setting the distribution of temperature and winds in the mid-latitudes which has not been fully appreciated before. The mid-latitudes include the UK, Europe and most of the United States.
Dr Arnaud Czaja from Imperial College London’s Department of Physics and the Grantham Institute for Climate Change, one of the authors of the new research, explains: “Our model suggests that there is a second cell of air in each hemisphere which is characterised by air rising, clouds forming, storms developing and other processes associated with moisture in the air occurring in the mid-latitudes.”
Current theories to describe weather patterns in the mid-latitudes do not take these moisture-based processes into consideration. Dr Czaja argues that these theories are therefore incomplete, and that water vapour plays as much of an important role in the weather systems of the mid-latitudes as it does in the tropics, where it is a well-documented driver of weather events.
The research team carried out their study by conducting new analyses of extensive meteorological data. Dr Czaja says that he hopes the research will lead to a more detailed understanding of how air circulation in our atmosphere works, and how it affects the weather:
“With more attention than ever before being focused on understanding our planet’s climate, weather systems and atmosphere, it’s important that scientists challenge their own assumptions and current theories of how these complex processes work. I think our study sheds new light on the driving forces behind the weather in the mid-latitudes,” Dr Czaja added.
1. “The Global Atmospheric Circulation on Moist Isentropes”, Science, 21 August 2008.
Olivier Pauluis (1), Arnaud Czaja (2), Robert Korty (3)
(1) Courant Institute of Mathematical Sciences, New York University, 251 Mercer Street, New York, NY 10012, USA.
(2) Space and Atmospheric Physics Group, Department of Physics, Imperial College, Huxley Building, Room 726, London SW7 2AZ, UK.
(3) Department of Atmospheric Sciences, Texas A&M University, 3150 TAMU, College Station, TX 77843–3150, USA.
Link to article: http://www.scientificblogging.com/news_releases/air_circulates_above_the_earth_in_four_distinct_cells
NOAA: Fifth Warmest July on Record for Globe
NOAA: Fifth Warmest July on Record for Globe
August 15, 2008
The combined average global land and ocean surface temperature for July 2008 tied with 2001 and 2003 as the fifth warmest July since worldwide records began in 1880, according to an analysis by NOAA’s National Climatic Data Center in Asheville, N.C.
Also, the 7 months from January to July 2008 ranked as the 9th warmest 7-month period for combined average global land and ocean surface temperature.
Global Temperatures
* The July 2008 combined global land and ocean surface temperature was 0.88 F (0.49 C) above the 20th century mean of 60.4 F (15.8 C). For the January–July period, the combined global land and ocean surface temperature was 0.81 F (0.45 C) above the 20th century mean of 56.9 F (13.8 C).
* Separately, the global land surface temperature for July was 1.22 F (0.68 C) above the 20th century mean of 57.8 F (14.3 C). For January–July, the global land surface temperature was 1.35 F (0.75 C) above the 20th century mean of 46.8 F (8.3 C).
* The July global ocean surface temperature was 0.76 F (0.42 C) above the 20th century mean of 61.5 F (16.4 C). The January–July global ocean surface temperature was 0.61 F (0.34 C) above the 20th century mean of 61.0 F (16.1 C).
* El Niño-Southern Oscillation conditions continued neutral through July in the tropical Pacific Ocean, ending the La Niña event that began in mid-2007.
* Northern Hemisphere sea ice extent ranked 4th lowest on record for July. Since 1979, Northern Hemisphere sea ice extent in July has decreased by 6.1% per decade. In contrast, the Southern Hemisphere sea ice extent was slightly above the 1979-2000 average and ranked 10th largest for July out of the last 30 years.
Link to article: http://www.noaanews.noaa.gov/stories2008/20080815_ncdc.html
Subscribe to:
Posts (Atom)


