Blog Archive

Showing posts with label Soot. Show all posts

Saturday, April 7, 2018

Algae, Impurities Darken Greenland Ice Sheet And Increases Melting

by Keith Cowing, SpaceRef, April 4, 2018


Impure Ice at Jakobshavn Isbrae on western Greenland. ©MODIS/NASA
The Dark Zone of Greenland ice sheet is a large continuous region on the western flank of the ice sheet; it is some 400 kilometers wide stretching about 100 kilometres up from the margin of the ice.
Some previous theories have attributed this darkening to water on top of the ice sheet - often seen as strikingly sapphire blue ponds, rivers and lakes. But a new study in Nature Communications provides a new hypothesis based on the character of the impurities on the ice surface itself.
"What we show is that the Dark Zone is covered in a finely distributed layer of dust, and black carbon, which provide nutrition for dark coloured algae. These are the main cause of the darkening," says professor Alun Hubbard, the co-author of the study and professor at CAGE (the Centre for Arctic Gas Hydrate, Environment and Climate at UiT, The Arctic University of Norway).
A dirt belt in the melt zone
The Dark Zone is literally a dirty belt of the melting area - the ablation zone - of the ice sheet. The darker this ablation zone is, the more of the sun's energy it absorbs, and the faster the ice melts.
Albedo is a measure of the reflectance of the ice sheet. It is the major factor governing how much incoming solar radiation is used to melt the ice and is the main positive feedback in Arctic climate change. Bright white surfaces, like snow or pure ice, reflect the sun's energy, but dark surfaces absorb it.
"The fact that a large portion of the western flank of the Greenland ice sheet has become dark means that the melt is up to five times as much as if it was a brilliant snow surface. " says Hubbard.
Algae - a major player
The ice algae seem to be one of the major players in this scheme - even the slight increase of the atmospheric temperature and liquid water production seems to promote algae colonization across the ice surface.
"The algae need nutrients and food, essentially dust, organic carbon, and water. In summer, these are plentiful and the algal bloom takes off. Because algae are dark in colour - they reinforce the dark zone. Thereby you get a positive feedback effect where the ice sheet absorbs even more solar radiation producing yet more melt."
Innovative drone study
The Dark Zone of the Greenland ice sheet is vast and previously observed by satellites such as MODIS. But for this study the scientists employed relatively modest drones - or unmanned aerial vehicles (UAV) - to survey the darkened ice belt in unprecedented detail.
While satellite data are great for the big picture of what's happening across the entire Greenland ice sheet, they only work at really coarse pixel resolutions.
"If we compare it to camera pixels, even the best satellites for the ice sheet imaging have resolution of tens of metres. They can't see the detail of what's happening on the ground. Our fixed-wing UAVs can take hundreds of images with pixel resolutions on the centimeter scale with an operating range of hundreds of kilometres," says Hubbard.
Scientists could see in real detail what the dark zone is made up of. In effect, this UAV survey across the ablation zone of the ice sheet perfectly bridges the gap between people on the ground studying what's under their feet in just one part of the ice sheet, and the satellite data that shows what's going on across the entire ice sheet.
"The UAV survey, with its amazing detail, allows us to identify and characterize all the different surface types and impurities across the entire dark zone, not just a small local little part of it."
The AUV images used in this study were collected by Johnny Ryan (Aberystwyth University, Brown University, University of California), Jason Box (GEUS) and Alun Hubbard (Aberystwyth University/CAGE) in the summer of 2014.
Please follow SpaceRef on Twitter and Like us on Facebook.

Sunday, April 3, 2016

"The implication of nonradiative energy fluxes dominating Greenland ice sheet exceptional ablation area surface melt in 2012," by Robert Fausto et al., GRL 43 (2016); doi: 10.1002/2016GL067720

Geophysical Research Letters, 43 (March 2016), DOI: 10.1002/2016GL067720

The implication of nonradiative energy fluxes dominating Greenland ice sheet exceptional ablation area surface melt in 2012

Robert Fausto, Dirk van As, Jason E. Box and Ruth Mottram

Abstract

During two exceptionally large, July 2012, multi-day, Greenland ice sheet, melt episodes, non-radiative energy fluxes (sensible, latent, rain, and subsurface collectively) dominated the ablation area surface energy budget of the southern and western ice sheet. On average, the non-radiative energy fluxes contributed up to 76% of daily melt energy at nine automatic weather station sites in Greenland. Comprising 6% of the ablation period, these powerful melt episodes resulted in 12–15% of the south and west Greenland automatic weather station annual ablation totals. Analysis of high resolution (~5 km) HIRHAM5 regional climate model output indicates widespread dominance of non-radiative energy fluxes across the western ablation area during these episodes. Yet HIRHAM5 still underestimates melt by up to 56% during these episodes due to a systematic underestimation of turbulent energy fluxes typical of regional climate models. This has implications for underestimating future melt, when exceptional melt episodes are expected to occur more frequently.

Introduction 

Understanding the Greenland ice sheet surface climate response is crucial for reducing uncertainties in future predictions of both magnitude and rate of global sea level change [Dutton et al., 2015] and freshwater flux [Lenaerts et al., 2015]. The rate of Greenland ice sheet mass loss has accelerated over the past decades [Tedesco et al., 2013; Khan et al., 2015], and in recent years, the surface components of the ice sheet’s mass budget have become the dominant source of ice loss, outpacing the ice dynamic component [Enderlin et al., 2014; Andersen et al., 2015]. Partly due to two exceptional melt episodes in July 2012, new records for ice sheet surface melt area and ice mass loss were set [Tedesco et al., 2013]. Satellite observations revealed more than 98% of the ice sheet surface was melting on 12 July 2012, which was unprecedented in the 1978 to present satellite record [Nghiem et al., 2012]. This widespread melt in the accumulation area was enhanced by low-level liquid clouds [Bennartz et al., 2013] promoted by the advection of anomalously warm and moist air over Greenland [Neff et al., 2014], which decreased the firn’s ability to retain meltwater [Machguth et al., 2016]. Deposition of wildfire black carbon further promoted melt through enhanced sunlight absorption [Keegan et al., 2014]. Projections suggest that such melt episodes will become increasingly frequent in coming decades [Collins et al., 2013; McGrath et al., 2013].

Wednesday, September 9, 2015

Jason Box: Earth's Ice Is Melting Much Faster Than Forecast. Here's Why That's Worrying

GREENLAND GLACIER

by Jason Box, Professor of Glaciology, Geological Survey of Denmark and Greenland, Huffington Post, September 4, 2015

COPENHAGEN -- For me it was only after 8 years of studying Greenland -- installing and maintaining a network of on-ice climate stations and examining how much snow evaporates from the island -- that I suddenly realized glaciology textbooks needed a major revision. This was in 2002. Prior to the epiphany, conventional knowledge held that the ice sheet was frozen at its bed, and so the reaction time of the ice sheet to climate warming was measured in tens of thousands of years. A heck of a long time.
Climate warming had just infiltrated Greenland glaciology in earnest. Summer melt water, it turned out, drains down quickly to the bed, lubricating the glacier's flow. Suddenly we realized an expanding melt season meant the ice sheet would be sliding faster, longer. It was not to be the only time our philosophy got hit with a major surprise that connected the ice sheet with climate change and the threat of abrupt sea level rise.
The next one came in 2006.
Somehow all marine-terminating glaciers across the southern half of Greenland doubled in speed simultaneously between 2000 and 2005. [Readers, this news is what caused me to begin this blog -- I had the one and only epiphany in my life when I read about this.] We didn't yet know why.
In the meantime, scientists tried defining a plausible upper limit for the contribution to sea level rise from Greenland's ice. That was at a time when surging glacier speeds -- ice flow -- was thought to be the dominant conveyer of ice loss, and would be for the foreseeable future. Well, surprise! It became clear that for six years in a row, starting in 2007, ice loss from surface meltwater runoff took over the lead position in the competition for biggest loser.  [This was something I thought privately at the time -- that this must occur eventually, but I did not imagine that it would occur so soon. I never bought into the idea that the topography was a limit on glacial outflow and thus would restrain Greenland's contribution to sea level rise.] From 2007 to 2012, nearly each summer set higher and higher melt records, owing to persistent and unforeseen weather that by 2012 would become a signature of climate change.
The competition between how much ice is lost through glacier flows into fjords versus meltwater runoff is intimately synergistic with meltwater interacting with ice flow all along the way. Increasing melt sends more water down through the ice sheet, softening the ice so it flows faster. Once at the bed the water lubricates flow. Squirting out the front of glaciers into the sea, the meltwater drives a heat exchange that undercuts glaciers, promoting calving, loss of flow resistance and faster flow. Put it this way: in Washington, DC, to know what's happening, you follow the money; in Greenland you follow the meltwater.
Put it this way: in Washington, DC, to know what's happening, you follow the money; in Greenland you follow the meltwater.
Glaciologists became oceanographers when they realized, in 2008, the trigger effect for galloping glaciers was warm pulses of subtropical waters that undermine glaciers at great depth in the sea, at the grounding lines where this warm water can invade.
Indeed, ocean warming is arguably the climate change story. The planetary energy imbalance due to the enhanced greenhouse effect is loading far more heat into the oceans than the atmosphere or land. The world is 70% ocean-covered. after all. While there were signs of a warming hiatus in air temperatures from 1998 to 2012, the ocean continued to heat up, an equivalent of four Hiroshima bombs, per second, all day, every day. The increase is continuing as we load the atmosphere with CO2.
The fundamental climate heating issue is a problem of too much of a good thing. The natural greenhouse effect -- a good thing -- keeps temperatures tolerable at night. But it has been enhanced by more than a century of people externalizing the environmental costs of stupendous economic growth, loading the atmosphere now with 42% more carbon dioxide, 240% more methane, 20% more nitrous oxide, 42% more tropospheric ozone, etc. We have far too much gaseous carbon compounds now in our atmosphere, people. The carbon pollution is, by the way, making our oceans too acidic, threatening the base of the marine food chain. Would someone step forward and deny the changing ocean chemistry? Do I digress?
We have far too much gaseous carbon compounds now in our atmosphere, people.
The key question, as I see it, is how to project what the sea level will soon be due to ice sheet melting. But this is confounded by us not really knowing what to expect. We keep being surprised by nature being more sensitive and complex. As the science develops, we see more interconnection, where multiplying feedbacks produce surprisingly fast responses.
Will there be some saving self-regulation of human-induced climate warming and its melting land ice consequences? The enormous increase of heat in our oceans, from past decades of enhanced greenhouse effect, negates any hope that negative feedbacks or even solar output will prevent a much warmer world. The few negative feedbacks we have found for ice -- like more snow as a result of a warming climate, more reflective frost, more efficient sub-glacial water transmission -- are clearly being outdone. And at the global scale, despite some negative feedbacks like more clouds, clearly we are not seeing net cooling. Feedbacks, whether positive or negative, only do their thing after the initial effect. Negative feedbacks don't reverse the perturbation.
Seemingly the biggest issue with abrupt sea level rise comes from the now-unstoppable loss of key sectors of West Antarctic ice and the discovery of more marine instability than we thought elsewhere. Like glaciers thinning rapidly in East Antarctica. Or in Greenland, where improved bedrock maps reveal a marine connection an average of 40 kilometers further inland than previously thought. Or like how new fjord underwater mapping reveals greater fjord depths, increasing the odds that deep warm ocean water can communicate with more Greenland glaciers than previously thought. Surprise, surprise, surprise.
I'd say we are in for more surprises.
If the past decade of scientific inquiry is any indication, I'd say we are in for more surprises. That notion is further supported by the fact that the climate models used for projecting future temperatures lack key processes that likely reinforce warming or the effects of warming, not regulate it.
Despite decades of progress by many clever scientists engaged with climate modeling, climate models used to inform policymakers don't yet encode key pieces of physics that have ice melting so fast. They don't incorporate thermal collapse -- ice softening due to increasing meltwater infiltration.
Climate models also don't yet incorporate increasing forced ocean convection at the ocean fronts of glaciers that forces a heat exchange between warming water and ice at the grounding lines.
Climate models don't yet include ice algae growth that darkens the bare ice surface.
Climate models don't yet prescribe background dark bare ice from outcropping dust on Greenland from the dusty last ice age.
Climate models don't include increasing wildfire delivering more light-trapping dark particles to bright snow-covered areas, yielding earlier melt onset and more intense summer melting.
As a result of some of these factors and probably some as yet unknown others, climate models have under-predicted the loss rate of snow on land by a factor of four and the loss of sea ice by a factor of two.
Climate models also don't yet sufficiently resolve extended periods of lazy north-south extended jet streams that produce the kind of sunny summers over Greenland (2007-2012 and 2015) that resulted in melting that our models didn't foresee happening until 2100.
While individual climate models come close to observations on this or that piece of the complex big picture, what ends up in global assessment reports intended to help guide policy decisions and national discussions of climate change are very conservative averages of dozens of models that don't include the latest, higher sensitivity physics.
So, alas, when it comes to ice, how fast it can go and how fast the sea will rise, if I were a betting man, I'd put my money on it going faster than forecast.

Wednesday, October 1, 2014

Jason Box: Greenland is the new black

by Peter Sinclair, Climate Crocks, October 1, 2014

Jason Box returned to Greenland for a few days late in August, and was able to shoot the video above. Newest observations show the lowest reflectivity on record for Greenland’s Upper elevations.
jason_dktwitter
And there’s this.

NBC News:
Spongy sediments under Greenland’s ice sheet may accelerate its flow into the sea — an effect that previous estimates of ice loss failed to account for, according to University of Cambridge researchers. They said that means the ice sheet may be more sensitive than previously thought to overall climate change, along with short-term events like heavy rain and heat waves. 
The researchers said it was thought that Greenland’s extensive ice fields rested on hard bedrock, but new evidence shows that soft sediments also are present. Those sediments weaken as they soak up water from seasonal melt, allowing the sheet to move faster to the sea, the researchers said. Greenland’s ice sheet covers 660,000 square miles (1.7 million square kilometers) to a depth of nearly 2 miles (3 kilometers) at its thickest. A 2012 study found that the sheet’s melting was accelerating, and a 2013 study estimated that because of melting in Greenland and Antarctica, sea levels could be 2 feet higher when today’s preschoolers are grandparents. The research was funded by the Natural Environment Research Council and published Monday in the journal Nature Communications.
http://climatecrocks.com/2014/10/01/august-2014-greenland-is-the-new-black/ 

Wednesday, September 17, 2014

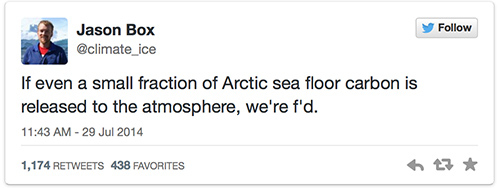
Peter Sinclair: Jason Box, "We're f'd"

by Peter Sinclair, Climate Crocks, September 16, 2014


Above – reposting, first Greenland 2014 piece from last week.

After unpacking a few clean clothes, grabbing long showers, and sharing a few moderate adult beverages, Jason Box and I eased back into the media sphere, after almost 2 weeks on the Greenland sheet. Robin Williams was dead. That hit us both at the same time. I checked email. Jason checked twitter. And took on a startled look.

An unusually blunt statement from usually soft spoken Box had gone viral. [In my experience, when scientists start swearing, they are really feeling the import of what is going on.]

Brian Merchant had a piece on Motherboard, here’s part of it:
This week, scientists made a disturbing discovery in the Arctic Ocean: They saw “vast methane plumes escaping from the seafloor,” as the Stockholm University put it in a release disclosing the observations. The plume of methane—a potent greenhouse gas that traps heat more powerfully than carbon dioxide, the chief driver of climate change—was unsettling to the scientists. 
But it was even more unnerving to Dr. Jason Box, a widely published climatologist who had been following the expedition. As I was digging into the new development, I stumbled upon his tweet, which, coming from a scientist, was downright chilling:
effed
Box, who is currently a professor of glaciology at the Geological Survey of Denmark and Greenland, has been studying the Arctic for decades. His accolade-packed Wikipedia page notes that he’s made some 20 expeditions to the Arctic since 1994, and served as the lead author on the Greenland section of NOAA’s State of the Climate report from 2008-2012. He also runs the Dark Snow project and writes about the latest findings in the field at his blog, Meltfactor. 
In other words, Box knows the Arctic, and he knows climate change—and the methane plumes had him blitzed enough to bring out the F bombs. 

Now, the scientists in the Arctic didn’t fully understand why the plumes were occurring. But they speculated that a warmer “tongue” of ocean current was destabilizing methane hydrates on the Arctic slope. 
I called the scientist at his office in Copenhagen, and he talked frankly and emphatically about the new threat, and about the specter of climate change in general. He also swore like a sailor, which I’ve often wondered how climatologists refrain from doing, given the urgency of the problem—it’s certainly an entirely accurate way to communicate the climate plight. 
Salon had a piece. Jason’s twitter feed had more than tripled. His interview with Bill Maher was online.

Jason’s wife called. A Hungarian acquaintance had told her that Jason was front page news in Budapest.

The ice in Greenland this year isn’t just a little dark—it’s record-setting dark. Box says he’s never seen anything like it. I spoke to Box by phone earlier this month, just days after he returned from his summer field research campaign. 
 “I was just stunned, really,” Box told me. 
The photos he took this summer in Greenland are frightening. But their implications are even more so. Just like black cars are hotter to the touch than white ones on sunny summer days, dark ice melts much more quickly. 
As a member of the Geological Survey of Denmark and Greenland, Box travels to Greenland from his home in Copenhagen to track down the source of the soot that’s speeding up the glaciers’ disappearance. He aptly calls his crowdfunded scientific survey Dark Snow. 
There are several potential explanations for what’s going on here. The most likely is that some combination of increasingly infrequent summer snowstorms, wind-blown dust, microbial activity, and forest fire soot led to this year’s exceptionally dark ice. A more ominous possibility is that what we’re seeing is the start of a cascading feedback loop tied to global warming. Box mentions this summer’s mysterious Siberian holes and offshore methane bubbles as evidence that the Arctic can quickly change in unpredictable ways. 
This year, Greenland’s ice sheet was the darkest Box (or anyone else) has ever measured. Box gives the stunning stats: “In 2014 the ice sheet is precisely 5.6 percent darker, producing an additional absorption of energy equivalent with roughly twice the US annual electricity consumption.” 
Perhaps coincidentally, 2014 will also be the year with the highest number of forest fires ever measured in Arctic.
http://climatecrocks.com/2014/09/16/slate-why-greenlands-dark-snow-should-worry-you/ 

Thursday, July 24, 2014

The Dark Snow team investigates the source of soot that's accelerating Greenland ice melt

The crowd-funded Dark Snow Project is trying to figure out where Greenland soot is coming from

by John Abraham, "Climate Consensus - The 97%," The Guardian, July 24, 2014


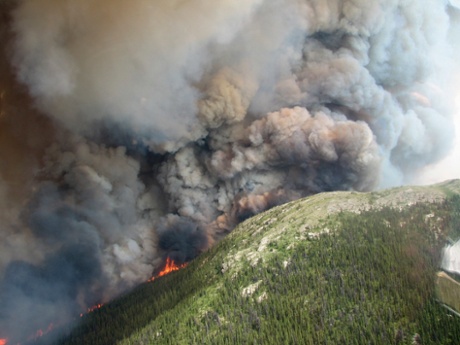
The Mount McAllister wildfire burns 34 miles (56 km) west of Chetwynd in British Columbia, in this handout photo taken July 14, 2014.  Wildfires like this are one source of black soot.
The Mount McAllister wildfire burns 34 miles (56 km) west of Chetwynd in British Columbia, in this handout photo taken July 14, 2014. Wildfires like this are one source of black soot. Photograph: Reuters
Around the planet, wildfires are becoming larger and more destructive. This summer, a series of wildfires enveloped large areas of Canada’s Boreal forest, blanketing western North America with smoke. One key question is, do these fires have an effect on climate by darkening Arctic ice with layers of soot, causing more sunlight to be absorbed by the ice?
For the second year, the Dark Snow Project science team has taken to the ice on Greenland to investigate the forces driving Greenland's ice loss. They are looking at the causes of surface darkening on the ice sheet that's been observed over the last decade. 
The Dark Snow Project is a collaborative effort between a multidisciplinary, international group of experts. The driving questions are, what's causing the steady darkening of the Greenland Ice Sheet that has been observed in the past decade? Is it an important cause of ice melt? Does it represent yet another climate "feedback" which is accelerating global change?
Peter Sinclair, Dark Snow Participant.

A number of natural processes cause ice to darken. The simple process of melting causes ice crystals to deform and reflect less light. In addition, pollen, sea spray, desert dust, pollution from industry and shipping cause darkening. However, there are also other causes.
Recently, newly published research strengthens the idea that wildfire soot has driven extensive melt over the ice sheet, and in addition, that layers of refrozen water are themselves darkening factors that drive further melt.
In addition to increased wildfires, the Dark Snow Team will be investigating the impact of algae and microbes, which, increasingly favored by warming temperatures, are gaining a larger foothold on the ice.
Dark Snow biologist Dr. Marek Stibal has found that a species of algae living on the ice produces a very special pigment that acts as a sunscreen, protecting it against the intense summer glare. The pigment is the very same molecule that gives black tea its color. The dark pigment, visible in many photos of ice during melt season, is an important, but not well understood, part of the darkening process.
As warmer temperatures spread over larger areas of the ice, more liquid water is made available - a vital factor for algae growth. In addition, scientists wonder whether industrial pollution may be delivering key nutrients like nitrogen and phosphorus to the ice, further driving algae growth.
Data is gathered through use of small aerial drones that hover over the ice and gather photographic evidence of changes in whiteness. The team has modified several small drones for their science purposes this year, and they are gathering exciting data under challenging conditions. By combining observations and sampling at the surface, with low-altitude drone observation, and ice-sheet-scale imagery from satellites, the team hopes to have a complete micro-to-macro view of the ice darkening processes. 
The original mission of Dark Snow was not just to do science, but also to bridge the communication gap with a wider public, to better inform a global audience on the key findings that fill in the climate change story. 
With a feature story in Rolling Stone magazine, and high-profile interviews with Dark Snow scientist Jason Box on NBC, Vice News, and recently, the "Real Time with Bill Maher," that communication part of the mission is also being realized.
The Dark Snow Project is a citizen scientist collaboration, funded by a continuing crowd-source effort online. That effort is still ongoing at this time. One project the team still hopes to fund for August is a satellite hookup for internet connectivity, so as to be able to communicate day-to-day, and moment-to-moment, with journalists and citizens around the globe.
I am anxious to see how this combined funding and media strategy works. While my own climate research is completely unfunded (yes, you read that right), my activities in the thermal sciences has a much more traditional source of resources. Will the Dark Snow project show that alternatives to the traditional research grants are viable? We will see.

Sunday, July 20, 2014

NASA JPL Orbiting Carbon Observatory-2 satellite (OCO-2) can track CO2 back to its source, help refine model resolution to regions


Carbon in Smoke PlumesScientists will use measurements from the Orbiting Carbon Observatory-2 to track atmospheric carbon dioxide to sources such as these wildfires in Siberia, whose smoke plumes quickly carry the greenhouse gas worldwide. The fires were imaged on May 18, 2014, by NASA's Moderate Resolution Imaging Spectrometer instrument on the Terra satellite. Image credit: NASA/LANCE/EOSDIS Rapid Response 
› Larger image

NASA's JPL, July 18, 2014
NASA's Orbiting Carbon Observatory-2, which launched on July 2, 2014, will soon be providing about 100,000 high-quality measurements each day of carbon dioxide concentrations from around the globe. Atmospheric scientists are excited about that. But to understand the processes that control the amount of the greenhouse gas in the atmosphere, they need to know more than just where carbon dioxide is now. They need to know where it has been. It takes more than great data to figure that out.
"In a sense, you're trying to go backward in time and space," said David Baker, a scientist at Colorado State University in Fort Collins. "You're reversing the flow of the winds to determine when and where the input of carbon at the Earth's surface had to be to give you the measurements you see now."
Harry Potter used a magical time turner to travel to the past. Atmospheric scientists use a type of computer model called a chemical transport model. It combines the atmospheric processes found in a climate model with additional information on important chemical compounds, including their reactions, their sources on Earth's surface and the processes that remove them from the air, known as sinks.
Baker used the example of a forest fire to explain how a chemical transport model works. "Where the fire is, at that point in time, you get a pulse of carbon dioxide in the atmosphere from the burning carbon in wood. The model's winds blow it along, and mixing processes dilute it through the atmosphere. It gradually gets mixed into a wider and wider plume that eventually gets blown around the world."
Some models can be run backward in time -- from a point in the plume back to the fire, in other words -- to search for the sources of airborne carbon dioxide. The reactions and processes that must be modeled are so complex that researchers often cycle their chemical transport models backward and forward through the same time period dozens of times, adjusting the model as each set of results reveals new clues. "You basically start crawling toward a solution," Baker said. "You may not be crawling straight toward the best answer, but you course-correct along the way."
Lesley Ott, a climate modeler at NASA's Goddard Space Flight Center, Greenbelt, Maryland, noted that simulating carbon dioxide's atmospheric transport correctly is a prerequisite for improving the way global climate models simulate the carbon cycle and how it will change with our changing climate. "If you get the transport piece right, then you can understand the piece about sources and sinks," she said. "More and better-quality data from OCO-2 are going to create better characterization of global carbon."
Baker noted that the volume of data provided by OCO-2 will improve knowledge of carbon processes on a finer scale than is currently possible. "With all that coverage, we'll be able to resolve what's going on at the regional scale," Baker said, referring to areas the size of Texas or France. "That will help us understand better how the forests and oceans take up carbon. There are various competing processes, and right now we're not sure which ones are most important."
Ott pointed out that improving the way global climate models represent carbon dioxide provides benefits far beyond the scientific research community. "Trying to figure out what national and international responses to climate change should be is really hard," she said. "Politicians need answers quickly. Right now we have to trust a very small number of carbon dioxide observations. We're going to have a lot better coverage because so much more data is coming, and we may be able to see in better detail features of the carbon cycle that were missed before." Taking those OCO-2 data backward in time may be the next step forward on the road to understanding and adapting to climate change.
To learn more about the OCO-2 mission, visit these websites: http://www.nasa.gov/oco2 , http://oco.jpl.nasa.gov

Wednesday, May 14, 2014

Greenland: Dark Snow Project, 2014 field work season

by Greg Laden, Greg Laden's Blog, ScienceBlogs, May 14, 2014

The Dark Snow Project is staring up again, it being almost summer(ish) in Greenland.
The results in the study of the odd 2012 winter are now in. That year, there was a huge spike in melting on the surface of Greenland. (Discussed here.) One idea is that a good part of this melting was caused by extra soot from extensive wildfires in North America, which increased the amount of solar energy collected on the ice surface.
The results confirm this, and the Dark Snow team is returning this year to collect more information.

The Dark Snow project is crowd funded, and you are asked to provide a donation. More information on that here.

http://scienceblogs.com/gregladen/2014/05/14/dark-snow-project/

Wednesday, January 29, 2014

Asian pollution climatically modulates mid-latitude cyclones following hierarchical modelling and observational analysis

Nature Communications, 5, article number 3098 (21 January 2014); doi: 10.1038/ncomms4098

Asian pollution climatically modulates mid-latitude cyclones following hierarchical modelling and observational analysis


Abstract


Increasing levels of anthropogenic aerosols in Asia have raised considerable concern regarding its potential impact on the global atmosphere, but the magnitude of the associated climate forcing remains to be quantified. Here, using a novel hierarchical modelling approach and observational analysis, we demonstrate modulated mid-latitude cyclones by Asian pollution over the past three decades. Regional and seasonal simulations using a cloud-resolving model show that Asian pollution invigorates winter cyclones over the northwest Pacific, increasing precipitation by 7% and net cloud radiative forcing by 1.0 W m−2 at the top of the atmosphere and by 1.7 W m−2 at the Earth’s surface. A global climate model incorporating the diabatic heating anomalies from Asian pollution produces a 9% enhanced transient eddy meridional heat flux and reconciles a decadal variation of mid-latitude cyclones derived from the reanalysis data. Our results unambiguously reveal a large impact of the Asian pollutant outflows on the global general circulation and climate.

http://www.nature.com/ncomms/2014/140121/ncomms4098/full/ncomms4098.html

Monday, November 11, 2013

China Uncensored (Beijing's Most Dangerous Pastime—Breathing): Air pollution so bad the spy cameras can't see anything

Beijing's Most Dangerous Pastime—Breathing

from China Uncensored: Beijing is being gassed with "crazy bad" air pollution. Did I say air pollution? I meant to say, "heavy fog." That's what China's media calls it. But don't think that doesn't mean the Chinese regime isn't doing anything about it! The smog has made it next to impossible to spy on people! What good are China's network of more than 20 million cameras if they can't see through toxic clouds of smog that can be seen from outer space!?!

https://www.youtube.com/watch?v=oR8d1PZvYRI


Sunday, September 22, 2013

David Spratt: Is climate change already dangerous? Part III. Consequences from current greenhouse gas levels

by David Spratt, Climate Code Red, September 22, 2013

Third in a series

Danger from implied temperature increase


The current level of atmospheric CO2 only is sufficient to increase the global temperature at equilibrium by +1.5 °C, based on the standard assumption of near-term climate sensitivity of 3 °C for doubled CO2.

If all current greenhouse gases are taken into account, then: 
The observed increase in the concentration of greenhouse gases (GHGs) since the pre-industrial era has most likely committed the world to a warming of 2.4 °C (within a range of +1.4 °C to +4.3 °C) above the pre-industrial surface temperatures (Ramanthan and Feng).
And the 2007 IPCC Synthesis report (Table 5.1 on emission scenarios) also shows that for levels of greenhouse gases that have already been achieved (CO2 in the range of 350–400 ppm, CO2e in the range 445–490 ppm) and peaking by 2015, the likely temperature rise is in the range of 2–2.4 °C. 

These scenarios include short-lived gases such as methane, which degrades out of the atmosphere in a decade, and also nitrous oxide, which has an atmospheric lifetime of around a century. On the other hand, the fact that temperatures are not already much higher than they are today is due principally to the large-scale emission of very short-lived (10 days) aerosols, such as soot and exhaust from burning fossil fuels, industrial pollution, and dust storms, which are providing temporary cooling. The effect is known popularly as “global dimming,” because the overall aerosol impact is to reduce, or dim, the sun’s radiation, thus masking some of the heating effect of greenhouse gases. The aerosol impact is not precisely known, but Ramanthan and Feng estimate it as high as ~1 °C. As the world moves to low-emission technologies, most of the aerosols and their temporary cooling will be lost. Recent research finds that quickly eliminating all greenhouse gas emissions (and necessarily the associated aerosols) would produce warming of between 0.25 and 0.5 °C over the decade immediately following (Matthews and ZickfieldHansen, Sato et al.).

A practical consideration of “dangerous” can include the question as to whether there are tipping points or “concerns” activated for the elevated temperatures that we are generally considered to be already committed to: conservatively in the range say +1.5 to 2 °C and, more pragmatically, in the range of 2 to 2.4 °C if all current greenhouse gases are considered. A related question is whether the +1.5 °C goal advocated by the small island states and surveyed recently by Climate Action Network Europe and Climate Analytics would avoid “dangerous” climate change and significant tipping points.

This is a broad topic, but four recent important research findings on impacts for the current committed warming are arresting:

Greenland Ice Sheet tipping point

The tipping point for GIS has been revised down by Robinson, Calov et al. to +1.6 ºC (uncertainty range of +0.8 to +3.2 ºC) above pre-industrial, just as regional temperatures are increasing at three-to-four times faster than the global average, and the increased heat trapped in the Arctic due to the loss of reflective sea ice ensures an acceleration in the Greenland melt rate.  If the lower Greenland boundary in the uncertainty range turned out to be right, then with current warming of +0.8 ºC over pre-industrial we have already reached Greenland’s tipping point.  And, with temperature rises in the pipeline, the upward trajectory of annual greenhouse gas emissions, the projected future increases in fossil fuel use, and the continuing political impasse in international climate negotiations, we are very likely to hit the best estimate of +1.6 ºC within a decade or two at most.

Coral reefs

Frieler, Meinshausen et al. show that “preserving more than 10 per cent of coral reefs worldwide would require limiting warming to below +1.5 °C (atmosphere–ocean general circulation models (AOGCMs) range: 1.3–1.8 °C) relative to pre-industrial levels”.  Obviously at less than 10 per cent, the reefs would be remnant, and reef systems as we know them today would be a historical footnote.  Already, the data suggests that the global area of reef systems has already been reduced by half. A sober discussion of coral reef prospects can be found in Roger Bradbury’s “A World Without Coral Reefs” and Gary Pearce’s “Zombie reefs as a harbinger for catastrophic future.”  The opening of Bradbury’s article is to the point: 
It’s past time to tell the truth about the state of the world’s coral reefs, the nurseries of tropical coastal fish stocks.  They have become zombie ecosystems, neither dead nor truly alive in any functional sense, and on a trajectory to collapse within a human generation.  There will be remnants here and there, but the global coral reef ecosystem — with its storehouse of biodiversity and fisheries supporting millions of the world’s poor — will cease to be.
3c. Arctic carbon stores

As Climate Progress recently noted: “We’ve known for a while that ‘permafrost’ was a misnomer” because thawing permafrost feedback will turn the Arctic from a net carbon sink to a net source in the 2020s and defrosting permafrost will likely add up to 1 ºC to total global warming by 2100.   A 2012 UNEP report on policy implications of warming permafrost says the recent observations “indicate that large-scale thawing of permafrost may have already started.”  In February 2013, scientists using radiometric dating techniques on Russian cave formations to measure historic melting rates warned that a +1.5 ºC global rise in temperature compared to pre-industrial was enough to start a general permafrost melt.  Vaks, Gutareva et al. found that “global climates only slightly warmer than today are sufficient to thaw extensive regions of permafrost.” Vaks says that: “1.5 ºC appears to be something of a tipping point.”

Previously a study of East Siberian permafrost by Khvorostyanov, Ciais et al.  found that once mobilised, the process would be self-maintaining due to “deep respiration and methanogenesis” (formation of methane by microbes).  In other words, the microbial action that produces methane as the carbon stores melt would produce sufficient heat to maintain the process: “once active layer deepening in response to atmospheric warming is enough to trigger deep-soil respiration, and soil microorganisms are activated to produce enough heat, the mobilization of soil carbon can be very strong and self-sustainable.”

A sharp scientific debate has started on the stability of large methane clathrate stores just below the ocean floor on the shallow East Siberian Sea, following the publication in July 2013 of research by Whiteman, Hope and Wadhams which said that the release of a single giant “pulse” of methane from thawing Arctic permafrost beneath the East Siberian Sea could come with a $60 trillion global price tag. Wadhams says “the loss of sea ice leads to seabed warming, which leads to offshore permafrost melt, which leads to methane release, which leads to enhanced warming, which leads to even more rapid uncovering of seabed,” and this is not “a low probability event.”

Multiple targets reduce allowable warming

Steinacher, Joos et al. explore the interaction of targets in emissions reductions, focusing on the 2 ºC temperature goal. They find that when multiple climate targets are set (such as food production capacity, ocean acidity, atmospheric temperature), “allowable cumulative emissions are greatly reduced from those inferred from the temperature target alone.” In fact, “When we consider all targets jointly, CO2 emissions have to be cut twice as much as if we only want to meet the 2 ºC target.”

Lessons from climate history


Another fruitful line of inquiry on whether climate change is already “dangerous” is to look at the paleo-climate (climate history) record for circumstances analogous to present conditions to learn what planetary and climate conditions were like at that time.  With current CO2 levels at 400 ppm, a useful comparison is the Pliocene (3–5 million years ago).  The research body is large and growing in this area, but here are some examples:

Sea-levels

Rohling, Grant et al.  find that during the mid-Pliocene, when greenhouse gases were similar to today, sea levels were more than 20 metres higher than today “we estimate sea level for the Middle Pliocene epoch (3.0–3.5 Myr ago) – a period with near-modern CO2 levels – at 25 ±5 metres above present, which is validated by independent sea-level data.” Likewise Hansen, Sato et al. find that “during the middle-Pliocene… we find sea level fluctuations of 2040 metres associated with global temperature variations between today’s temperature and +3 °C.”

Speed of sea-level rise

The speed of sea-level rise may far exceed the current, rather reticent estimates that are used for policy purposes.  Blancon, Eisenhauer et al. examined the paleo-climate record and showed a sea-level rises of 3 metres in 50 years due to the rapid melting of ice sheets 123,000 years ago in the Eemian, when the energy imbalance in the climate system was less than at present. 

Polar feedbacks

Hansen, Sato et al. find that current temperatures are at least as high as the Holocene Maximum (i.e., as high as they have been over the last 10,000 years).  They sum up: 
Earth at peak Holocene temperature is poised such that additional warming instigates large amplifying high-latitude feedbacks.  Mechanisms on the verge of being instigated include loss of Arctic sea ice, shrinkage of the Greenland ice sheet, loss of Antarctic ice shelves, and shrinkage of the Antarctic ice sheets.  These are not runaway feedbacks, but together they strongly amplify the impacts in polar regions of a positive (warming) climate forcing…  Augmentation of peak Holocene temperature by even +1 ºC would be sufficient to trigger powerful amplifying polar feedbacks, leading to a planet at least as warm as in the Eemian and Holsteinian periods, making ice sheet disintegration and large sea level rise inevitable.
[It is relevant here to note that warming in the pipeline due to thermal inertia, plus warming associated with the loss of aerosols, is greater than +1ºC.]

And during the Pliocene, with atmospheric greenhouse levels similar to today, the northern hemisphere was free of glaciers and ice sheets and beech trees grew in the Transantarctic Mountains. There are also strong indications that permanent El Nino conditions prevailed.

4d. Arctic carbon stores

As discussed above, scientists using radiometric dating techniques on Russian cave formations to measure historic melting rates going back 500,000 years conclude that a +1.5 ºC global rise in temperature compared to pre-industrial is enough to initiate widespread permafrost melt.  

In May this year, Brigham-Grette, Melles et al. published evidence from Lake El’gygytgyn, in north-east Arctic Russia, showing that 3.6–3.4 million years ago, summer mid-Pliocene temperatures locally were ~8 °C warmer than today, when CO2 was ~400 ppm.  This is highly significant because researchers including Celia Bitz and Philippe Ciais have previously found that the tipping point for the large-scale loss of permafrost carbon is around +8 ºC  to 10 ºC regional temperature increase.  Caias told the March 2009 Copenhagen climate science conference that: “A global average increase in air temperatures of +2 ºC and a few unusually hot years could see permafrost soil temperatures reach the +8 ºC threshold for releasing billions of tonnes of carbon dioxide and methane.” So, if the current level of greenhouse gases is enough to produce Arctic regional warming of ~+8 °C and that is a likely tipping point for large-scale permafrost loss, we have reached a disturbing milestone.

Even more disturbing is new research from Ballantyne, Axford et al. which says that during the Pliocene epoch, when CO2 levels were ~400 ppm, Arctic surface temperatures were 1520 °C warmer than today’s surface temperatures. They suggest that much of the surface warming likely was due to ice-free conditions in the Arctic. Compared to the estimated tipping point for the large-scale loss of permafrost carbon of +8 ºC to 10 ºC regional warming, this research confirms both that the current level of greenhouse gases is sufficient to create both a sea-ice-free Arctic and Arctic warming more than sufficient to trigger large-scale loss of permafrost carbon.
Next post: Climate safety and the emissions reduction challenge 
http://www.climatecodered.org/2013/09/is-climate-change-already-dangerous-3.html