Blog Archive

Showing posts with label Ron Kwok. Show all posts

Saturday, October 4, 2014

Nick Breeze: [Gavin Schmidt] Tweeting on Thin Ice - Reflecting on the Arctic Sea Ice Meeting at the Royal Society

by Nick Breeze, Envisionation, September 30, 2014

When it comes to changes in the global climate, one of the most visible and disturbing sites is the data that shows the diminishing state of sea ice in the Arctic region. It is both dramatic and symbolic, with known and unknown consequences. As someone who has been following the scientific literature on this for a few years now, I cannot help feeling that our collective societies, and especially those with real power, will rue the days they turned their backs on this dynamic and important component of our climate.
With this in mind, I was positively excited to attend the two-day event at the Royal Society on the 22nd and 23rd of September, titled, ‘Arctic sea ice reduction: the evidence, models, and global impacts.’ The list of scientists attending read like a dream team of big brains on Arctic sea ice matters:

Dr Julienne Stroeve, University of Colorado, USA; Reduction of summer sea ice extent
Professor Mark Serreze, National Snow and Ice Center, USA; Changes in Arctic sea ice and the polar atmosphere
Professor Peter Wadhams, University of Cambridge, UK; Sea ice thickness from submarines
Professor Ronald Kwok, Jet Propulsion Laboratory, CALTECH, USA; Satellite observations of sea ice thickness
Dr Andrey Proshuntinsky, Woods Hole Oceanographic Institution, USA; Arctic circulation regimes
Dr Helene Hewitt, Met Office Hadley Centre, UK; Using models to understand and predict Arctic Sea Ice
Professor John Turner, British Antarctic Survey, UK; Why is sea ice increasing in the Southern Ocean?
Dr Marika Holland, National Center for Atmospheric Research, USA; The capabilities and limitations of Arctic sea ice ocean climate models
Professor Daniel Feltham, University of Reading, UK; Sea ice mechanics and the next generation of sea ice physics
Dr Dirk Notz, Max Planck Institute for Meteorology, Germany; Processes controlling the Arctic sea ice mass balance
Professor Don Perovich, Dartmouth College, USA; Field studies of sea ice melt
Professor Grae Worster, University of Cambridge, UK; Sea ice thermodynamics and brine drainage
Dr Gavin Schmidt, NASA, USA; Atmospheric composition and radiative impacts of Arctic sea ice loss
Professor Jennifer Francis, Rutgers University, USA; The impact of Arctic sea ice loss on extreme weather
Dr Sheldon Bacon, National Oceanography Centre, UK; The Arctic Ocean freshwater budget and implications for climate
One of the most striking debates in the discussion of Arctic sea ice is the rate of loss and risk of feedbacks, such as large-scale methane release. The large-scale methane releases are a feature of the Earth’s history, where huge amounts of this deadly gas are released at a rate where they cannot be broken down, and therefore overwhelm the atmosphere. This heating effect, in turn, creates amplified heating making it difficult for life to survive. It is estimated that when the last big methane burst occurred, millions of years ago, 90% of life on Earth died and the recovery rate for biodiversity was millions of years more.
Russian scientist’s, Dr Natalia Shakhova and Dr Igor Semilitov have been conducting annual trips to the East Siberian Arctic Shelf for over ten years and are reporting an increased destabilisation of the permafrost on the shallow Arctic ocean floor in the region. The loss of ice has meant that significant heating has occurred this sensitive region, causing the frozen seabed to rise from -7 degrees centigrade to between -1 C and +3 C. Obviously, above zero, the seabed changes state from ice to water and releases methane from the rotting organic debris that has been frozen for thousands, or millions of years.
More importantly, this permafrost layer acts as a seal over an enormous store of methane hydrates conservatively estimated to be around 1,500 gigatonnes. To put this in perspective, there is currently about 5.5 gigatonnes of methane in the Earth’s atmosphere. A release of a small percentage of 50 gigatonnes has been cited as a risk. Wadhams and his colleagues used the Stern model to calculate that such a release would have the equivalent economic value of $50 trillion USD (roughly the same as global GDP). That is obviously much more than we could ever afford and the world, post-release, would look vastly different, with hardly any humans, or other species, remaining compared to what we see today.
Professor Wadhams gave his talk at the Royal Society focusing on the behaviour of sea ice, using submarine data to back up previous estimates of sea ice decline in volume over multi decades. As these are observations, it is not really something that can be contested. Wadhams has been going on trips to the Arctic aboard military submarines for many years, collecting data to feed into the models, calculating volume in addition to the ice area (extent) shown from the satellites. This has shown a dramatic drop in sea-ice volume by 40% since the late 1970s. The implications are that we are risking setting off a feedback process of methane release that could cause a huge boost to global warming. That is the view from those collecting data from the region.
On the other side of the debate stands the modellers. David Archer (not present at the event) is referred to as the “go to man” on Arctic methane. Archer says that no risk is posed from methane releases from Arctic shelves such as the one in Eastern Siberia. To represent this view at the Royal Society meeting was Dr Gavin Schmidt, the newly positioned Director of NASA’s Goddard Institute For Space Studies. Dr. Schmidt presented his modelling data, positing that there is no evidence such a risk exists. This is as a result of his examination of the data record of the Holocene period; a period of climate stability in which we and many other species have flourished. There are other scientists who look at our unprecedented climate situation and conclude that this is the beginning of the “Anthropocene”; a period of climate driven by human activity.
Schmidt does acknowledge there was a huge methane release way back in the geological record but states that the world was a very different place then and we cannot draw conclusions from it. Schmidt’s view is based much more on modelling data and theory, which is viewed with suspicion by some, due to the inability of the models to keep pace in real-time with the rapid decline of Arctic sea ice. The argument goes that if you cannot get the model to reproduce what is happening today, how can you draw conclusions of what the sea ice will do in 10, 20 or 100 years? All scientists use models, and they are very useful in looking at climate and their results are always getting better, as both the technological capacity, and the scientists understanding of Earth system processes gets better.
Dr Schmidt’s presentation was especially crafted to dispel the idea of a risk from methane releases and to directly discredit the work of Shakhova et al. Even when he mentioned the word methane, he did so encouraging the audience to make horror noises. This seems to me a thoughtless act, considering people are risking their lives to collect the data on the subject. I interviewed Shakhova in June and she gave examples of other expeditions that have had fatal outcomes for those involved. Also, considering Professor Wadhams was sat in the audience and held a different view, it seemed divisive and childish. Schmidt presented in his summary that there was no risk of a methane “bomb,” or other large-scale multi-gigatonne release from hydrate stores in the Arctic.

Although he didn’t explicitly say it, the implication was that the work of those saying “there is a risk” is rubbish. He showed models developed by Archer to prove it. However, I failed to draw a similar conclusion as Schmidt, because the scientists telling us there IS an issue, are the only ones actually visiting the region and collecting data. Shakhova said in June, when we spoke, that a decade ago there were hardly any bubbles coming out, and the ice pack on top was frozen solid. They could drive heavy vehicles out on the ice. Due to global warming, it has vanished, and now the dark open water is absorbing the sun's heat energy, and the waves that occur during intensifying storms (a new phenomenon for the Eastern Siberian Arctic Shelf) are transporting this heat down to the seabed, where the melting occurs. Thus, their observations show plumes of methane pouring off the seabed, from melting permafrost and over a kilometre wide.
The opposing views portended to set up a scenario for great discussion and perhaps, potentially, collaboration on how scientists could move forward to get to the bottom of what is happening in the volatile polar region. However, what really transpired was that Dr Schmidt was not that interested in any serious consideration of views outside those of his colleagues and had come here to only try and discredit what he might call “opponents.” Even when Professor Wadhams asked him a serious question at the end of his presentation, about what sea water temperature data is feeding Archer’s model (as it was being shown as evidence), he simply replied that “it’s [the answer] in the paper.” Conversely, when Wadhams was on the stage, Schmidt only raised his hand to ask “Is any of this based on physics?” to which Wadhams replied “no,” referring to the fact that it is collected, observational data.
Although having two opposing camps adds a bit of flavour to the proceedings, what soured the taste afterwards was Schmidt’s insulting tweeting during Wadhams' presentation. Probably aware that an older professor is not so likely to be microblogging during a serious conference on his main subject of expertise, Schmidt released the following tweets in reference to him:

"Some anticipation for Peter Wadhams. Audience members already crying," "Wadhams still using graphs with ridiculous projections with no basis in physics," "Wadhams now onto methane pulse of 50 GT. But no better justified than his previous statements," and "Wadhams clearly states that there is no physics behind his extrapolations.”
There is no doubt that such “tweets” must resonate with his own choir of over 5,800 followers on Twitter, but does it add anything whatsoever to the meeting in the room? In terms of credibility alone, it should be highlighted that Wadhams has been studying the sea ice for over 40 years and published over 300 papers on the subject. He has made countless voyages to both polar regions and even the Prime Minister of the day, Margaret Thatcher was heard to shout out in Downing Street, “Dennis… The ICE MAN is here!”, having previously telephoned him during an expedition to the Antarctic ahead of a conference in the 1980s. Even if Professor Wadhams was not a person of such high stature, Dr Schmidt’s treatment of him does sully a framework for finding answers to serious questions that science has always been so good at. It undermines the purpose of the meeting hosted by the Royal Society and also the reputation of his current position at Goddard (a position held by one of the most excellent and modest of climate experts we have seen, James Hansen, whom I was fortunate to meet and interview in 2012).
To conclude, the opportunity to discuss in depth the opposing views was squandered in place of a shallow and degrading barrage of Tweets. These were designed to undermine and dismiss a growing field of research that is being published around the world by many institutions, such as the United Nations Environment Programme, as well the peer-reviewed literature. Instead of an arena of informed and intellectual discussion, this behaviour is more akin to playground politics blended with egotistical nastiness.
On a completely different level altogether, one major triumph of the event was the presentation given by Professor Jennifer Francis from Rutgers University, USA, titled, ‘The impact of Arctic sea ice loss on extreme weather.’ Francis has been regularly cited by the mainstream media in recent months when we have experienced extreme weather events.  Her teams work has produced evidence linking the decline in Arctic sea ice to the changes in the oscillation of the jet stream, that delivers our weather and is now being affected by man-made climate change. Such work has been picked up by President Obama’s Chief Science Advisor, Dr John Holdren who is thus briefing the President. I was lucky enough to catch up with Professor Francis later in the week and conduct an interview. We’ll be posting this very shortly.

Sunday, August 24, 2014

RUSSIAN RIVER WATER UNEXPECTED CULPRIT BEHIND ARCTIC FRESHENING

Russian river water unexpected culprit behind Arctic freshening

by Sandra Hines, UW Today, January 4, 2012

A hemisphere-wide phenomenon – and not just regional forces – has caused record-breaking amounts of freshwater to accumulate in the Arctic's Beaufort Sea.


Frigid freshwater flowing into the Arctic Ocean from three of Russia's mighty rivers was diverted hundreds of miles to a completely different part of the ocean in response to a decades-long shift in atmospheric pressure associated with the phenomenon called the Arctic Oscillation, according to findings published in the January 5, 2012, issue of Nature.
The new findings show that a low pressure pattern created by the Arctic Oscillation from 2005 to 2008 drew Russian river water away from the Eurasian Basin, between Russia and Greenland, and into the Beaufort Sea, a part of the Canada Basin bordered by the United States and Canada. It was like adding 10 feet (3 meters) of freshwater over the central part of the Beaufort Sea.
“Knowing the pathways of freshwater in the upper ocean is important to understanding global climate because of freshwater's role in protecting sea ice – it can help create a barrier between the ice and warmer ocean water below – and its role in global ocean circulation. Too much freshwater exiting the Arctic would inhibit the interplay of cold water from the poles and warm water from the tropics,” said Jamie Morison, an oceanographer with the University of Washington's Applied Physics Laboratory and lead author of the Nature paper.

Red arrows show the new path of Russian river water into the Canada Basin. The previous freshwater pathway – across the Eurasian Basin toward Greenland and the Atlantic – was altered by atmospheric conditions created by the Arctic Oscillation. Credit: University of Washington
Morison and his six co-authors from the UW and NASA's Jet Propulsion Laboratory are the first to detect this freshwater pathway and its connection to the Arctic Oscillation. The work is based on water samples gathered in the field combined with satellite oceanography possible for the first time with data from NASA satellites known as ICESat and GRACE.
“Changes in the volume and extent of Arctic sea ice in recent years have focused attention on the impacts of melting ice,” said co-author Ron Kwok, senior research scientist with the Jet Propulsion Laboratory in Pasadena, Calif. “The combined GRACE and ICESat data allow us to now examine the impacts of widespread changes in ocean circulation.”

Red arrows show the new path of Russian river water into the Canada Basin. The previous freshwater pathway – across the Eurasian Basin toward Greenland and the Atlantic – was altered by atmospheric conditions created by the Arctic Oscillation. Credit: University of Washington
Taken as a whole, the salinity of the Arctic Ocean is similar to the past, but the change in the freshwater pathway means the Eurasian Basin has gotten more saline while the Canada Basin has gotten fresher.
“The freshening on the Canadian side of the Arctic over the last few years represents a redistribution of freshwater, there does not seem to be a net freshening of the ocean,” Kwok said.
In the Eurasian Basin, the change means less freshwater enters the layer known as the cold halocline and could be contributing to declines in ice in that part of the Arctic, Morison said. The cold halocline normally sits like a barrier between ice and warm water that comes into the Arctic from the Atlantic Ocean. Without salt the icy cold freshwater is lighter, which is why it is able to float over the warm water.
In the Beaufort Sea, the water is the freshest its been in 50 years of record keeping, he said. The new findings show that only a tiny fraction is from melting ice and the vast majority is Eurasian river water.
The Beaufort Sea stores a significant amount of freshwater from a number of sources, especially when an atmospheric condition known as the Beaufort High causes winds to spin the water in a clockwise gyre. When the winds are weaker or spin in the opposite direction, freshwater is released back into the rest of the Arctic Ocean, and from there to the worlds oceans. Some scientists have said a strengthening of the Beaufort High is the primary cause of freshening, but the paper says salinity began to decline in the early 1990s, a time when the Beaufort High relaxed and the Arctic Oscillation increased.
“We discovered a pathway that allows freshwater to feed the Beaufort gyre,” Kwok said. “The Beaufort High is important but so are the broader-scale effects of the Arctic Oscillation.”
“A number of people have come up with ways of looking at regional forces at work in the Arctic,” Morison said, “To better understand changes in sea ice and the Arctic overall we need to look more broadly at the hemisphere-wide Arctic Oscillation, its effects on circulation of the Arctic Ocean and how global warming might enhance those effects.”
In coming years if the Arctic Oscillation stops perpetuating that low pressure, the freshwater pathway should switch back.
Morison and the co-authors argue that, compared to prior years, the Arctic Oscillation has been in its current state for the last 20 years. For example, the changes detected in response to the Arctic Oscillation between 2005 and 2008 are very similar to freshening seen in the early 1990s, Morison said.
Discerning the track of freshwater from Eurasian rivers would have been impossible without the ICESat and GRACE satellites, Kwok and Morison agree. With satellite measurements of ocean height and bottom pressures, the researchers could separate the changes in mass from changes in density – or freshwater content – of the water column.
“To me its pretty spectacular that you have these satellites zipping around hundreds of kilometers above the Earth and they give us a number about salinity that's very close to what we get from lowering little sampling bottles into the ocean,” Morison said.
Other co-authors are Cecilia Peralta-Ferriz with the UWs School of Oceanography and Matt Alkire, Ignatius Rigor, Roger Andersen and Mike Steele, all with the UWs Applied Physics Laboratory. The work was funded by the National Science Foundation and NASA. For more information: Morison, 206-543-1394 (office), 206-310-5307 (cell), morison@apl.washington.edu and Kwok, contact via Alan Buis, 818-354-0474, alan.d.buis@jpl.nasa.gov
Top Image: Julian Olden and graduate student Thomas Pool weigh invasive carp from an Arizona stream. Credit: Olden Lab

Thursday, March 15, 2012

NSIDC, Arctic Sea Ice Report of March 6, 2012: February ice extent low in the Barents Sea, high in the Bering Sea

February ice extent low in the Barents Sea, high in the Bering Sea

As in January, sea ice extent in February was low on the Atlantic side of the Arctic, but unusually high on the Pacific side of the Arctic, remaining lower than average overall. At the end of the month, ice extent rose sharply, as winds changed and started spreading out the ice cover.
Sea ice extent in late winter can go up and down very quickly, getting pushed together or dispersed by strong winds. Ice extent usually reaches its annual maximum sometime in late February or March, but the exact date varies widely from year to year.
Arctic sea ice extent for February 2012 was 14.56 million square kilometers (5.62 million square miles). The magenta line shows the 1979 to 2000 median extent for that month. The black cross indicates the geographic North Pole. Sea Ice Index data. Credit: National Snow and Ice Data Center. High Resolution Image
Overview of conditions
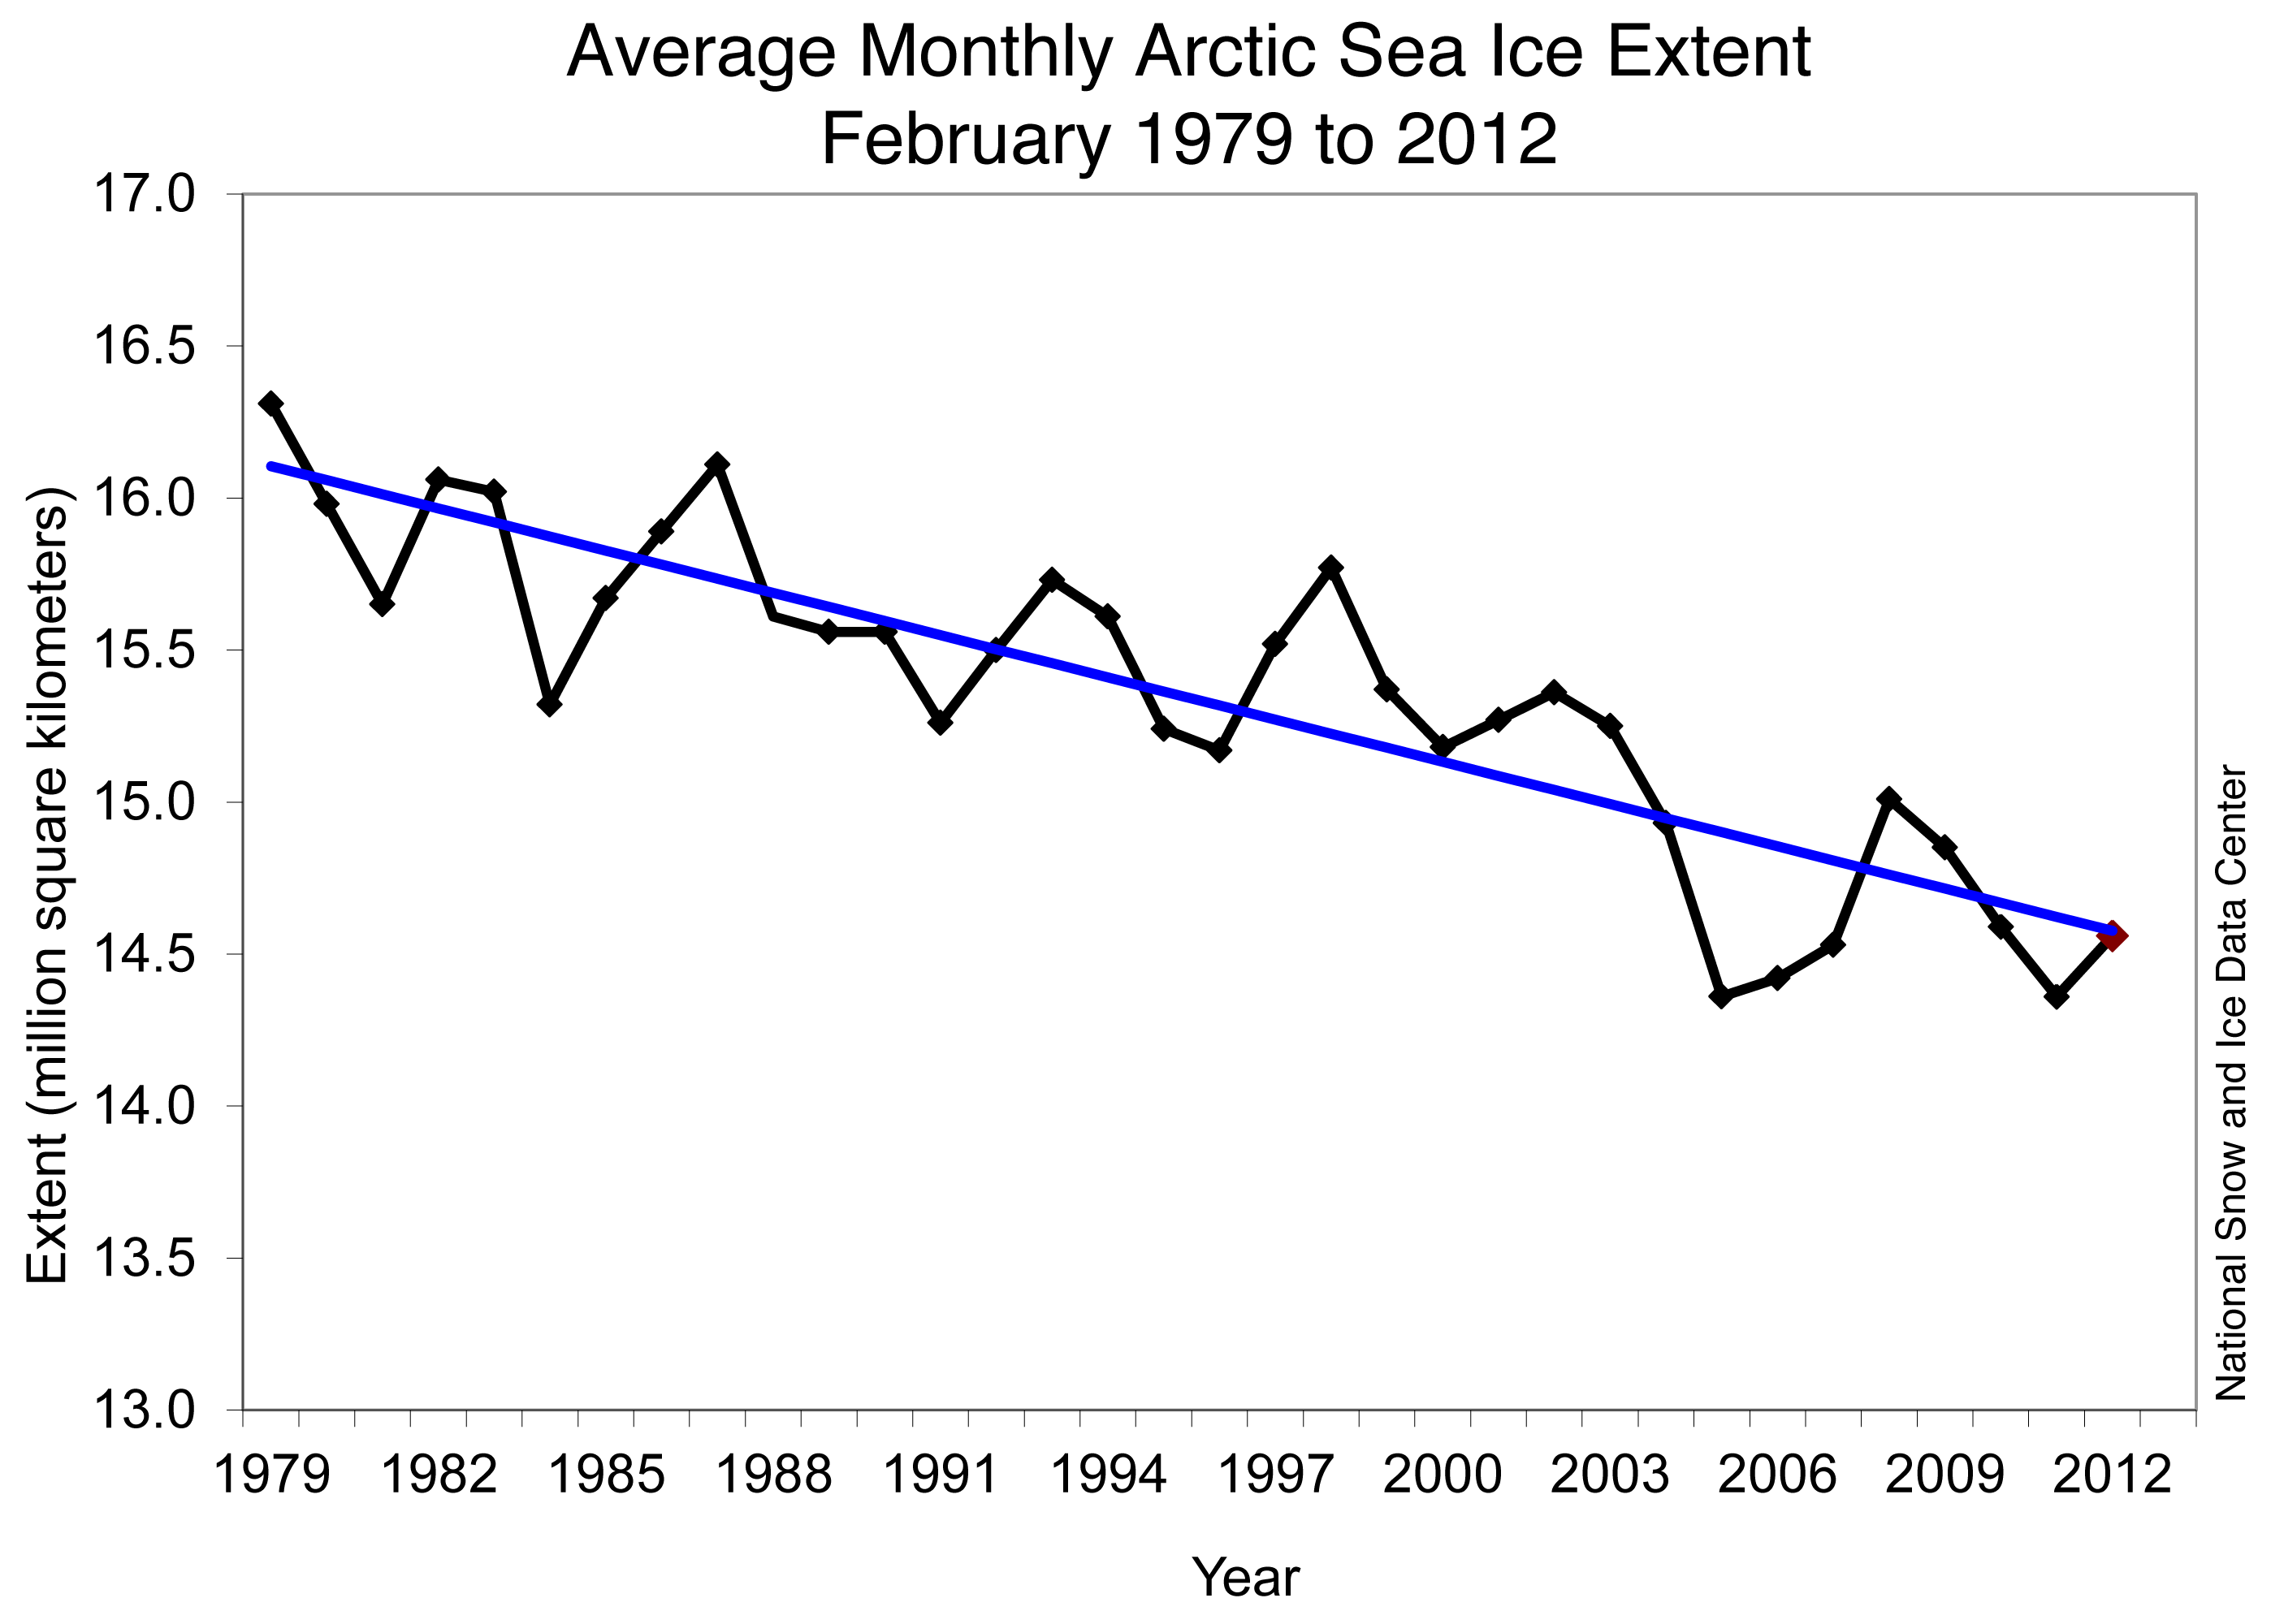
Arctic sea ice extent in February 2012 averaged 14.56 million square kilometers (5.62 million square miles). This is the fifth-lowest February ice extent in the 1979 to 2012 satellite data record, 1.06 million square kilometers (409,000 square miles) below the 1979 to 2000 average extent.
Continuing the pattern established in January, conditions differed greatly between the Atlantic and Pacific sides of the Arctic. On the Atlantic side, especially in the Barents Sea, air temperatures were higher than average and ice extent was unusually low. February ice extent for the Barents Sea was the lowest in the satellite record.  Air temperatures over the Laptev, Kara and Barents seas ranged from 4-8 C (7-14 F) above average at the 925 hectopascal (hPa) level (about 3,000 feet above sea level).  In contrast, on the Pacific side, February ice extent in the Bering Sea was the second highest in the satellite record, paired with air temperatures that were 3-5 C (5-9 F) below average at the 925 hPa level.
graph showing years and ice extent
The graph above shows daily Arctic sea ice extent as of March 5, 2012, along with the ice extents for the previous four years. 2011 is shown in light blue, 2010 is in pink, 2009 in dark blue, 2008 is in purple, and 2007, the year with the record low minimum, is dashed green. The gray area around the average line shows the two standard deviation range of the data. Sea Ice Index data.  Credit: National Snow and Ice Data Center. High Resolution Image
Conditions in context
Overall, the Arctic gained 956,000 square kilometers (369,000 square miles) of ice during the month. This was 486,000 square kilometers (188,000 square miles) more than the average ice growth for February 1979 to 2000. The overall low ice extent for the month stemmed mostly from the low ice extent in the Barents Sea: the extensive ice in the Bering Sea was not enough to compensate. On average, the Barents Sea has 865,000 square kilometers (334,000 square miles) of ice for the month of February. This year there were only 401,000 square kilometers (155,000 square miles) of ice in that region, the lowest recorded in the satellite data record.
At the end of February, ice extent rose sharply. Data from the NSIDC Multisensor Analyzed Sea Ice Extent (MASIE) showed that the rise came mainly from the Bering Sea and Baffin Bay. In the Bering Sea and Baffin Bay, winds pushed the ice extent southward. Ice growth in the Kara Sea also contributed to the rise in ice extent. In the Kara Sea, westerly winds that had been keeping the area ice-free shifted, allowing the open water areas to freeze over. During late winter, ice extent can change quickly as winds push extensive ice cover together, or spread out ice floes over a greater area.
Monthly February ice extent for 1979 to 2012 shows a decline of 3.0% per decade. Credit: National Snow and Ice Data Center. High Resolution Image
February 2012 compared to past years
Arctic sea ice extent for February 2012 was the fifth lowest in the satellite record. Including the year 2012, the linear rate of decline for February ice extent over the satellite record is 3.0% per decade. Based on the satellite record, through 2003, average February ice extent had never been lower than 15 million square kilometers (5.79 million square miles). February ice extent has not exceeded that mark eight out of the nine years since 2003.
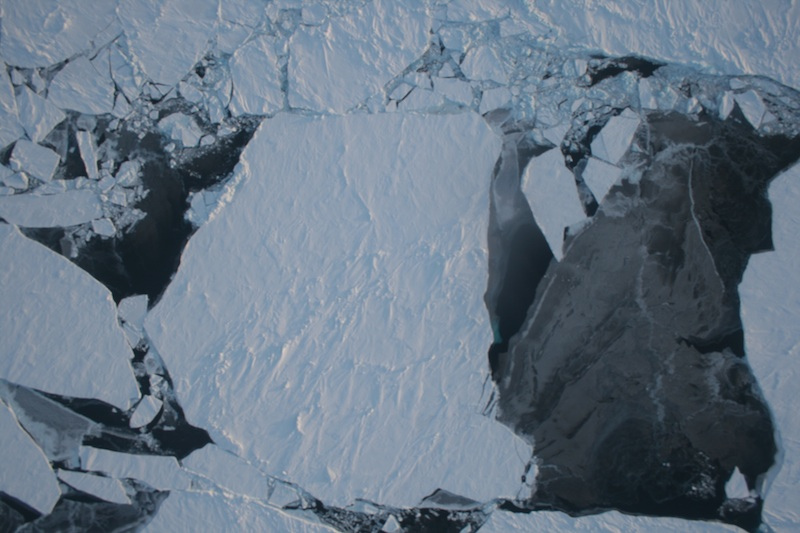
This photograph of sea ice near Greenland was taken on March 18, 2011 from the NASA P3 aircraft. The IceBridge mission is collecting data on ice thickness, an important measure of the health of sea ice. Credit: NASA/ATM automatic Cambot system. High Resolution Image
IceBridge thickness data
Measuring ice thickness is critical to assessing the overall health of Arctic sea ice. The passive microwave data that NSIDC presents here provide only ice extent, a two-dimensional measure of ice cover. But ice can vary in thickness from a few centimeters to several meters, and scientists want to know if the ice pack is thinning overall as well as declining in extent. A new study by NASA scientist Ron Kwok compared ice thickness data collected by airplanes during the ongoing Operation IceBridge with thickness data from the NASA Ice, Cloud and Land Elevation Satellite (ICESat), which ended its mission in 2009. IceBridge is an airborne data-collection mission that started in 2009, in order to bridge the data gap between the first ICESat and ICESat-2, which is scheduled to launch in 2016.
Kwok found good agreement between simultaneous IceBridge and ICESat freeboard measurements made in 2009. Freeboard is the elevation of sea ice above the ocean surface, and provides a measure of ice thickness. These results show that IceBridge measurements will be able to bridge the gap between the ICESat and ICESat-2 satellite missions and add to other ice thickness data from the European Space Association (ESA) Cryosat-2. Satellite measurements of ice thickness provide a third dimension of information on the changing sea ice cover, helping scientists to more accurately assess the amount of sea ice in the Arctic.
Data collected by the IceBridge mission is archived and distributed by the NSIDC IceBridge Data program.
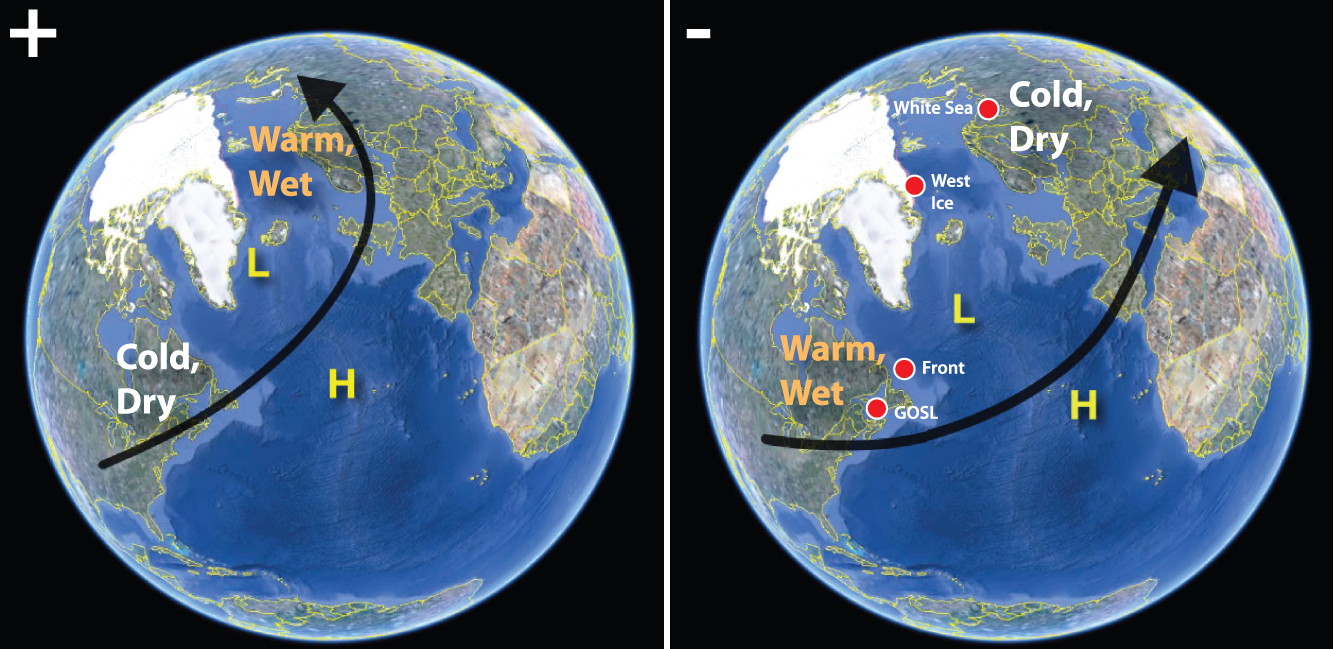
These images show the general effects of the positive phase (left) and negative phase (right) of the NAO. Red dots show the location of harp seal breeding grounds. 
Credit: Johnston et. al., 2012High Resolution Image
Regional ice conditions and harp seals
Many animals rely on sea ice as part of their habitat. Harp seals, for example, give birth to and care for their young on floes of sea ice. Recent research by David Johnston and colleagues at Duke University showed that harp seals in the northwest Atlantic have higher mortality rates during years when the North Atlantic Oscillation (NAO) is in its negative phase, a pattern that favors low ice cover in the Labrador Sea and Gulf of St. Lawrence, where harp seals breed. 
This winter, the NAO has mostly been in a positive phase and ice conditions in the Labrador Sea and Gulf of St. Lawrence have been at near-normal levels. However, in recent years, ice conditions in the region have been very low. The study showed a longer-term decline in sea ice cover of up to 6% per decade across all North Atlantic harp seal breeding grounds since 1979. While harp seals are well-suited to deal with natural short-term shifts in ice conditions, they may not be able to adapt to the combined effects of both short-term variability and long-term climate change.

Wednesday, January 4, 2012

NASA-JPL finds Russian river runoff freshening Canadian Arctic in the Beaufort Sea due to Arctic Oscillation, using GRACE and ICESat data

NASA Finds Russian Runoff Freshening Canadian Arctic

Increasing freshwater on the U.S. and Canadian side of the Arctic from 2005 to 2008 is balanced by decreasing freshwater on the Russian side, so that on average the Arctic did not have more freshwaterIncreasing freshwater on the U.S. and Canadian side of the Arctic from 2005 to 2008 is balanced by decreasing freshwater on the Russian side, so that on average the Arctic did not have more freshwater. Here blue represents maximum freshwater increases and the yellows and oranges represent maximum freshwater decreases. Credit: University of Washington
› Larger view

January 4, 2012
PASADENA, Calif. - A new NASA and University of Washington study allays concerns that melting Arctic sea ice could be increasing the amount of freshwater in the Arctic enough to have an impact on the global "ocean conveyor belt" that redistributes heat around our planet.

Lead author and oceanographer Jamie Morison of the University of Washington's Applied Physics Laboratory in Seattle and his team detected a previously unknown redistribution of freshwater during the past decade from the Eurasian half of the Arctic Ocean to the Canadian half. Yet despite the redistribution, they found no change in the net amount of freshwater in the Arctic that might signal a change in the conveyor belt.

The team attributes the redistribution to an eastward shift in the path of Russian runoff through the Arctic Ocean, which is tied to an increase in the strength of the Northern Hemisphere's west-to-east atmospheric circulation, known as the Arctic Oscillation. The resulting counterclockwise winds changed the direction of ocean circulation, diverting upper-ocean freshwater from Russian rivers away from the Arctic's Eurasian Basin, between Russia and Greenland, to the Beaufort Sea in the Canada Basin bordered by the United States and Canada. The stronger Arctic Oscillation is associated with two decades of reduced atmospheric pressure over the Russian side of the Arctic. Results of the NASA and National Science Foundation funded study will be published January 5, 2012, in the journal Nature.

Between 2003 and 2008, the resulting redistribution of freshwater was equivalent to adding 10 feet (3 meters) of freshwater over the central Beaufort Sea.

The freshwater changes were seen between 2005 and 2008 by combining ocean bottom pressure, or mass, data from NASA's Gravity Recovery and Climate Experiment (GRACE) satellites with ocean height data from NASA's ICESat satellite. By calculating the difference between the two sets of measurements, the team was able to map changes in freshwater content over the entire Arctic Ocean, including regions where direct water sample measurements are not available.

"Knowing the pathways of freshwater is important to understanding global climate because freshwater protects sea ice by helping create a strongly stratified cold layer between the ice and warmer, saltier water below that comes into the Arctic from the Atlantic Ocean," said Morison. "The reduction in freshwater entering the Eurasian Basin resulting from the Arctic Oscillation change could contribute to sea ice declines in that part of the Arctic."

"Changes in the volume and extent of Arctic sea ice in recent years have focused attention on melting ice," said co-author and senior research scientist Ron Kwok of NASA's Jet Propulsion Laboratory, Pasadena, Calif., which manages GRACE for NASA. "The GRACE and ICESat data allow us to now examine the impacts of widespread changes in ocean circulation."

Kwok said, on the whole, Arctic Ocean salinity is similar to what it was in the past, but the Eurasian Basin has become more saline, and the Canada Basin has freshened. In the Beaufort Sea, the water is the freshest it has been in 50 years of record keeping, with only a tiny fraction of that freshwater originating from melting ice and the vast majority coming from Russian river water.

The Beaufort Sea stores more freshwater when an atmospheric pressure system called the Beaufort High strengthens, driving a counterclockwise wind pattern. Consequently, it has been argued that the primary cause of freshening is a strengthening of the Beaufort High, but salinity began to decline early in the 1990s, when the Beaufort High relaxed and the counterclockwise Arctic Oscillation pattern increased.

"We discovered a pathway that allows Russian river runoff to feed the Beaufort gyre," Kwok said. "The Beaufort High is important, but so are the hemispheric-scale effects of the Arctic Oscillation."

"To better understand climate-related changes in sea ice and the Arctic overall, climate models need to more accurately represent the Arctic Oscillation's low pressure and counterclockwise circulation on the Russian side of the Arctic Ocean," Morison added.


Red arrows show the new path of Russian river water into the Canada Basin
Red arrows show the new path of Russian river water into the Canada Basin. The previous freshwater pathway (across the Eurasian Basin toward Greenland and the Atlantic) was altered by atmospheric conditions created by the Arctic Oscillation. Credit: University of Washington 
For more on Grace and ICESat, visit: http://www.csr.utexas.edu/grace/  http://grace.jpl.nasa.gov/ and  http://icesat.gsfc.nasa.gov/icesat/  

Tuesday, July 7, 2009

R. Kwok et al., J. Geophys. Res., 114 (2009): Thinning and volume loss of the Arctic Ocean sea ice cover: 2003–2008

Journal of Geophysical Research - Oceans, 114 (2009) C07005; doi: 10.1029/2009JC005312.

Thinning and volume loss of the Arctic Ocean sea ice cover: 2003–2008

R. Kwok, G. F. Cunningham (Jet Propulsion Laboratory, California Institute of Technology, Pasadena, CA, U.S.A.), M. Wensnahan (Polar Science Center, Applied Physics Laboratory, University of Washington, Seattle, WA, U.S.A.), I. Rigor (Polar Science Center, Applied Physics Laboratory, University of Washington, Seattle, WA, U.S.A.), H. J. Zwally (Cryospheric Sciences Branch, NASA Goddard Space Flight Center, Greenbelt, MD, U.S.A.), and D. Yi (SGT, Inc., NASA Goddard Space Flight Center, Greenbelt, MD, U.S.A.)

Abstract

We present our best estimate of the thickness and volume of the Arctic Ocean ice cover from 10 Ice, Cloud, and land Elevation Satellite (ICESat) campaigns that span a 5-year period between 2003 and 2008. Derived ice drafts are consistently within 0.5 m of those from a submarine cruise in mid-November of 2005 and 4 years of ice draft profiles from moorings in the Chukchi and Beaufort seas. Along with a more than 42% decrease in multi-year (MY) ice coverage since 2005, there was a remarkable thinning of ∼0.6 m in MY ice thickness over 4 years. In contrast, the average thickness of the seasonal ice in midwinter (∼2 m), which covered more than two-thirds of the Arctic Ocean in 2007, exhibited a negligible trend. Average winter sea ice volume over the period, weighted by a loss of ∼3000 km3 between 2007 and 2008, was ∼14,000 km3. The total MY ice volume in the winter has experienced a net loss of 6300 km3 (>40%) in the 4 years since 2005, while the first-year ice cover gained volume owing to increased overall area coverage. The overall decline in volume and thickness are explained almost entirely by changes in the MY ice cover. Combined with a large decline in MY ice coverage over this short record, there is a reversal in the volumetric and areal contributions of the two ice types to the total volume and area of the Arctic Ocean ice cover. Seasonal ice, having surpassed that of MY ice in winter area coverage and volume, became the dominant ice type. It seems that the near-zero replenishment of the MY ice cover after the summers of 2005 and 2007, an imbalance in the cycle of replenishment and ice export, has played a significant role in the loss of Arctic sea ice volume over the ICESat record.

(Received 2 February 2009, accepted 22 April 2009, published 7 July 2009.)

Kwok, R., G. F. Cunningham, M. Wensnahan, I. Rigor, H. J. Zwally, & D. Yi (2009), Thinning and volume loss of the Arctic Ocean sea ice cover: 2003–2008, Journal of Geophysical Research, 114 (2009) C07005; doi:10.1029/2009JC005312.

Link to abstract: http://www.agu.org/pubs/crossref/2009/2009JC005312.shtml

NASA's JPL: New NASA ICESat Satellite Survey Reveals Dramatic Arctic Sea Ice Thinning

NEWS RELEASE: 2009-107 July 7, 2009

New NASA Satellite Survey Reveals Dramatic Arctic Sea Ice Thinning

PASADENA, Calif. – Arctic sea ice thinned dramatically between the winters of 2004 and 2008, with thin seasonal ice replacing thick older ice as the dominant type for the first time on record. The new results, based on data from a NASA Earth-orbiting spacecraft, provide further evidence for the rapid, ongoing transformation of the Arctic's ice cover.

Scientists from NASA and the University of Washington in Seattle conducted the most comprehensive survey to date using observations from NASA's Ice, Cloud and land Elevation Satellite, known as ICESat, to make the first basin-wide estimate of the thickness and volume of the Arctic Ocean's ice cover. Ron Kwok of NASA's Jet Propulsion Laboratory in Pasadena, Calif., led the research team, which published its findings July 7 in the Journal of Geophysical Research-Oceans.

The Arctic ice cap grows each winter as the sun sets for several months and intense cold ensues. In the summer, wind and ocean currents cause some of the ice naturally to flow out of the Arctic, while much of it melts in place. But not all of the Arctic ice melts each summer; the thicker, older ice is more likely to survive. Seasonal sea ice usually reaches about 2 m (6 ft.) in thickness, while multi-year ice averages 3 m (9 ft.).

Using ICESat measurements, scientists found that overall Arctic sea ice thinned about 0.17 m (7 in.) a year, for a total of 0.68 m (2.2 ft.) over four winters. The total area covered by the thicker, older "multi-year" ice that has survived one or more summers shrank by 42%.

Previously, scientists relied only on measurements of area to determine how much of the Arctic Ocean is covered in ice, but ICESat makes it possible to monitor ice thickness and volume changes over the entire Arctic Ocean for the first time. The results give scientists a better understanding of the regional distribution of ice and provide better insight into what is happening in the Arctic.

"Ice volume allows us to calculate annual ice production and gives us an inventory of the freshwater and total ice mass stored in Arctic sea ice," said Kwok. "Even in years when the overall extent of sea ice remains stable or grows slightly, the thickness and volume of the ice cover is continuing to decline, making the ice more vulnerable to continued shrinkage. Our data will help scientists better understand how fast the volume of Arctic ice is decreasing and how soon we might see a nearly ice-free Arctic in the summer."

In recent years, the amount of ice replaced in the winter has not been sufficient to offset summer ice losses. The result is more open water in summer, which then absorbs more heat, warming the ocean and further melting the ice. Between 2004 and 2008, multi-year ice cover shrank 1.54 million km² (595,000 sq. miles) -- nearly the size of Alaska's land area.

During the study period, the relative contributions of the two ice types to the total volume of the Arctic's ice cover were reversed. In 2003, 62% of the Arctic's total ice volume was stored in multi-year ice, with 38% stored in first-year seasonal ice. By 2008, 68% of the total ice volume was first-year ice, with 32% multi-year ice.

"One of the main things that has been missing from information about what is happening with sea ice is comprehensive data about ice thickness," said Jay Zwally, study co-author and ICESat project scientist at NASA's Goddard Space Flight Center in Greenbelt, Md. "U.S. Navy submarines provide a long-term, high-resolution record of ice thickness over only parts of the Arctic. The submarine data agree with the ICESat measurements, giving us great confidence in satellites as a way of monitoring thickness across the whole Arctic Basin."

The research team attributes the changes in the overall thickness and volume of Arctic Ocean sea ice to the recent warming and anomalies in patterns of sea ice circulation.

"The near-zero replenishment of the multi-year ice cover, combined with unusual exports of ice out of the Arctic after the summers of 2005 and 2007, have both played significant roles in the loss of Arctic sea ice volume over the ICESat record," said Kwok.

For images of the Arctic sea ice decline, visit: http://www.nasa.gov/topics/earth/features/icesat-20090707.html .

For more information about ICESat, visit: http://icesat.gsfc.nasa.gov .

For more information about NASA and agency programs, visit: http://www.nasa.gov .

JPL is managed for NASA by the California Institute of Technology in Pasadena.

Alan Buis (818) 354-0474, Jet Propulsion Laboratory, Pasadena, CA. Alan.buis@jpl.nasa.gov

Steve Cole (202) 358-0918, NASA Headquarters, Washington. Stephen.e.cole@nasa.gov

-end-