Blog Archive

Showing posts with label North Atlantic Oscillation. Show all posts

Monday, June 17, 2013

Jet stream changes cause climatically exceptional Greenland Ice Sheet melt


The research team at the GrISThe edge of the GrIS.
from University of Sheffield News, June 17, 2013

Research from the University of Sheffield has shown that unusual changes in atmospheric jet stream circulation caused the exceptional surface melt of the Greenland Ice Sheet (GrIS) in summer 2012.


An international team led by Professor Edward Hanna from the University of Sheffield’s Department of Geography used a computer model simulation (called SnowModel) and satellite data to confirm a record surface melting of the GrIS for at least the last 50 years -- when on 11 July 2012 more than 90% of the ice-sheet surface melted. This far exceeded the previous surface melt extent record of 52% in 2010.
The team also analysed weather station data from on top of and around the GrIS, largely collected by the Danish Meteorological Institute but also by US programmes, which showed that several new high Greenland temperature records were set in summer 2012.
The research, published today in the International Journal of Climatology, clearly demonstrates that the record surface melting of the GrIS was mainly caused by highly unusual atmospheric circulation and jet stream changes, which were also responsible for last summer's unusually wet weather in England.
The analysis shows that ocean temperatures and Arctic sea-ice cover were relatively unimportant factors in causing the extra Greenland melt.
Professor Hanna said: “The GrIS is a highly sensitive indicator of regional and global climate change, and has been undergoing rapid warming and mass loss during the last 5-20 years. Much attention has been given to the NASA announcement of record surface melting of the GrIS in mid-July 2012. This event was unprecedented in the satellite record of observations dating back to the 1970s and probably unlikely to have occurred previously for well over a century.
“Our research found that a ‘heat dome’ of warm southerly winds over the ice sheet led to widespread surface melting. These jet stream changes over Greenland do not seem to be well captured in the latest Intergovernmental Panel on Climate Change (IPCC) computer model predictions of climate change, and this may indicate a deficiency in these models. According to our current understanding, the unusual atmospheric circulation and consequent warm conditions of summer 2012 do not appear to be climatically representative of future ‘average’ summers predicted later this century.
“Taken together, our present results strongly suggest that the main forcing of the extreme GrIS surface melt in July 2012 was atmospheric, linked with changes in the summer North Atlantic Oscillation (NAO), Greenland Blocking Index (GBI: a high-pressure system centred over Greenland) and polar jet stream which favoured southerly warm air advection along the western coast.
“The next 5-10 years will reveal whether or not 2012 was a rare event resulting from the natural variability of the NAO or part of an emerging pattern of new extreme high melt years. Because such atmospheric, and resulting GrIS surface climate, changes are not well projected by the current generation of global climate models, it is currently very hard to predict future changes in Greenland climate. Yet it is crucial to understand such changes much better if we are to have any hope of reliably predicting future changes in GrIS mass balance, which is likely to be a dominant contributor to global sea-level change over the next 100-1,000 years.”

Friday, March 29, 2013

Stefan Rahmstorf: Arctic sea ice and cold weather in Northern Europe and Northeastern U.S.

Melting Ice and Cold Weather
Translated by the inestimable Eli Rabett from an article by Stefan Rahmstorf  [] are translation notes, March 29, 2013

The media are debating if the decrease in  Arctic ice  is related to this winter's cold weather in Germany. This post discusses the most recent current research about this including the most important figures from relevant studies.

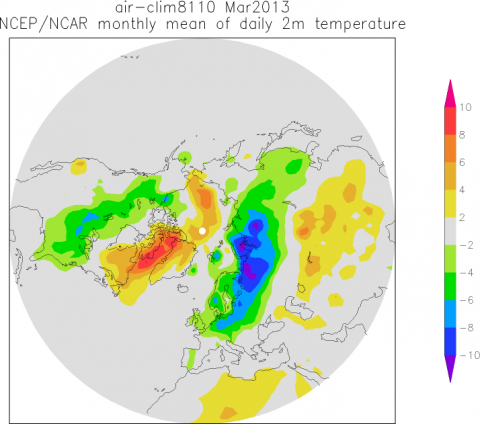
First, what does the unusual temperature distribution observed this March actually look like? Here is a map showing the data (up to and including March 25, 2013; NCEP / NCAR data plotted with KNMI Climate Explorer):
 
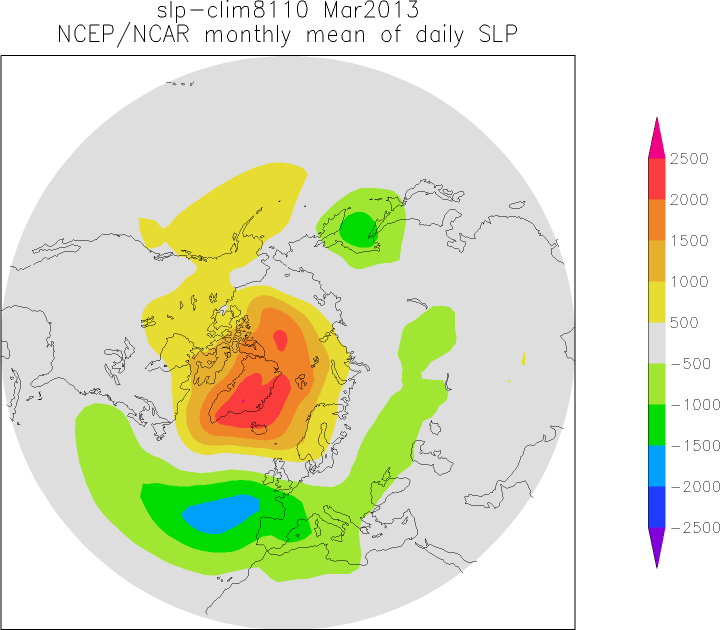
Freezing cold in Siberia, reaching across northwestern Europe, unusually mild temperatures over the Labrador Sea and parts of Greenland and a cold band diagonally across North America, from Alaska to Florida. Averaged over the Northern Hemisphere, the anomaly disappears - the average is close to the long-term average. Of course, the distribution of hot and cold is related to atmospheric circulation, and thus the air pressure distribution. The air pressure anomaly looks like this:

There was unusually high air pressure between Scandinavia and Greenland. Since circulation around a high flows is clockwise [anticyclone], this explains the influx of arctic cold air in Europe and the warm Labrador Sea. 

Arctic sea ice

Let us now discuss the Arctic sea ice.  The summer minimum in September set a
new record low, but also at the recent winter maximum there was unusually little ice (ranking 6th lowest - the ten years with the lowest ice extent were all in the last decade). The ice cover in the Barents sea was particularly low this winter.  All in all until March the deficit was  about the size of Germany compared  to the long-term average. Is there a connection with the winter weather?

Is there a relationship with the winter weather?  Did the disappearing ice influence the atmospheric circulation, because the open ocean, strongly heated the Arctic atmosphere from below?  (The water is much warmer than the overlying cold polar air.) Did the resulting evaporation of sea water moisten the air and thus lead to more snow? These questions have been investigated by several studies in recent years, .

Petoukhov and Semenov, (JGR 2010)

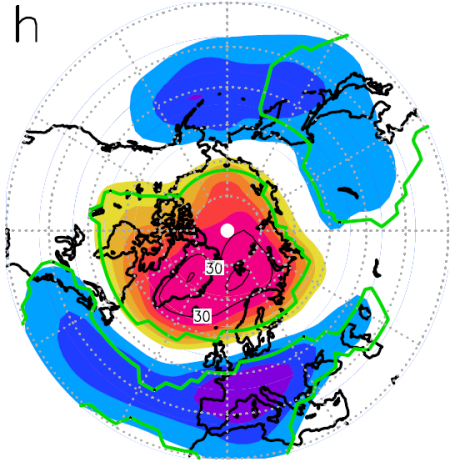
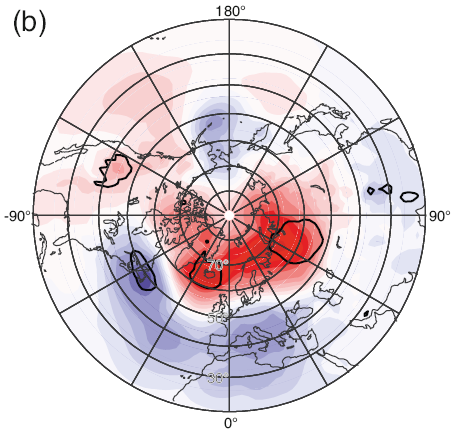
These two scientists from the Potsdam Institute and the Leibniz Institute of Marine Sciences in Kiel used the ECHAM5 atmospheric model.  As a boundary condition in a series of simulations they reduced ice cover in the Barents and the adjacent Kara Seas. With a mean reduction in ice volume similar to what we now see, they calculated the anomaly in the pressure distribution shown below:

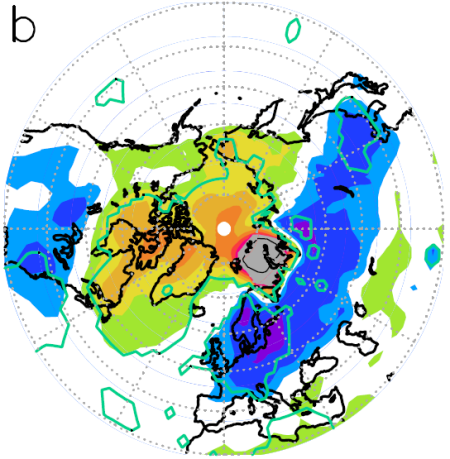
Thus, abnormally high air pressure between Scandinavia and Greenland. Leading to the following temperature anomaly:


Cold from Siberia to Western Europe and a heat bubble centered on Labrador - quite similar to the temperatures this March.

Jaiser et al. (Tellus 2012)

Our colleagues from the Alfred Wegener Institute, together with U.S. researchers, examined the question of whether one finds this relationship in observational data. For this purpose, they investigated the correlation between the distribution of air pressure distribution and ice cover in an analysis of their covariance. They concluded: 
Our analysis suggests that Arctic sea ice concentration changes exert a remote impact on the large-scale atmospheric circulation during winter 
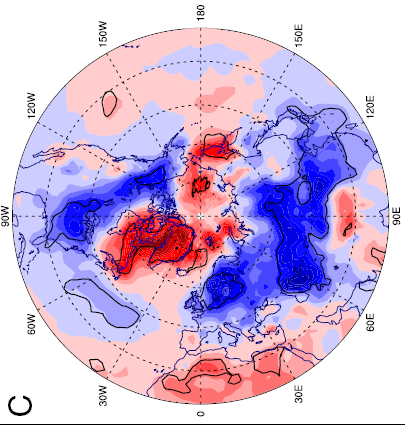
The following graph from this work shows how the distribution of air pressure in winter changes between phases of low and high fall-ice cover in the Arctic:

You can see that low ice cover correlates with high pressure in the Arctic winter, again between Scandinavia and Greenland - just as in the model calculations of Petoukhov and Semenov (Jaiser et al. do not show temperature maps).

Liu et al. (PNAS 2012)

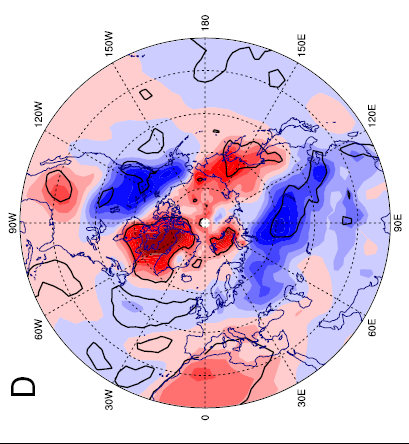
Next on the dance card is a study which appeared shortly thereafter by researchers from the U.S. and China, which approached the problem from both sides: model simulations and data analysis. The following map shows the linear regression between less ice cover in autumn and winter the temperature in the following:

Again, these temperature anomalies are similar to the two shown above, the temperature map for this March and that from the model of Petoukhov and Semenov.

An observed correlation (as in this diagram and in Jaiser et al.) is still not a causal connection, therefore Liu et al. also made a series of model calculations, but with a different model (the American model from NCAR). Further, they calculated a larger ensemble (20 runs with varying initial conditions), which makes the results statistically more robust. As a boundary condition in the model they took the observed reduction of the ice cover in the Arctic and calculated ensembles with or without the ice decrement. The result of these simulations for the temperature is as follows:

Again cold in Siberia and Europe, warmer over the Labrador Sea, and a cold band across North America. From the model, we know that it's not just a correlation, but a causal relationship: In the model setting the initial ice cover results in cold temperatures over Europe, just as in Petoukhov and Semenov. The associated air pressure maps are similar. 

Liu et al. also have dealt with whether alternatively the Arctic Oscillation (AO) or the North Atlantic Oscillation (NAO) could explain the temperature anomalies.  They showed that these natural oscillations lead to different spatial patterns and inter-annual fluctuations - they close out those arguments as causes. 

They also have examined the relationship with snow and come to the conclusion that additional open water in the Arctic humidifies the air, leading to increased snowfall.  The snowpack is important because even the strong March sun can hardly heat up snow-covered land; the white surface simply reflects the sun's rays. According to Liu et al.:
 We conclude that the recent decline of Arctic sea ice has played a critical role in the recent cold and snowy winters. 
However, the taz quoted [German paper] yesterday the spokesman of the German Weather Service [DWD in German] as saying that if there was a direct relationship with the sea ice cover,  the entire winter would have to be very cold in Germany.  I think this trivial argument with which he would like to wipe from the table the climate research results shown above is pretty embarrassing for the DWD.  Of course open water in the Arctic  does not override the stochastic weather patterns.  There will always be warm and cold periods. In all these studies it comes down to changing probabilities in the prevailing weather patterns: Petoukhov and Semenov estimate that the probability of cold winter extremes could triple, that is even in the Abstract. One wonders whether the DWD representative has read the relevant studies at all - and if not, why he feels the urge to comment on them in the media. Unfortunately, there is a certain tradition that meteorologists dealing with weather are not familiar with climate science. 

In my view, the above studies provide strong evidence for a link between Arctic ice loss due to global warming, more frequent winter high-pressure air masses, especially over the Atlantic-European part of the Arctic, and an associated influx of cold air to Europe. As we have often seen in recent winters - for example in a spectacular way in the first half of February 2012

Still this is not a slam dunk - the studies are relatively new and need to be discussed intensively in the professional community and confirmed by further research, or perhaps again questioned. This is the normal process of scientific debate, through which at the end findings are robust and widely accepted, such as the fact that our emissions of greenhouse gases warm the climate. 

P.S. (29.3.) I see now that
the climate lie detector has put its finger on the wonderful products of the Welt Online, which a few days ago once again presented the proverbial "Russian scientists who predict an ice age" warning of a "frozen pig cycle."  There is no better way of actually disproving the theories of  solar fluctuations, when even diehard "climate skeptics" can not find any more respectable arguments. This time, even sponsored by Gazprom (for real!).  Anyone interested in the subject of climate and sun could read What role does the sun play? [Maybe Eli will translate some day for some carrots.]
References

Jaiser R, Dethloff K, Handorf D, Rinke A, Cohen J (2012) Impact of sea ice cover changes on the Northern Hemisphere winter atmospheric circulation.Tellus Series A-Dynamic Meteorology and Oceanography 64th doi: 10.3402/tellusa.v64i0.11595

Liu JP, Curry JA, Wang HJ, Song MR, Horton RM (2012) Impact of declining Arctic sea ice on winter snowfall. Proceedings of the National Academy of Sciences of the United States of America 109 (11):4074-4079; doi: 10.1073/pnas.1114910109

Petoukhov V, Semenov VA (2010) A link between reduced Barents-Kara sea ice and cold winter extremes over northern continents. Journal of Geophysical Research-Atmospheres 115th doi: 10.1029/2009jd013568

Thursday, September 13, 2012

RADIO ECOSHOCK ARCTIC ICE MELT SPECIAL with Jennifer Francis, Mark Serreze and Cecelia Bitz


ARCTIC MELT DOWN Scientists Speak Out

 In 2012, the Arctic Sea Ice hit a stunning new record low. Rutgers scientist Jennifer Francis explains how this changes weather for billions of people in the Northern Hemisphere. Plus the Director of the Snow and Ice Data Center, Mark Serreze on record and what it means, and analysis from polar scientist Jennifer Bitz, U of Washington. In depth, direct from top scientists. Radio Ecoshock 120912 1 hour.

DOWNLOAD/LISTEN TO THE WHOLE RADIO ECOSHOCK ARCTIC ICE MELT SPECIAL (1 HOUR):  CD QUALITY      Lo-fi

It's been called the Arctic Death Spiral. All time-lows for polar sea ice have been shattered this year.

A new record Arctic sea ice melt-back occurred in August 2012 (a month earlier than ever before), with more to come in September. To me, this may be the largest single impact of human activity on the planet. It's hard to exaggerate how big this story is.

In early September, it looks like the last of the Arctic ice is hovering around the large chain of islands in the Canadian Arctic, to the West of Greenland. The West side of the Arctic Ocean is wide open, the fabled Northwest Passage along the Canadian Coast is clear with some ice around McClure Straight. The sea ice has melted away from the entire Russian coast along Siberia.

Sooner or later, there will be no sea ice in the Arctic in the summer months. Professor Peter Wadhams of Cambridge, previously a guest on Radio Ecoshock, now predicts we could see that open Arctic Ocean as soon as 2015.

All the 24-hour power of the summer sun will pour into the polar ocean, instead of being reflected back into space. A new article in the journal Nature reports parts of Arctic Siberia are already releasing far more carbon dioxide and methane than previously thought.

The National Snow and Ice Data Center (NSIDC) says lack of sea ice could drive heat up to 900 miles further inland, threatening to melt the permafrost. Most scientists agree that would trigger runaway global warming, well beyond anything humans could do to stop it.

It's an Arctic Emergency, plain and simple - a warning sign Earth's climate is tipping into a new hothouse age.

We need all the facts we can get, and I've lined up three of the best scientists for this week's show. We'll talk with atmospheric scientist and polar expert Dr. Cecilia Bitz from the University of Washington. We'll get the latest figures, and tips for tracking the polar ice yourself - from the Director of the National Sea and Ice Data Center, Dr. Mark Serreze.

But first, I want you to hear the Rutgers University scientist who is stirring up meteorologists, TV weather people, and government insiders. Dr. Jennifer Francis says the melt-back of Arctic sea ice is already affecting the climate of the whole Northern Hemisphere.

DOWNLOAD ALL OUR INTERVIEWS SEPARATELY HERE:

JENNIFER FRANCIS, RUTGERS:  CD Quality    Lo-Fi

MARK SERREZE, NATIONAL SNOW AND ICE DATA CENTER:  CD Quality  Lo-Fi

CECELIA BITZ, UNIVERITY OF WASHINGTON:  CD Quality   Lo-Fi
JENNIFER FRANCIS is a Research Professor at the Institute of Marine and Coastal Sciences, at Rutgers University, in New Jersey. She is an atmospheric scientist who specializes in the Arctic. Dr. Francis has many published papers, and don't miss her important presentation on YouTube from the Weather and Climate Summit, held at Breckenridge, Colorado, in January 2012. The New York Times also interviewed her about a new observation: melting Arctic sea ice has changed our weather further south.

The idea that sea ice could modify weather in the American Midwest, the UK or China, is hard to grasp. In school, we were never taught about waves and rivers in the atmosphere, like the Rossby waves or the Jet Stream.

Spend the time on this in-depth video: Jennifer Francis presenting at the Weather and Climate Summit last January. Pretend you are going back to college - to find out how the world works now that global warming is melting the Arctic. You'll be surprised how much sense strange winters, and the daily weather forecast starts to make sense, after you've seen this.

One big surprise for me in this Jennifer Francis interview: I assumed that the summer sea ice melt would be a driving factor in things like the record heat waves in the U.S. this past summer, the big drought there, and the wet summer in the UK and Northern Europe. But Francis says the main impact of less sea ice comes as the ice refreezes. That releases heat, builds up a big high pressure zone around the poles and impacts WINTER WEATHER in the Northern Hemisphere.

The summer weather, Francis suggests, is more changed by the record early snow melt in Arctic lands this spring and summer. Mark Serreze confirms there was a record snow melt this year, exposing a lot of land across Russia, Canada and Alaska to much more heat. That is one of the biggest unreported stories of this year. We've all be staring that sea ice melt, without also looking at the huge melt back of snow, much earlier than normal, on land.

We've heard warnings that retreating ice means a change in the salt content of the sea, which could produce more climate changes, if the Gulf Stream warming New England and Northern Europe weakens. Jennifer Francis says that is such a slow long-term process, we don't have to focus on that now. It can be a positive feed-back loop as changes in the ocean develop but not a big change. The movie "The Day After Tomorrow" looked impressive, but it's simply not possible to see such a big change in a small time scale. We can dial that down - for now!

Finally, I asked Dr. Francis how other scientists are receiving the theory her group proposed. She replied it's not so much a "theory" as a paper of observations. That is, their science is not based on models but on actual reporting of events in the Arctic, and the behavior of the Jet Stream.

Frankly, this year's record melt of the summer sea ice leaves me with a sense or horror. Dr. Francis says we should all be shocked and worried about such a big change in the way Earth systems work.
MARK SERREZE When it comes to the Arctic, one of the first stops for both media and scientists is the National Snow and Ice Data Center in Boulder, Colorado.

Radio Ecoshock is pleased to have as our guest the NSIDC Director and Senior Research Scientist, Dr. Mark Serreze.

The capability scientists ask for most is for better ways to measure that ice thickness. Is the United States working on improved ice monitoring? Yes, Serreze tells us - but the most useful satellite for measuring Arctic ice is no longer there - and the next one won't be launched until 2016.

We also discuss the fact that America has only one operational polar class ice breaker. Russia has about 17. The U.S. rents a Russian icebreaker just to reach their Antarctic base. All the scientists I talked to would like to see at least one more Arctic icebreaker - especially if there is going to be more ship traffic and oil drilling in the Arctic.

You might think with less ice we need fewer icebreakers - but Serreze explains why the need is greater than ever. To build a new icebreaker could cost as much as half a billion dollars - money that might be hard to find in these fiscally challenged days. It's possible there might be no search and rescue, security patrols, or oil spill cleanup help from the United States.

Way back in June 2008, the NSIDC warned heat from the Arctic Ocean could penetrate up to 900 miles inland! Let's take a snip from that release.

MEDIA ADVISORY: Permafrost Threatened by Rapid Retreat of Arctic Sea Ice, NCAR/NSIDC Study Finds

"The findings point to a link between rapid sea ice loss and enhanced rate of climate warming, which could penetrate as far as 900 miles inland. In areas where permafrost is already at risk, such as central Alaska, the study suggests that periods of abrupt sea ice loss can lead to rapid soil thaw.

Thawing permafrost may have a range of impacts, including buckled highways and destabilized houses, as well as changes to the delicate balance of life in the Arctic. In addition, scientists estimate that Arctic soils hold at least 30 percent of all the carbon stored in soils worldwide. While scientists are uncertain what will happen if this permafrost thaws, it has the potential to contribute substantial amounts of greenhouse gases to the atmosphere.
"

As wrap up the Serreze interview, he gives us all helpful tips on how to use their fabulous web site to keep tabs on the Arctic. There are easy to click maps and information sheets for the non-scientist. If you have the expertise, you can even download their raw data to run your own models. It's a tremendous resource.

CECELIA BITZ  Our last guest on this Radio Ecoshock Arctic special is Dr. Cecilia Bitz. At the University of Washington, she is Associate Professor in the Atmospheric Sciences Department, an Affiliate Physicist for the Polar Science Center, and part of the Program on Climate Change.

Dr. Bitz studies the role of sea ice in the climate system and its impacts on wildlife. She's also investigating Arctic ice in past climate change, and works with models attempting to predict the future.

I ask her how we know global warming is causing this Arctic ice disaster, and not some other force, like Sun spots, or natural ocean changes. It turns out about 30% of the record melt of sea ice is due to natural causes - particularly the North Atlantic Oscillation.

But the other 70%, according to Bitz and many other experts, is due to human made climate change.

I find it interesting to note another scientist at the University of Washington, Jinlun Zhang, points out Antarctic Sea ice has NOT retreated, and temperatures have not risen there very much. Why is the Arctic experiencing astonishing change, while most of Antarctica is not? Bitz says the West Antarctic Peninsula is experiencing extreme warming and ice loss. But the main part of the Antarctic continent is surrounded by oceans, unlike the Arctic Ocean surrounded by big land masses. That is the principal difference. The details also include the different mixing patterns and currents around Antarctica. That Southern Pole will lag significantly behind the Arctic, when it comes to global warming.

I know Cecilia Bitz works on climate models. The Intergovernmental Panel on Climate Change was not alone in missing how quickly this sea ice melt happened. If climate models serve as our eyes into the future, why did they fail us, and what can we do to improve them? We discuss that.

It's a pleasure to talk over the whole Arctic situation with such a scientist.

OTHER NOTES FROM THE FORMER ARCTIC

Arctic methane - new study says methane from the Arctic "an order of magnitude larger" than previously estimated, from Eastern Siberian sea.

George Monbiot has some really handy Arctic facts in this column in the Guardian newspaper (UK)

DON'T WORRY, OIL COMPANIES ARE HAPPY TO DRILL IN THE NEWLY OPENED ARCTIC OCEAN

Is the Arctic Ocean set to warm and change the world climate? Never mind. Big oil is getting ready to party. Greenpeace warns Arctic drilling will tip the planet into weather extremes, and spills there can never be cleaned up. I play a quick clip from Greenpeace saying oil drilling in the Arctic, now that oil burning has destroyed the summer sea ice, is "obscene."

That is followed by a slice from Democracy Now, as host Amy Goodman interviews Greenpeace Director Kumi Naidoo. He is live on the deck of the Russian Gazprom Arctic drilling rig, doing what Executive Directors never do. Naidoo is hanging under a high pressure fire hose, as the activist group protests that ice-hardened Russian drilling rig.

Greenpeace protesters were also arrested in Moscow, in a concerted effort to wake up the Russian public to the threat of Arctic oil drilling.

WE ARE OUT OF TIME

We're out of time. Maybe really out of time - for the sea ice, for the polar bears, for the Arctic environment, for the climate as we know it. I urge you to wake up your neighbors, your local and regional politicians, your national candidates. Don't shut up. Pass on the news, talk it up, blog it up, use social media and all the media.

Make copies of this program, to play for groups, or just hand them out on CD. Download it free from the Radio Ecoshock web site at ecoshock.org.

See you next week, as we head to air-conditioned Hell. Then we'll transition to real local solutions where you can play a big part.

I'm Alex Smith. Thanks for listening, and caring about your world.

http://www.ecoshock.info/2012/09/arctic-melt-down-scientists-speak-out.html

Sunday, August 26, 2012

"The atmospheric response to three decades of observed Arctic sea ice loss ," by J. A. Screen, I. Simmonds, C. Deser & R. Tomas, Journal of Climate (2012); doi: http://dx.doi.org/10.1175/JCLI-D-12-00063.1


The atmospheric response to three decades of observed Arctic sea ice loss

James A. Screen* and Ian Simmonds (School of Earth Sciences, University of Melbourne, Melbourne, Victoria, Australia) and 
Clara Deser and Robert Tomas 
(Climate and Global Dynamics, National Center for Atmospheric Research, Boulder, CO, U.S.A.)

Abstract

Arctic sea ice is declining at an increasing rate with potentially important repercussions. In order to understand better the atmospheric changes that may have occurred in response to Arctic sea ice loss, we present results from atmospheric general circulation model (AGCM) experiments in which the only time-varying forcings prescribed were observed variations in Arctic sea ice and accompanying changes in Arctic sea surface temperatures from 1979 to 2009. We utilize two independent AGCMs in order to assess the robustness of the response across different models. The results suggest that the atmospheric impacts of Arctic sea ice loss have been manifest most strongly within the maritime and coastal Arctic, and in the lower-most atmosphere. Sea ice loss has driven increased energy transfer from the ocean to the atmosphere, enhanced warming and moistening of the lower troposphere, has decreased the strength of the surface inversion, and increased lower-tropospheric thickness; all these changes are most pronounced in autumn and early winter (September-December). The early winter (November-December) atmospheric circulation response resembles the negative phase of the North Atlantic Oscillation (NAO); however, the NAO-type response is quite weak and is often masked by intrinsic (unforced) atmospheric variability. We also find some evidence of a late winter (March-April) polar stratospheric cooling response to sea ice loss, which may have important implications for polar stratospheric ozone concentrations. The attribution and quantification of other aspects of the possible atmospheric response are hindered by model sensitivities and large intrinsic variability. The potential remote responses to Arctic sea ice change are currently hard to confirm and remain uncertain.

Wednesday, August 1, 2012

"Greenland ice sheet albedo feedback: thermodynamics and atmospheric drivers," by J. E. Box, X. Fettweis, J. C. Stroeve, M. Tedesco, D. K. Hall & K. Steffen

The Cryosphere Discuss. 


Greenland ice sheet albedo feedback: thermodynamics and atmospheric drivers


J. E. Box(1,2,*), X. Fettweis(3), J. C. Stroeve(4,5), M. Tedesco(6), D. K. Hall(7) and K. Steffen(5)


1Department of Geography, The Ohio State University, Columbus, OH, USA
2Byrd Polar Research Center, The Ohio State University, Columbus, OH, USA
3Department of Geography, University of Liege, Belgium
4National Snow and Ice Data Center, Boulder, CO, USA
5Cooperative Institute for Research in Environmental Sciences,
University of Colorado, Boulder, CO, USA
6The City University of New York, New York, NY, USA
7NASA Goddard Space Flight Center, Greenbelt, MD, USA


*Correspondence: box.11@osu.edu


Abstract

Greenland ice sheet mass loss has accelerated in the past decade responding to combined glacier discharge and surface melt water runoff increases. During summer, absorbed solar energy, modulated at the surface primarily by albedo, is the dominant factor governing surface melt variability in the ablation area. Using satellite–derived surface albedo with calibrated regional climate modeled surface air temperature and surface downward solar irradiance, we determine the spatial dependence and quantitative impact of the ice sheet albedo feedback over twelve summer periods beginning in 2000. We find that while albedo feedback defined by the change in net solar shortwave flux and temperature over time is positive over 97% of the ice sheet, when defined using paired annual anomalies, a second order negative feedback is evident over 63% of the accumulation area. This negative feedback damps the accumulation area response to warming due to a positive correlation between snowfall and surface air temperature anomalies. Positive anomaly–gauged feedback concentrated in the ablation area  accounts for more than half of the overall increase in melting when satellite derived melt duration is used to define the timing when net shortwave flux is sunk into melting. Abnormally strong anticyclonic circulation, associated with a persistent summer North Atlantic Oscillation extreme since 2007 enabled three amplifying mechanisms to maximize the albedo feedback: (1) increased warm (south) air advection along the western ice sheet increased surface sensible heating that in turn enhanced snow grain metamorphic rates, further reducing albedo; (2) increased surface downward shortwave flux, leading to more surface heating and further albedo reduction; and (3) reduced snowfall rates sustained low albedo, maximizing surface solar heating, progressively lowering albedo over multiple years. The summer net infrared and solar radiation for the high elevation accumulation area approached positive values during this period. Thus, it is reasonable  to expect 100% melt area over the ice sheet within another similar decade of warming.


http://bprc.osu.edu/~jbox/temp/Box%20et%20al.%202012%20-%20TCD%20-%20resubmitted%20after%20review%20round%202.pdf

Thursday, March 15, 2012

NSIDC, Arctic Sea Ice Report of March 6, 2012: February ice extent low in the Barents Sea, high in the Bering Sea

February ice extent low in the Barents Sea, high in the Bering Sea

As in January, sea ice extent in February was low on the Atlantic side of the Arctic, but unusually high on the Pacific side of the Arctic, remaining lower than average overall. At the end of the month, ice extent rose sharply, as winds changed and started spreading out the ice cover.
Sea ice extent in late winter can go up and down very quickly, getting pushed together or dispersed by strong winds. Ice extent usually reaches its annual maximum sometime in late February or March, but the exact date varies widely from year to year.
Arctic sea ice extent for February 2012 was 14.56 million square kilometers (5.62 million square miles). The magenta line shows the 1979 to 2000 median extent for that month. The black cross indicates the geographic North Pole. Sea Ice Index data. Credit: National Snow and Ice Data Center. High Resolution Image
Overview of conditions
Arctic sea ice extent in February 2012 averaged 14.56 million square kilometers (5.62 million square miles). This is the fifth-lowest February ice extent in the 1979 to 2012 satellite data record, 1.06 million square kilometers (409,000 square miles) below the 1979 to 2000 average extent.
Continuing the pattern established in January, conditions differed greatly between the Atlantic and Pacific sides of the Arctic. On the Atlantic side, especially in the Barents Sea, air temperatures were higher than average and ice extent was unusually low. February ice extent for the Barents Sea was the lowest in the satellite record.  Air temperatures over the Laptev, Kara and Barents seas ranged from 4-8 C (7-14 F) above average at the 925 hectopascal (hPa) level (about 3,000 feet above sea level).  In contrast, on the Pacific side, February ice extent in the Bering Sea was the second highest in the satellite record, paired with air temperatures that were 3-5 C (5-9 F) below average at the 925 hPa level.
graph showing years and ice extent
The graph above shows daily Arctic sea ice extent as of March 5, 2012, along with the ice extents for the previous four years. 2011 is shown in light blue, 2010 is in pink, 2009 in dark blue, 2008 is in purple, and 2007, the year with the record low minimum, is dashed green. The gray area around the average line shows the two standard deviation range of the data. Sea Ice Index data.  Credit: National Snow and Ice Data Center. High Resolution Image
Conditions in context
Overall, the Arctic gained 956,000 square kilometers (369,000 square miles) of ice during the month. This was 486,000 square kilometers (188,000 square miles) more than the average ice growth for February 1979 to 2000. The overall low ice extent for the month stemmed mostly from the low ice extent in the Barents Sea: the extensive ice in the Bering Sea was not enough to compensate. On average, the Barents Sea has 865,000 square kilometers (334,000 square miles) of ice for the month of February. This year there were only 401,000 square kilometers (155,000 square miles) of ice in that region, the lowest recorded in the satellite data record.
At the end of February, ice extent rose sharply. Data from the NSIDC Multisensor Analyzed Sea Ice Extent (MASIE) showed that the rise came mainly from the Bering Sea and Baffin Bay. In the Bering Sea and Baffin Bay, winds pushed the ice extent southward. Ice growth in the Kara Sea also contributed to the rise in ice extent. In the Kara Sea, westerly winds that had been keeping the area ice-free shifted, allowing the open water areas to freeze over. During late winter, ice extent can change quickly as winds push extensive ice cover together, or spread out ice floes over a greater area.
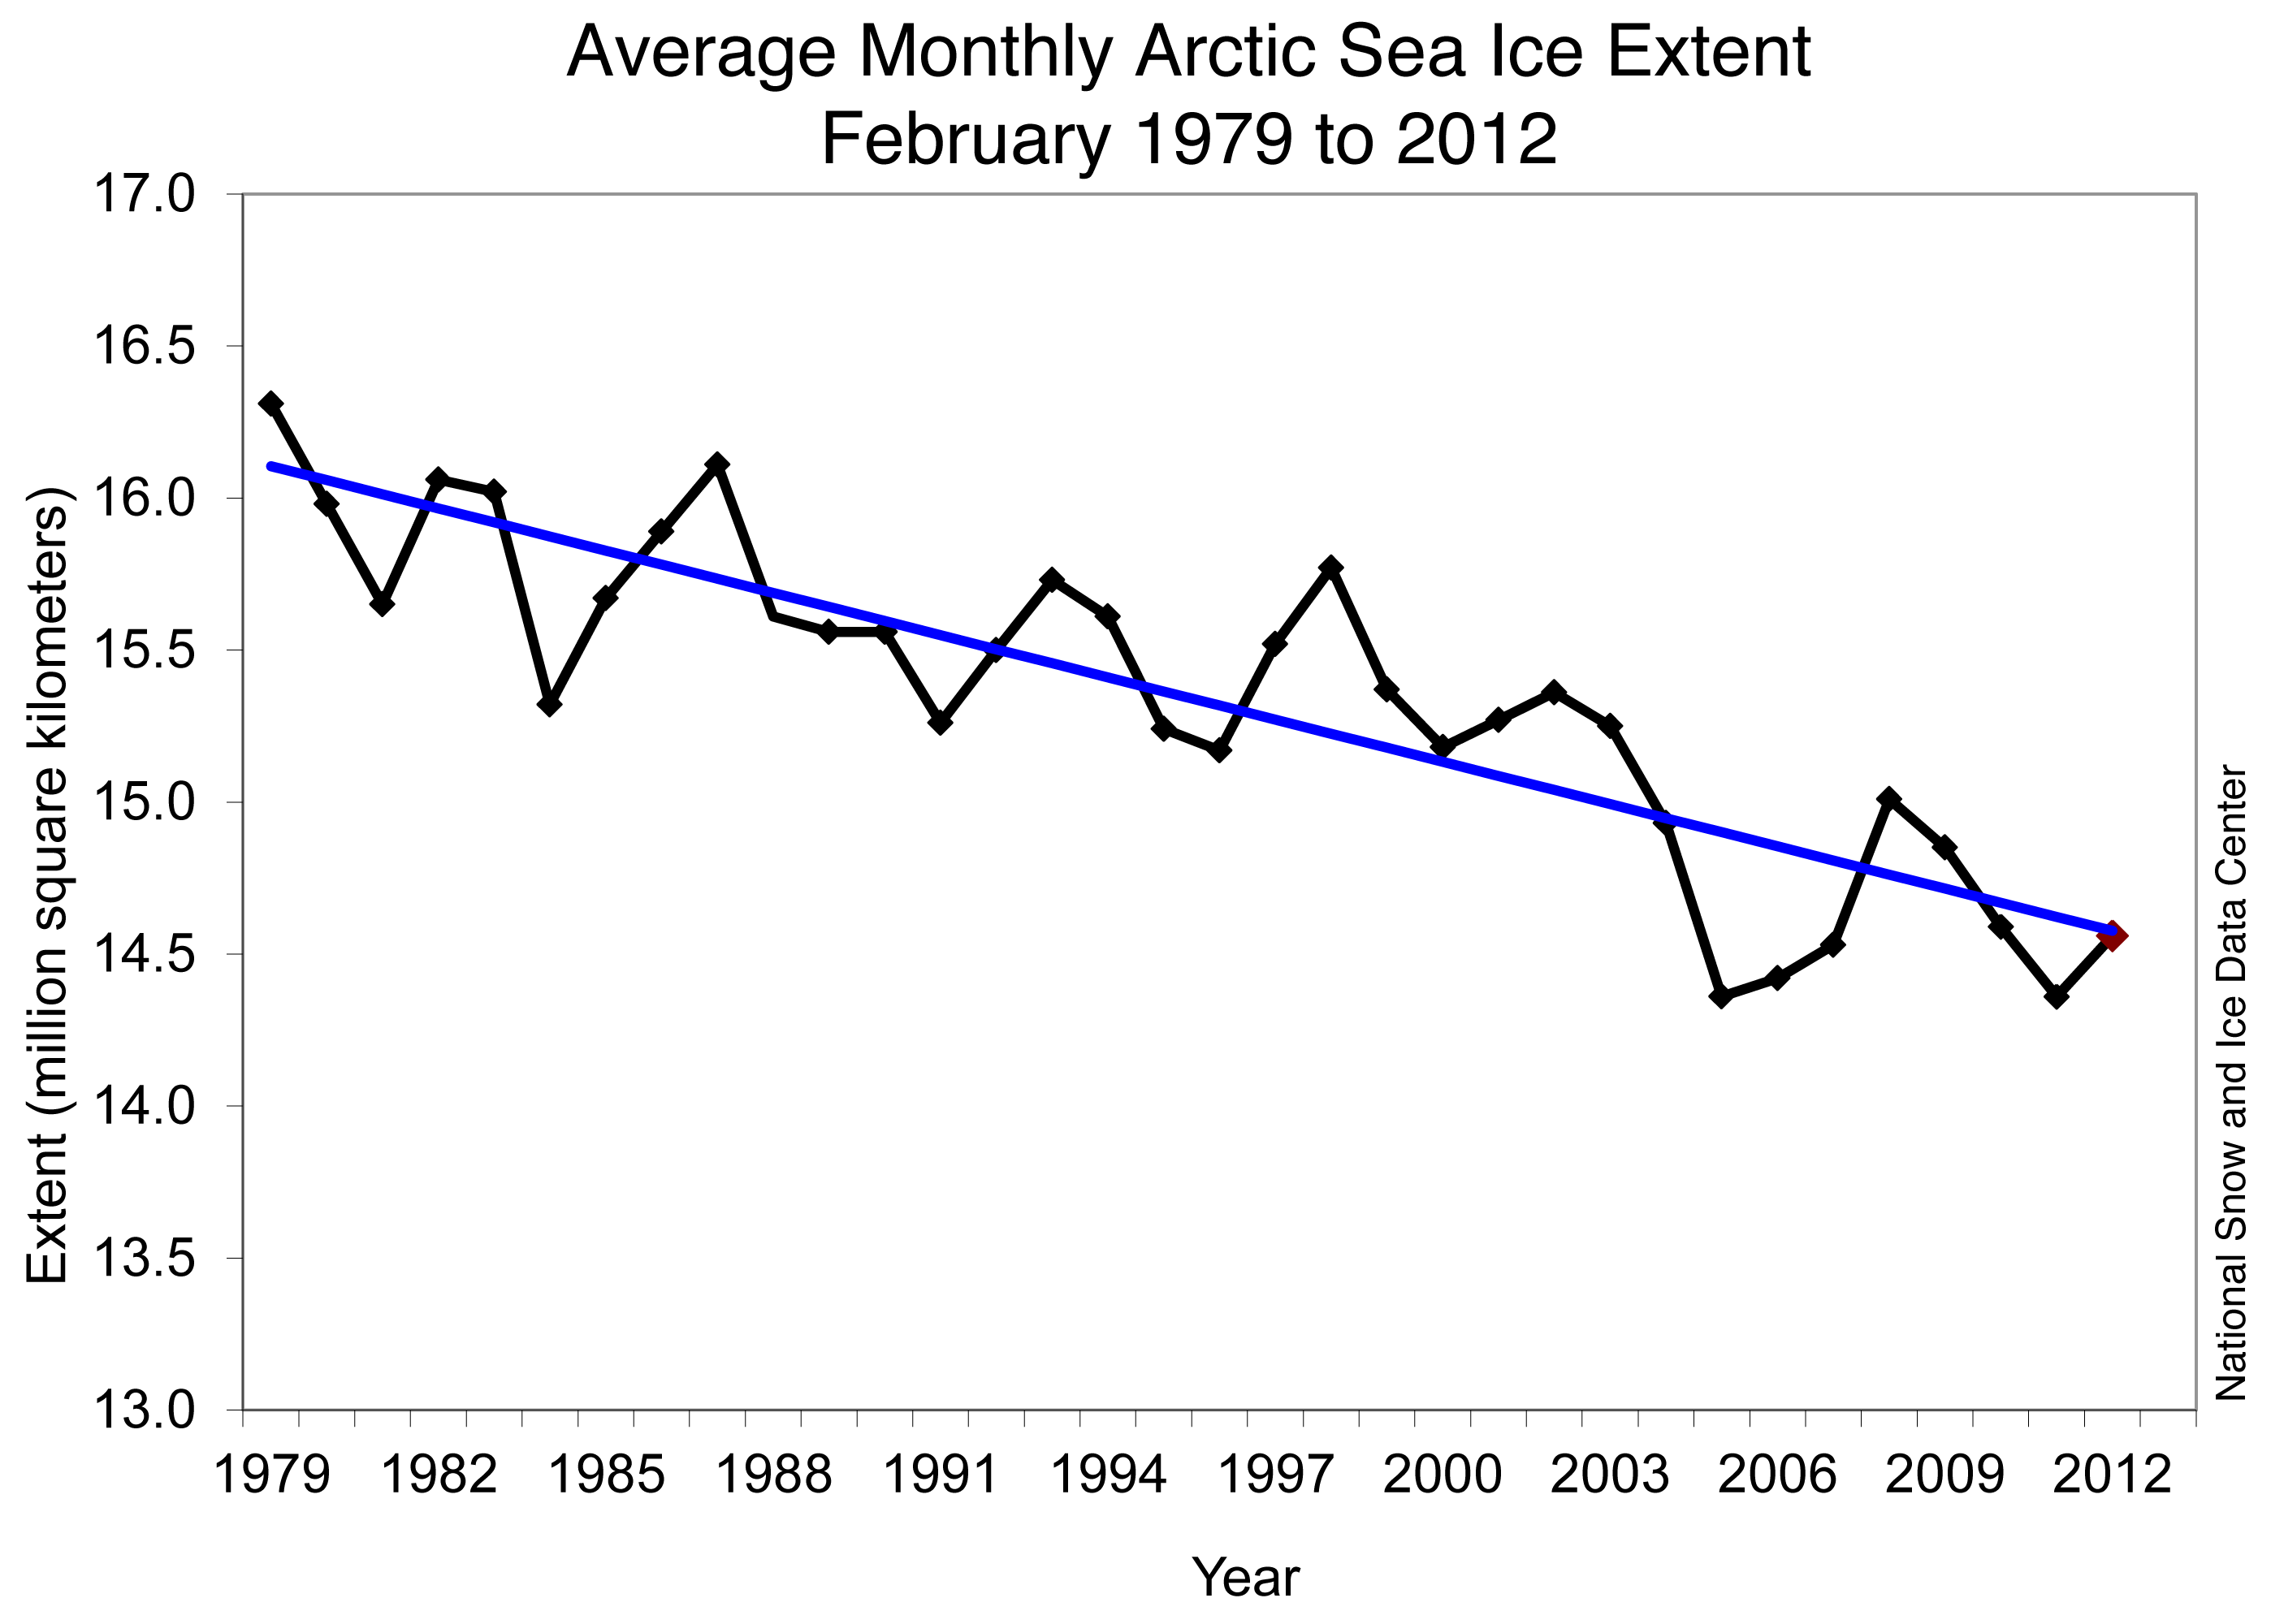
Monthly February ice extent for 1979 to 2012 shows a decline of 3.0% per decade. Credit: National Snow and Ice Data Center. High Resolution Image
February 2012 compared to past years
Arctic sea ice extent for February 2012 was the fifth lowest in the satellite record. Including the year 2012, the linear rate of decline for February ice extent over the satellite record is 3.0% per decade. Based on the satellite record, through 2003, average February ice extent had never been lower than 15 million square kilometers (5.79 million square miles). February ice extent has not exceeded that mark eight out of the nine years since 2003.
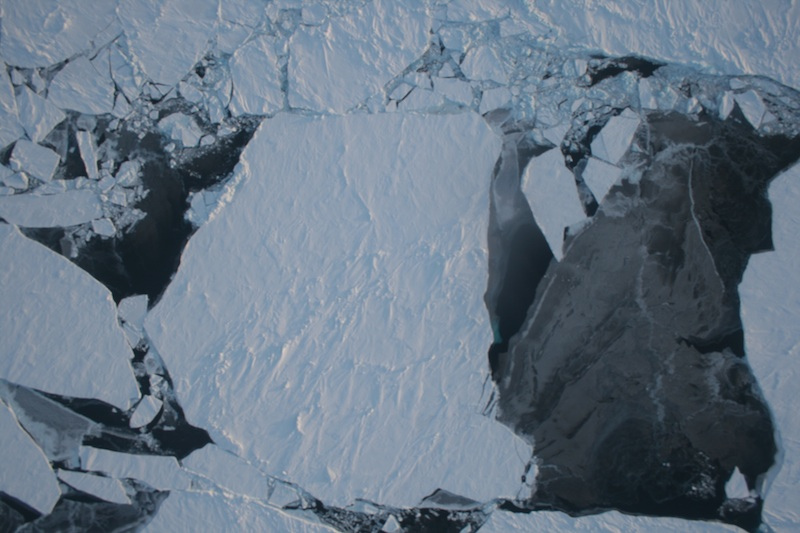
This photograph of sea ice near Greenland was taken on March 18, 2011 from the NASA P3 aircraft. The IceBridge mission is collecting data on ice thickness, an important measure of the health of sea ice. Credit: NASA/ATM automatic Cambot system. High Resolution Image
IceBridge thickness data
Measuring ice thickness is critical to assessing the overall health of Arctic sea ice. The passive microwave data that NSIDC presents here provide only ice extent, a two-dimensional measure of ice cover. But ice can vary in thickness from a few centimeters to several meters, and scientists want to know if the ice pack is thinning overall as well as declining in extent. A new study by NASA scientist Ron Kwok compared ice thickness data collected by airplanes during the ongoing Operation IceBridge with thickness data from the NASA Ice, Cloud and Land Elevation Satellite (ICESat), which ended its mission in 2009. IceBridge is an airborne data-collection mission that started in 2009, in order to bridge the data gap between the first ICESat and ICESat-2, which is scheduled to launch in 2016.
Kwok found good agreement between simultaneous IceBridge and ICESat freeboard measurements made in 2009. Freeboard is the elevation of sea ice above the ocean surface, and provides a measure of ice thickness. These results show that IceBridge measurements will be able to bridge the gap between the ICESat and ICESat-2 satellite missions and add to other ice thickness data from the European Space Association (ESA) Cryosat-2. Satellite measurements of ice thickness provide a third dimension of information on the changing sea ice cover, helping scientists to more accurately assess the amount of sea ice in the Arctic.
Data collected by the IceBridge mission is archived and distributed by the NSIDC IceBridge Data program.
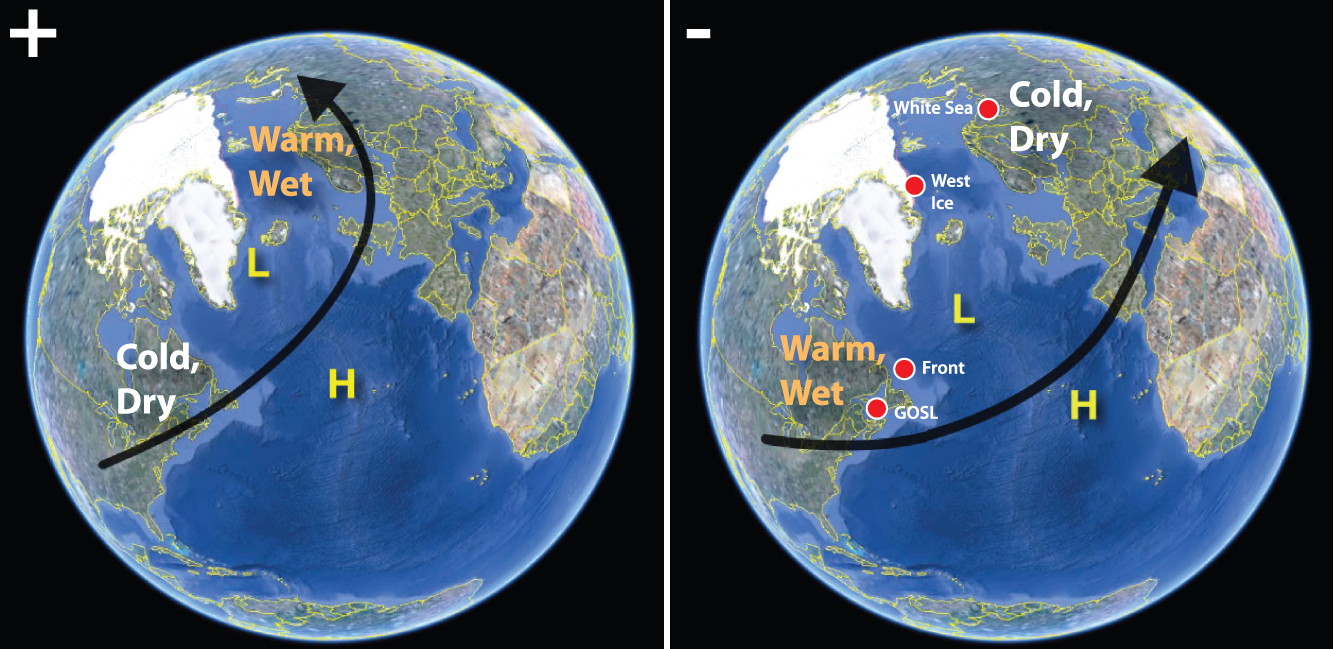
These images show the general effects of the positive phase (left) and negative phase (right) of the NAO. Red dots show the location of harp seal breeding grounds. 
Credit: Johnston et. al., 2012High Resolution Image
Regional ice conditions and harp seals
Many animals rely on sea ice as part of their habitat. Harp seals, for example, give birth to and care for their young on floes of sea ice. Recent research by David Johnston and colleagues at Duke University showed that harp seals in the northwest Atlantic have higher mortality rates during years when the North Atlantic Oscillation (NAO) is in its negative phase, a pattern that favors low ice cover in the Labrador Sea and Gulf of St. Lawrence, where harp seals breed. 
This winter, the NAO has mostly been in a positive phase and ice conditions in the Labrador Sea and Gulf of St. Lawrence have been at near-normal levels. However, in recent years, ice conditions in the region have been very low. The study showed a longer-term decline in sea ice cover of up to 6% per decade across all North Atlantic harp seal breeding grounds since 1979. While harp seals are well-suited to deal with natural short-term shifts in ice conditions, they may not be able to adapt to the combined effects of both short-term variability and long-term climate change.

Friday, January 6, 2012

Jeff Masters: Remarkably dry and warm winter due to record extreme jet stream configuration

Remarkably dry and warm winter due to record extreme jet stream configuration


by Jeff Maters, wunderblog, January 6, 2012


Flowers are sprouting in January in New Hampshire, the Sierra Mountains in California are nearly snow-free, and lakes in much of Michigan still have not frozen. It's 2012, and the new year is ringing in another ridiculously wacky winter for the U.S. In Fargo, North Dakota yesterday, the mercury soared to 55 °F, breaking a 1908 record for warmest January day in recorded history. More than 99% of North Dakota had no snow on the ground this morning, and over 95% of the country that normally has snow at this time of year had below-average snow cover. High temperatures in Nebraska yesterday were in the 60s, more than 30 °F above average. Storm activity has been almost nil over the past week over the entire U.S., with the jet stream bottled up far to the north in Canada. It has been remarkable to look at the radar display day after day and see virtually no echoes, and it is very likely that this has been the driest first week of January in U.S. recorded history. Portions of northern New England, the Upper Midwest, and the mountains of the Western U.S. that are normally under a foot of more of snow by now have no snow, or just a dusting of less than an inch. Approximately half of the U.S. had temperatures at least 5 °F above average during the month of December, with portions of North Dakota and Minnesota seeing temperatures 9 °F above average. The strangely warm and dry start to winter is not limited to the U.S. -- all of continental Europe experienced well above-average temperatures during December. 


Figure 1. Flowers sprouting on January 1, 2012, in Keene, New Hampshire, thanks to unusually warm December temperatures and lack of snow. Image credit: Wunderphotographer lovne32.


Figure 2. Departure of snow depth from average on January 6, 2011. More than 95% of the country that normally has snow at this time of year had below-average snow cover (yellow and orange colors). Image credit: NOAA/National Operational Hydrologic Remote Sensing Center.

December 2011 jet stream pattern the most extreme on record
The cause of this warm first half of winter is the most extreme configuration of the jet stream ever recorded, as measured by the North Atlantic Oscillation (NAO). The Arctic Oscillation (AO), and its close cousin, the North Atlantic Oscillation (which can be thought of as the North Atlantic's portion of the larger-scale AO), are climate patterns in the Northern Hemisphere defined by fluctuations in the difference of sea-level pressure in the North Atlantic between the Icelandic Low and the Azores High. The AO and NAO have significant impacts on winter weather in North America and Europe -- the AO and NAO affect the path, intensity, and shape of the jet stream, influencing where storms track and how strong these storms become. During December 2011, the NAO index was +2.52, which was the most extreme difference in pressure between Iceland and the Azores ever observed in December (records of the NAO go back to 1865). The AO during December 2011 had its second most extreme December value on record, behind the equally unusual December of 2006. These positive AO/NAO conditions caused the Icelandic Low to draw a strong southwesterly flow of air over eastern North America, preventing Arctic air from plunging southward over the U.S. and Europe.


Figure 3. December 2011 temperatures in Europe and the U.S. were well above average, thanks to a positive phase of the Arctic Oscillation (AO). Compare the U.S. plot with the plot of typical departures of temperature from average due to the positive phase of the AO (Figure 4). The two patterns are nearly identical. Image credit: NOAA/ESRL.


Figure 4. The departure of temperature from average in Centigrade during the November-December-January period during various phases of the Arctic Oscillation (AO). Positive AO conditions lead to warm winters in the U.S., while negative AO conditions lead to cold winters. Image credit: NOAA/Climate Prediction Center.

Wild swings in the December Arctic Oscillation
This winter's remarkable AO/NAO pattern stands in stark contrast to what occurred the previous two winters, when we had the most extreme December jet stream patterns on record in the opposite direction (a strongly negative AO/NAO). The negative AO conditions suppressed westerly winds over the North Atlantic, allowing Arctic air to spill southwards into eastern North America and Western Europe, bringing unusually cold and snowy conditions. 


The December Arctic Oscillation index has fluctuated wildly over the past six years, with the two most extreme positive and two most extreme negative values on record. Unfortunately, we don't understand why the AO varies so much from winter to winter, nor why the AO has taken on such extreme configurations during four of the past six winters. Climate models are generally too crude to make skillful predictions on how human-caused climate change may be affecting the AO, or what might happen to the AO in the future. There is research linking an increase in solar activity and sunspots with the positive phase of the AO. Solar activity has increased sharply this winter compared to the past two winters, so perhaps we have seen a strong solar influence on the winter AO the past three winters. Arctic sea ice loss has been linked to the negative (cold) phase of the AO, like we observed the previous two winters. Those winters both had near-record low amounts of sunspot activity, so sea ice loss and low sunspot activity may have combined to bring a negative AO.


Figure 5. The December Arctic Oscillation (AO) index has fluctuated wildly over the past six years, with the two most extreme positive and two most extreme negative values on record. Image credit: NOAA/Climate Prediction Center.

The forecast for the remainder of January
We will (finally!) get the first major storm of 2012 in the U.S. early next week, when a low pressure system will develop over Texas and spread heavy rains of 1-3" along a swath from Eastern Texas to New England during the week. This storm will pull in a shot of cold air behind it late in the week, giving near-normal January temperatures to much of the country, and some snow to northern New England. Beyond that, it is difficult to tell what the rest of winter may hold, since the AO is difficult to predict more than a week or two in advance. The latest predictions from the GFS model show the current strongly positive AO pattern continuing for at least the next two weeks, resulting in very little snow and warmer-than-average temperatures. 


If we don't get significant snows during the latter part of winter, the odds of a damaging drought during the summer in the Midwest will rise. The soils will dry out much earlier than usual without a deep snow pack to protect them, resulting in a much earlier onset of summer-like soil dryness. Water availability may also be a problem in some regions of the west due to the lack of snow melt. Fortunately, most Western U.S. reservoirs are above average in water supply, due to the record-breaking snows of the previous winter.


http://www.wunderground.com/blog/JeffMasters/comment.html?entrynum=2010