Blog Archive

Showing posts with label Mauri Pelto. Show all posts

Sunday, January 17, 2016

Mauri Pelto: What is Up in Disko-Uummannaq Bay, Greenland, January 9-16, 2016?

by Mauri Pelto, "From A Glacier's Perspective," January 17, 2016

@TenneyNaumer contacted Alun Hubbard, Jason Box and me with an astute observation last evening: “But what I am getting at is that in general the temperature anomalies over the region of Jakobshavn have been high in the last few days, and I spotted weird temperatures off the coast via Climate Reanalyzer (which is seriously low resolution).  I just checked with the manati satellite (also seriously low resolution), and it seems some sort of event has taken place.”
Following up on what are typically good observations from Tenney, I looked at the Radarsat-2 and Sentinel-1 imagery posted by the Danish Meteorological Institute.  Weather records from automatic weather stations in the region from PROMICE and the surface mass balance model results for the week from Polar Portal.
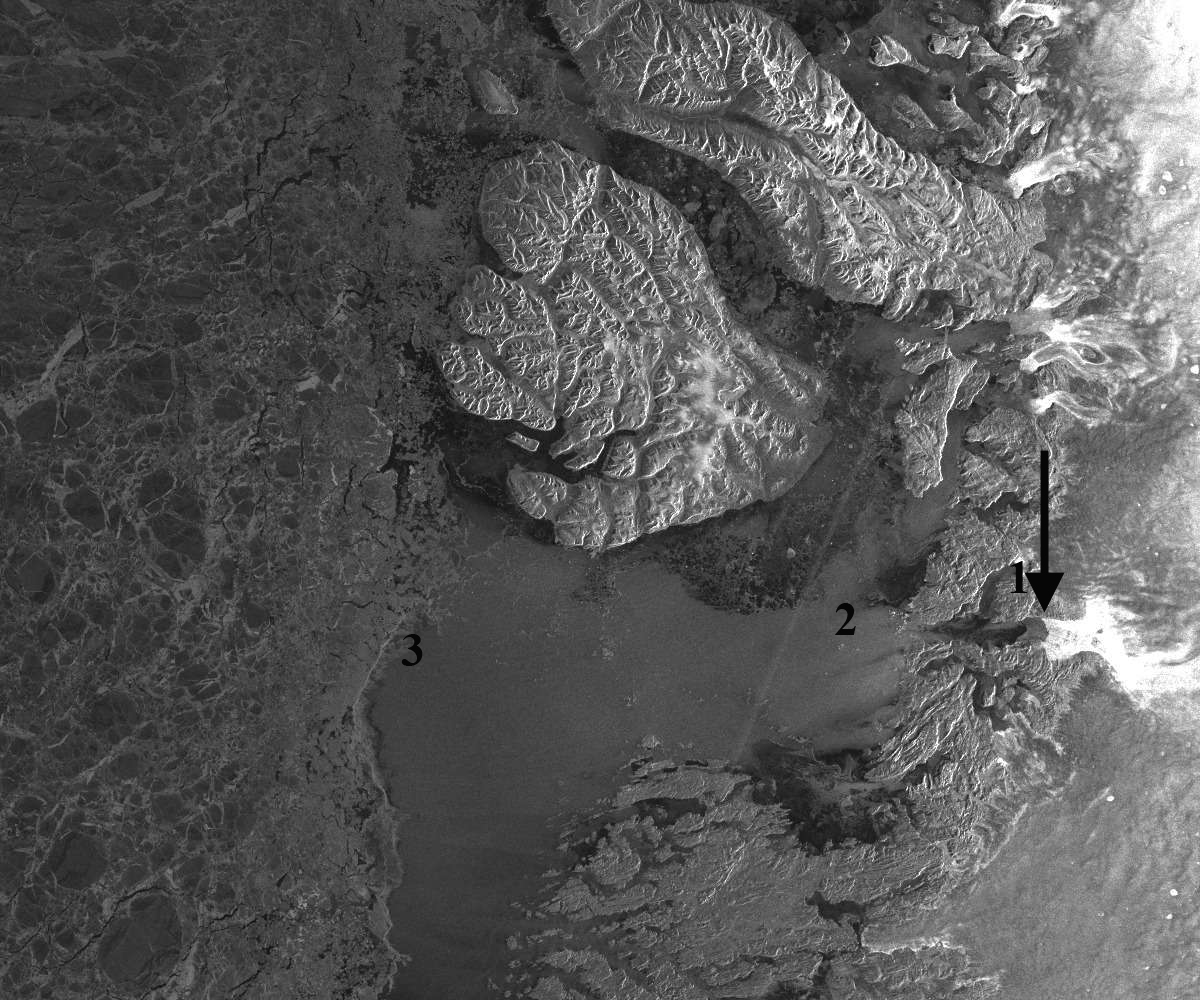
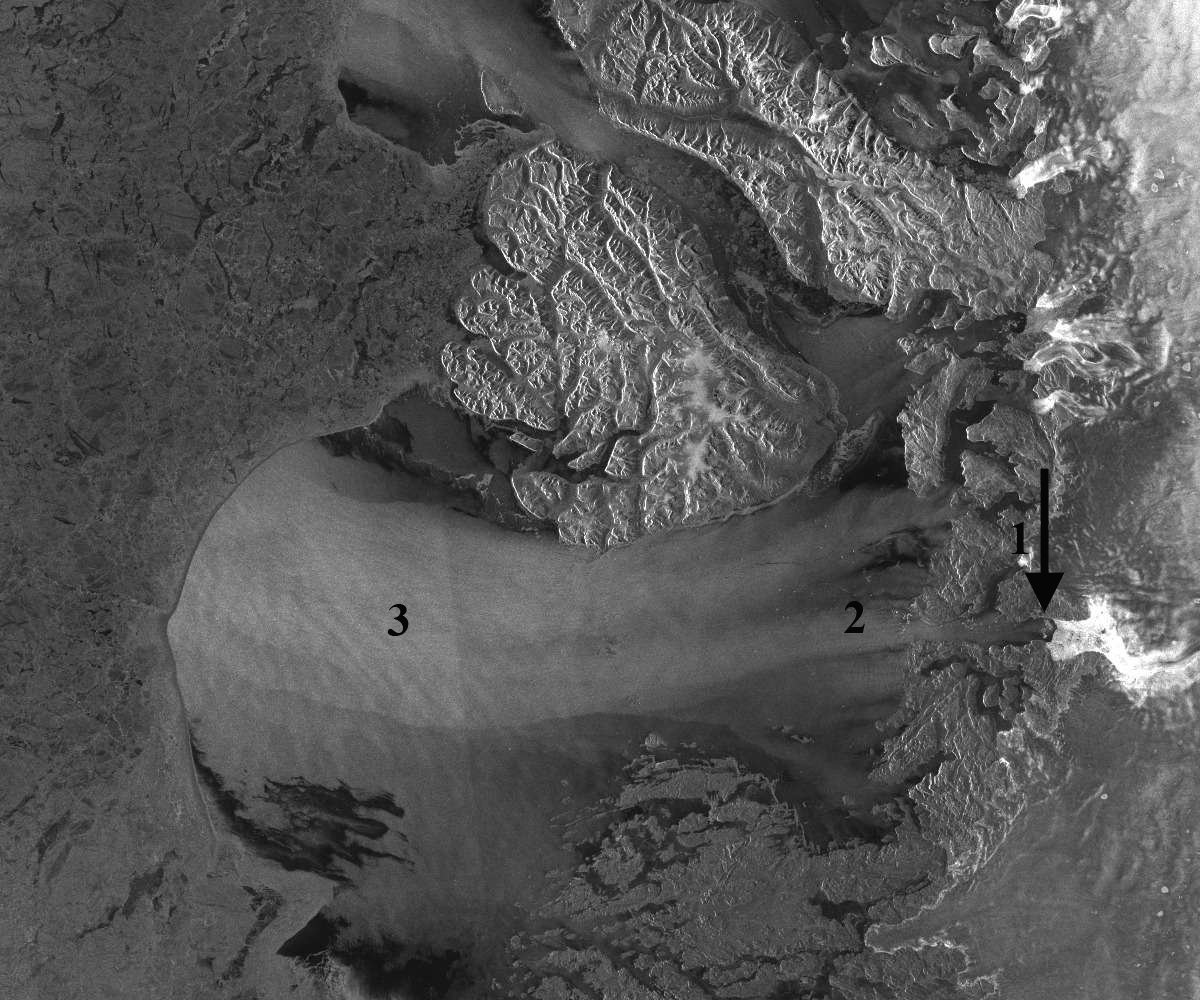
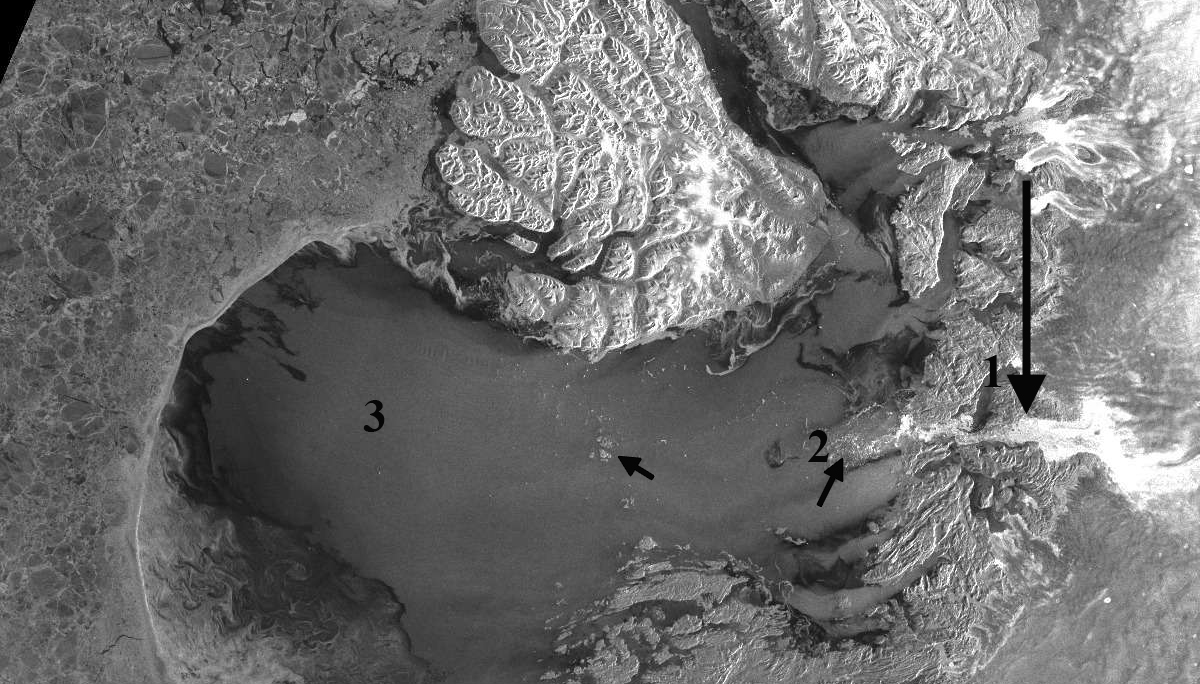
The arrow at location 1# is an area of sea ice across the fjord in front of Jakobshavn Glacier on January 9 that disappears by January 13. Location #2 is at the fjord mouth, and location #3 is at the sea front south of Disko Island on January 9.  There is no real cloud cover evident in any of images.  Maybe low-level fog in places. By January 11th, a plume is sweeping from Point 2 towards Point 3. Notice the sea ice in the fjord disappears by January 13th, and the ice front is pushed back in a concave fashion at Point #3. This indicates a clear push of water driving sea ice offshore. (The Ilulissat Fjord mouth lack of ice is also evident in Webcam images from 01/1/16 and 01/17/16 at the Hotel Arctic, with the last images, below, showing two boats plying the open water on the 16th and icebergs clogging the fjord mouth on the 17th.)  
The Sentinel-1 image from January 16th shows a significant flushing of icebergs from Ilulissat Fjord, pointed out by black arrows.  This image has better clarity and, with the icebergs scattered through the plume, indicate more clearly the plume is a water source change event, even if wind driven. The iceberg plume in the fjord has a brighter aspect due to the varied surface aspect-reflectance and has expanded down fjord.  The event must be due to or enhanced by strong offshore winds and @ruth_mottram indicates there was at least one foehn event [Readers, best to read what these are: https://en.wikipedia.org/wiki/Foehn_wind]. The plume indicates the ice melange in front of Jakobshavn has largely been removed.
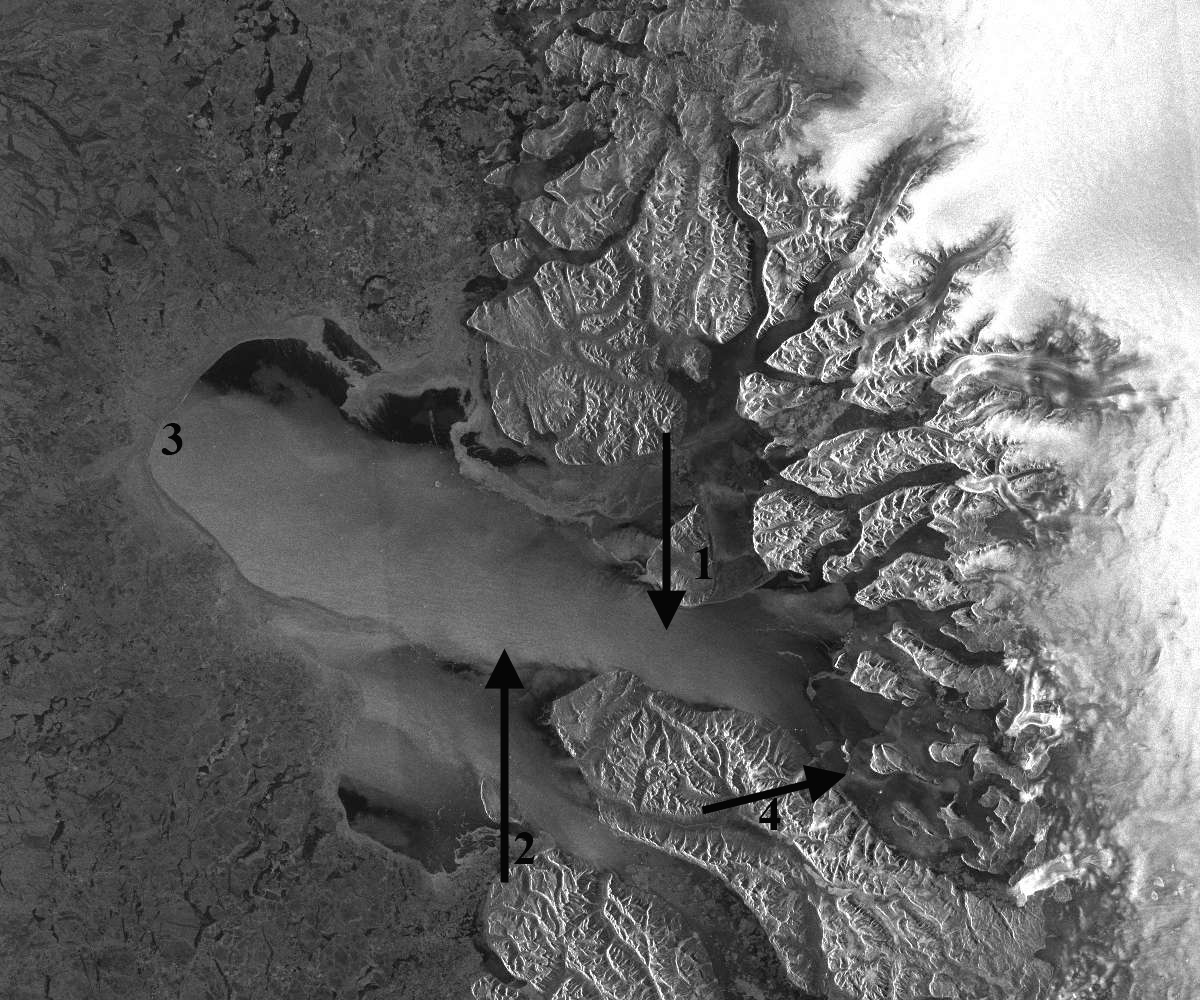
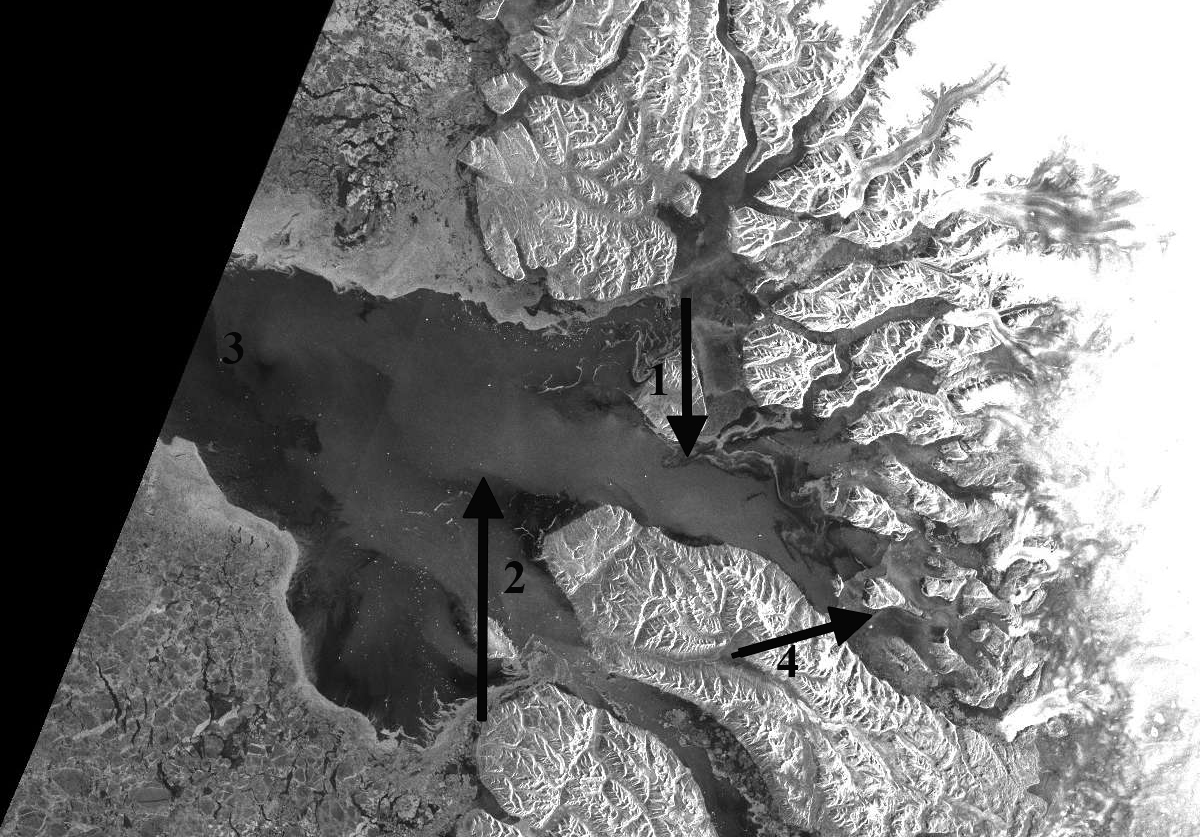
In Uummannaq Bay, a very similar sequence plays out; note on January 9 the sea ice connecting islands near #4.  By January 13th, the ice at location #4 is gone.  The ice front is now at location #3, which on January 9th was well into the ice pack.  Again, we have a clear push of water leading to a concave sea ice front that is pushed well offshore. Icebergs can be seen amidst plume on January 16th; the plume opacity and size has diminished since January 13th.
In both of the January 13th images, there is a plume leading to the concave sea ice front, the question being is this sediment-laden water, with the resultant higher reflectivity, or is it a combination of a surface water change from wind or a combination? Jason Box suggests it is aeration of the surface water from the strong offshore winds. The ice must in part be driven back by a surface water push. You can see icebergs in sections of the plumes closer to shore suggesting this is a surface near surface phenomenon. This is a short-term event.  However, it could have broader implications; Moon et al. (2015) indicate the importance of a rigid ice melange at the front of tidewater outlet glaciers in Greenland.  In this case, the ice melange in front of Jakobshavn has been removed, and probably from in front of other glaciers. I look forward to further insights from the community.
20160109s01disko
RADARSAT-2 image of Disko Bay, 01/09/2016.
20160111rs02disko
RADARSAT-2 image of Disko Bay, 01/11/2016.
20160113rs02disko
RADARSAT-2 image of Disko Bay, 01/13/2016.
20160116disko
Sentinel-1 imagery of Disko Bay, 01/16/16. Notice expanded brightness area in the fjord by #1.

20160109s01uummann
 Sentinel 1 imagery of Uummannaq Bay, 01/09/2016.
20160113rs02umman
RADARSAT-2 image of Uummannaq Bay MODIS, 01/13/2016.
20160116s01uumann
Sentinel 1 imagery of Uummannaq Bay, 01/13/2016, with plume size and opacity diminishing. 
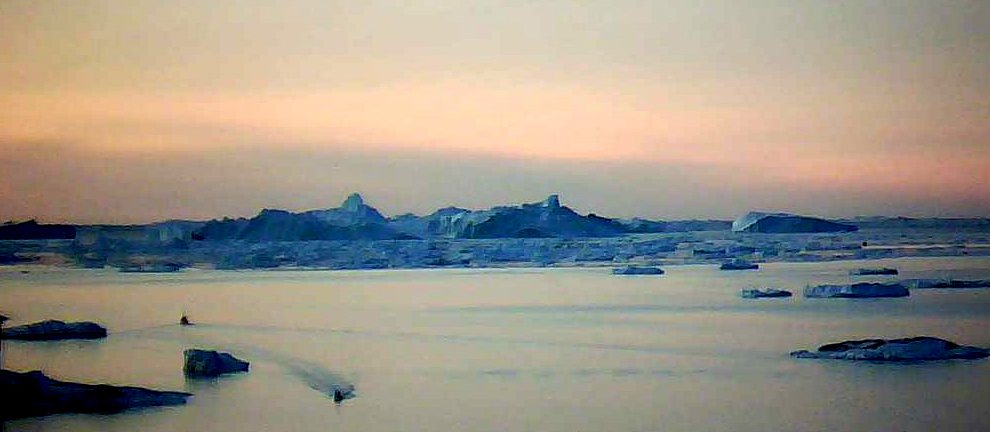
illusiat webcam 1-16-2016
Ilulissat Fjord mouth webcam view, 01/16/16.
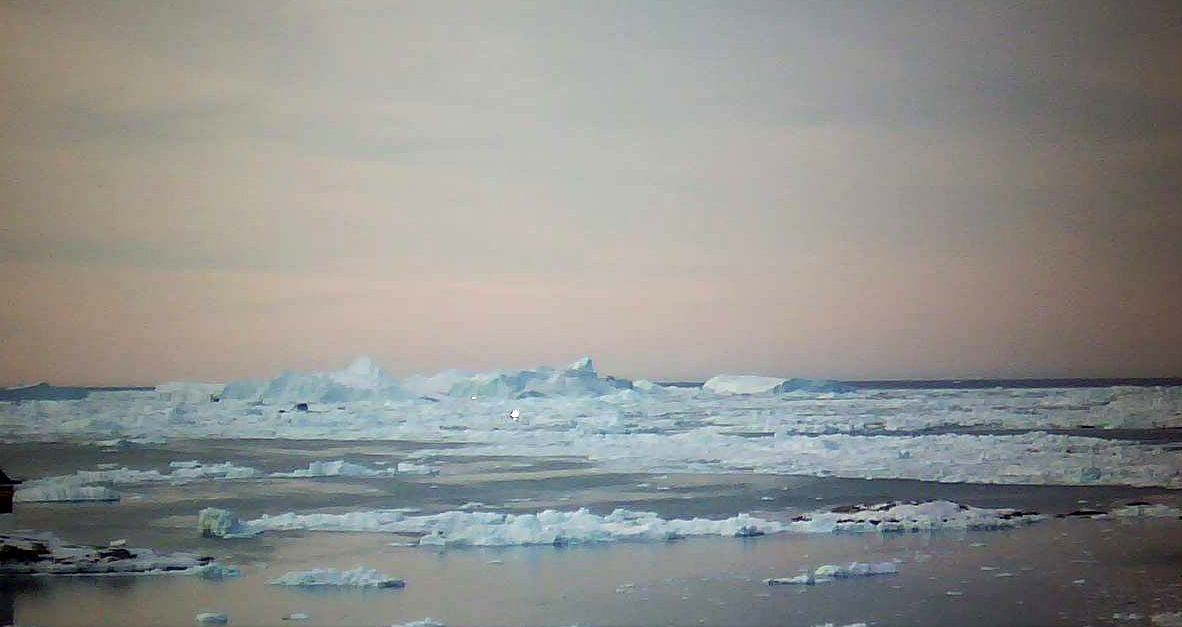
ilulissat webcam11-17-16
Ilulissat Fjord mouth webcam view, 01/17/16.


x

Saturday, September 20, 2014

Mauri Pelto -- Climate Scientist Hunk of the Month does the ice bucket challenge!

Mauri Pelto responding to Peter Sinclair challenge, September 20, 2014 

[Apologies to Mauri, but I couldn't resist.]


For a view of Mauri's awesome work in glaciology have a good look at his famed blog "From a Glacier's Perspective": 

http://glacierchange.wordpress.com/

Tuesday, April 16, 2013

Peter Sinclair, Yale Forum: Greenland Ice Sheet Melt


Photo from video

Independent video producer Peter Sinclair trains his lens and microphone on seven climate science experts to help explain ice melt in Greenland and its implications for sea-level rise over remainder of the century.
Powerful graphics and concise interviews with expert climate scientists combine in independent video producer Peter Sinclair’s monthly Yale Forum “This Is Not Cool” video on Greenland ice melt.
The video includes interviews and sound clips featuring NASA climate scientists; Nichols College, Ohio State and Penn State scientists; and a Climate Institute scientist. Among other points, these experts cite the benefits of having ice melt maps over the past two decades and point to the intensity, and not necessarily the geographical extent, of Greenland ice sheet melting as a particular concern.
“Exceptional melts” is how one expert characterizes recent Greenland melting … “very well documented” by satellite records. “A 10-year doubling time” on Greenland’s sea-level contribution “makes it much more likely that we will observe more than one meter of sea-level rise by the end of the century,” a scientist observes. Another scientist’s counsel: “A big dip in 2012. We don’t know what’s going to happen in 2013.”
“Just astounding to see,” a glaciologist cautions … “we just have more melt everywhere.”
“A very serious issue,” another concludes.
The video is one of a continuing series that Sinclair produces exclusively for The Yale Forum.
Link:  http://www.yaleclimatemediaforum.org/2013/04/yale-forum-monthly-video-focuses-on-greenland-ice-sheet-melt/

Tuesday, January 15, 2013

Nation’s Top Climate Scientists Urge President Obama to Reject Keystone XL Pipeline


For immediate release, January 15, 2013, 350.org
OAKLAND CA -- Eighteen of the nation’s top climate scientists released a letter to President Obama today urging him to say no to the Keystone XL tar sands pipeline. 
“Eighteen months ago some of us wrote you about the proposed Keystone XL tar sands pipeline, explaining why in our opinion its construction ran counter to both national and planetary interests,"  wrote the scientists. "Nothing that has happened since has changed that evaluation; indeed, the year of review that you asked for on the project made it clear exactly how pressing the climate issue really is."
Indeed the past year has shown that climate change is here. A few months after Superstorm Sandy flooded parts of the Northeast, NOAA announced last week that the average temperature for 2012 was 55.3 degrees Fahrenheit, 3.2 degrees above normal and a full degree higher than the previous warmest year recorded -- 1988. 
The State Department is expected to soon release its supplemental environmental impact statement (SEIS) required for the northern leg of the Keystone XL pipeline. The department’s previous pipeline EIS downplayed climate risks by arguing that the tar sands would be developed with or without Keystone XL and therefore the project had no responsibility for the additional greenhouse gas emissions that come from burning tar sands oil. 
But two of Canada's largest banks, TD Economics and CIBC, have recently said that without added capacity, "Canada's oil industry is facing a serious challenge to its long-term growth" and that “Canada needs pipe — and lots of it — to avoid the opportunity cost of stranding over a million barrels a day of potential crude oil growth.”
The Obama Administrations has promised action on climate change but if KXL is approved, the Administration would be actively supporting and encouraging the growth of an industry which has demonstrably serious effects on climate.
Thousands of concerned citizens will come to Washington, DC on February 17th, President's Day weekend, to oppose the Keystone XL pipeline. Rally information is at www.350.org/presidentsday.
### 
1. Full text of the letter: 
Dear Mr. President,
You take office for the second time at a critical moment. As you may know, the U.S. has just recorded the hottest year in its history, beating the old mark by a full degree; the same year that saw the deep Midwest drought, and the fury of Hurricane Sandy, also witnessed the rapid and unprecedented melt of the Arctic ice pack. 
If we are to restrain the rise in the planet's temperature, it will require strong action from, among others, the planet's sole superpower. Some of that work will be difficult, requiring the cooperation of Congress. But other steps are relatively easy.
Eighteen months ago some of us wrote you about the proposed Keystone XL tar sands pipeline, explaining why in our opinion its construction ran counter to both national and planetary interests. Nothing that has happened since has changed that evaluation; indeed, the year of review that you asked for on the project made it clear exactly how pressing the climate issue really is. 
We hope, as scientists, that you will demonstrate the seriousness of your climate convictions by refusing to permit Keystone XL; to do otherwise would be to undermine your legacy.
Thank you,
James Hansen, Research Scientist, The International Research Institute for Climate and Society, The Earth Institute, Columbia University
Ralph Keeling, Director, Scripps CO2 Program Scripps Institution of Oceanography
John Harte, Professor of Ecosystem Sciences, University of California
Jason E. Box, Professor, Byrd Polar Research Center
John Abraham, Associate Professor, School of Engineering, University of St. Thomas
Ken Caldeira, Senior Scientist. Department of Global Ecology, Carnegie Institution
Michael MacCracken, Chief Scientist for Climate Change Programs, Climate Institute
Michael E. Mann, Professor of Meteorology, Director, Earth System Science Center, The Pennsylvania State University
James McCarthy, Alexander Agassiz Professor of Biological Oceanography, Harvard University
Michael Oppenheimer, Albert G. Milbank Professor of Geosciences and International Affairs, Woodrow Wilson School and Department of Geosciences, Princeton University
Raymond T. Pierrehumbert, Louis Block Professor in the Geophysical Sciences, The University of Chicago
Richard Somerville, Distinguished Professor Emeritus and Research Professor, Scripps Institution of Oceanography
George M. Woodwell, Founder, Director Emeritus, and Senior Scientist, Woods Hole Research Center
Mauri Pelto, Department of Environmental Science, Nichols College
David Archer, Professor, Department of Geophysical Sciences, The University of Chicago
Dr. Ted Scambos, Lead Scientist, National Snow and Ice Data Center, University of Colorado at Boulder
Terry L. Root, Senior Fellow, Stanford University
Alan Robock, Professor II, Distinguished Professor, Department of Environmental Sciences, Rutgers University
Affiliations are listed for identification purposes only. 

Saturday, October 13, 2012

Mauri Pelto: Thwaites Glacier Tongue Major Calving Event, Antarctica

by Mauri Pelto, From A Glacier's Perspective, October 8, 2012

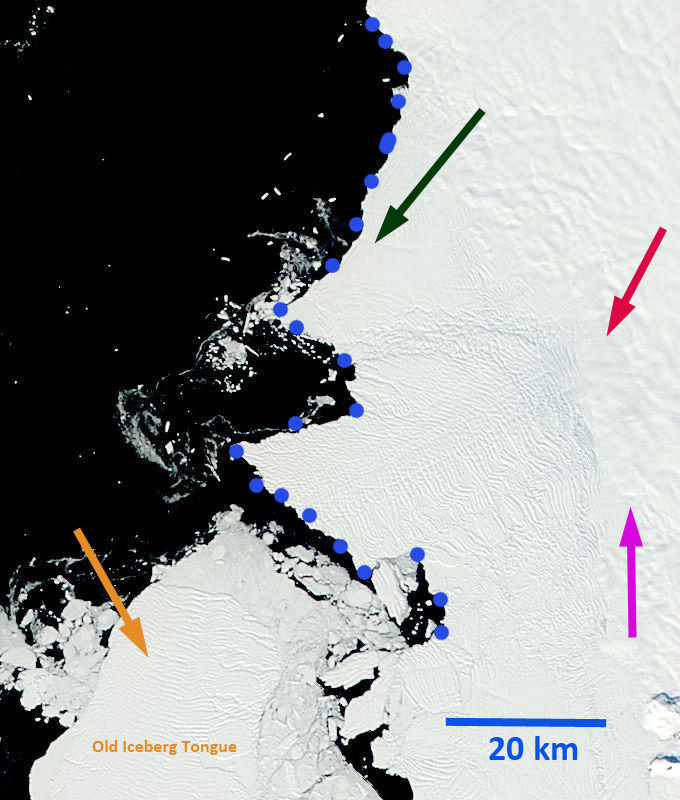
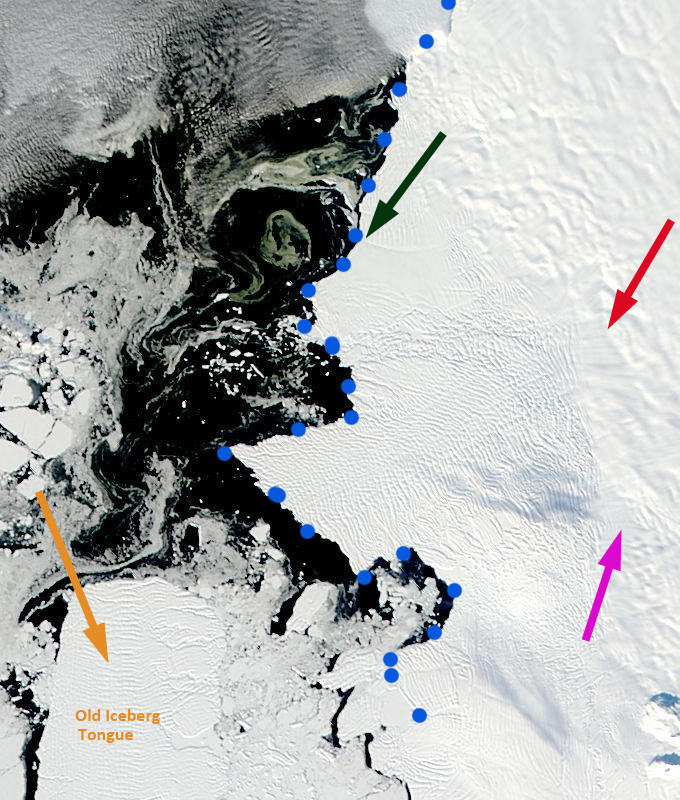
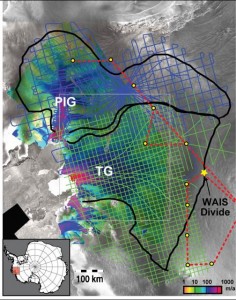
During the Austral winter between April and September 2012, the Thwaites Glacier (a large outlet glacier of the West Antarctic ice Sheet: WAIS) experienced a major calving event, as was pointed out by a reader on this blog. The Thwaites, along with Pine Island Glacier, is often considered the weak underbelly of the ice sheet. MODIS imagery from February, March, September and October is used here to illustrate the event. The red, magenta and green arrows point to the same location in each image. The blue dots mark the ice front. The orange arrow points to a portion of the Thwaites Glacier Ice Tongue that had previously calved in 2002/03. In the latter two images the yellow arrow indicates the new ice tongue piece that has broken off.


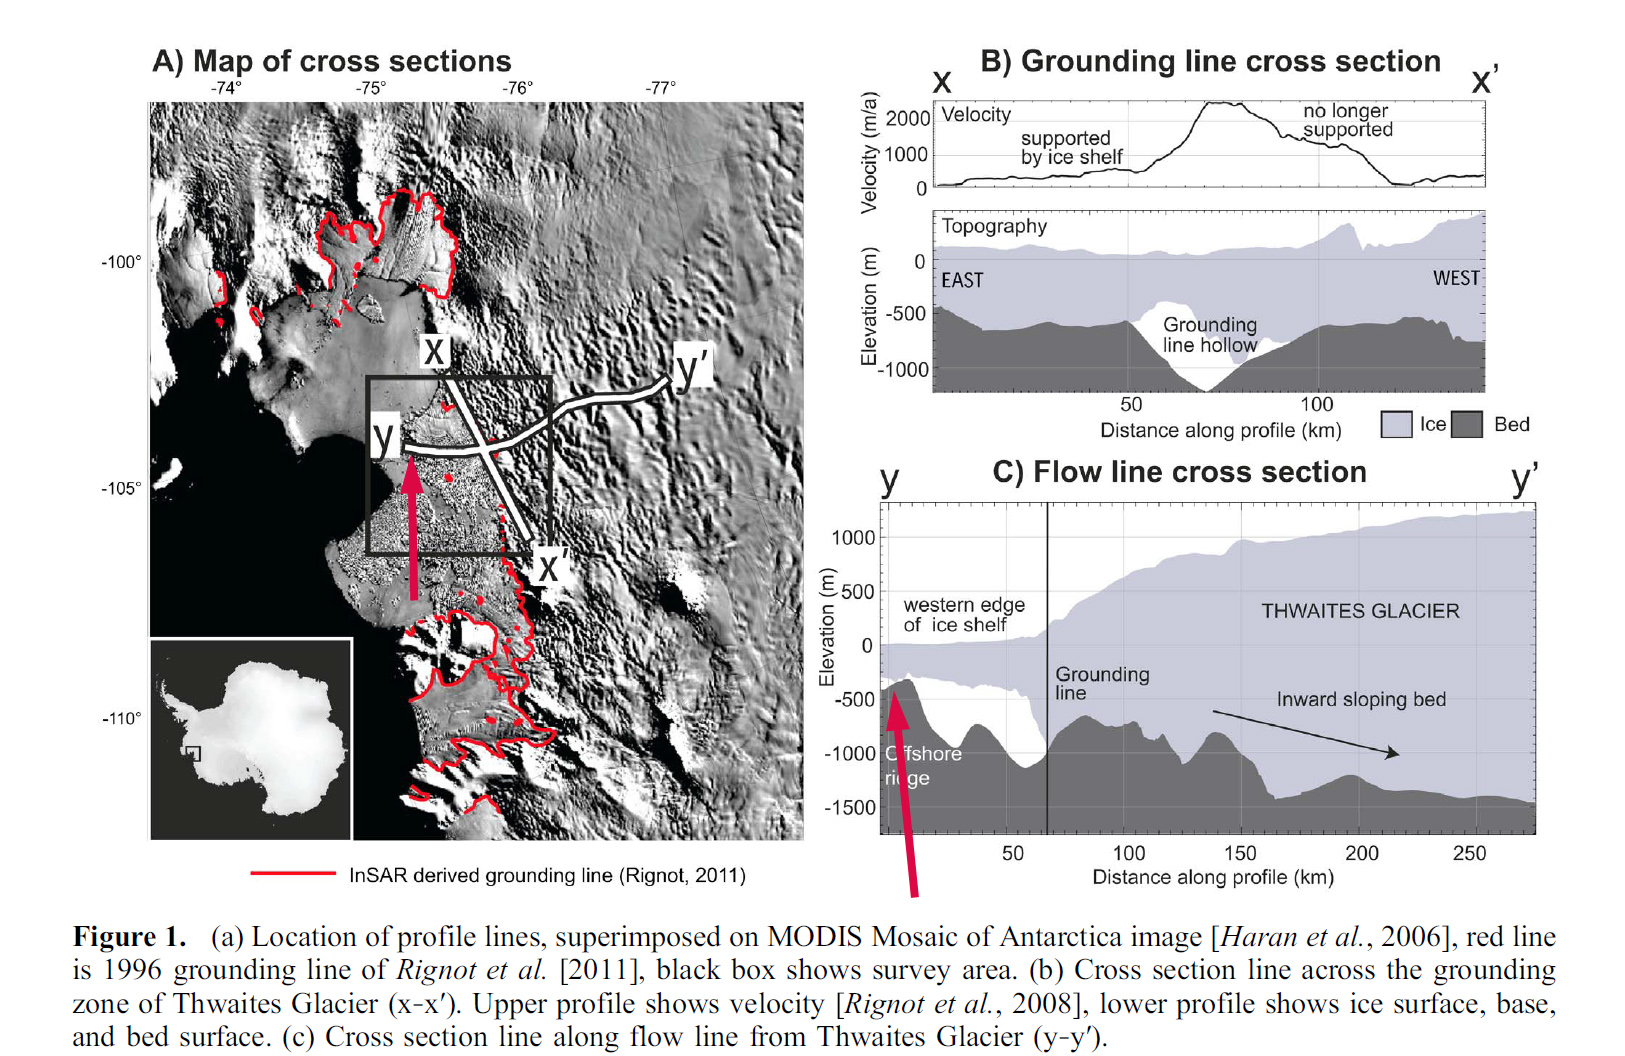
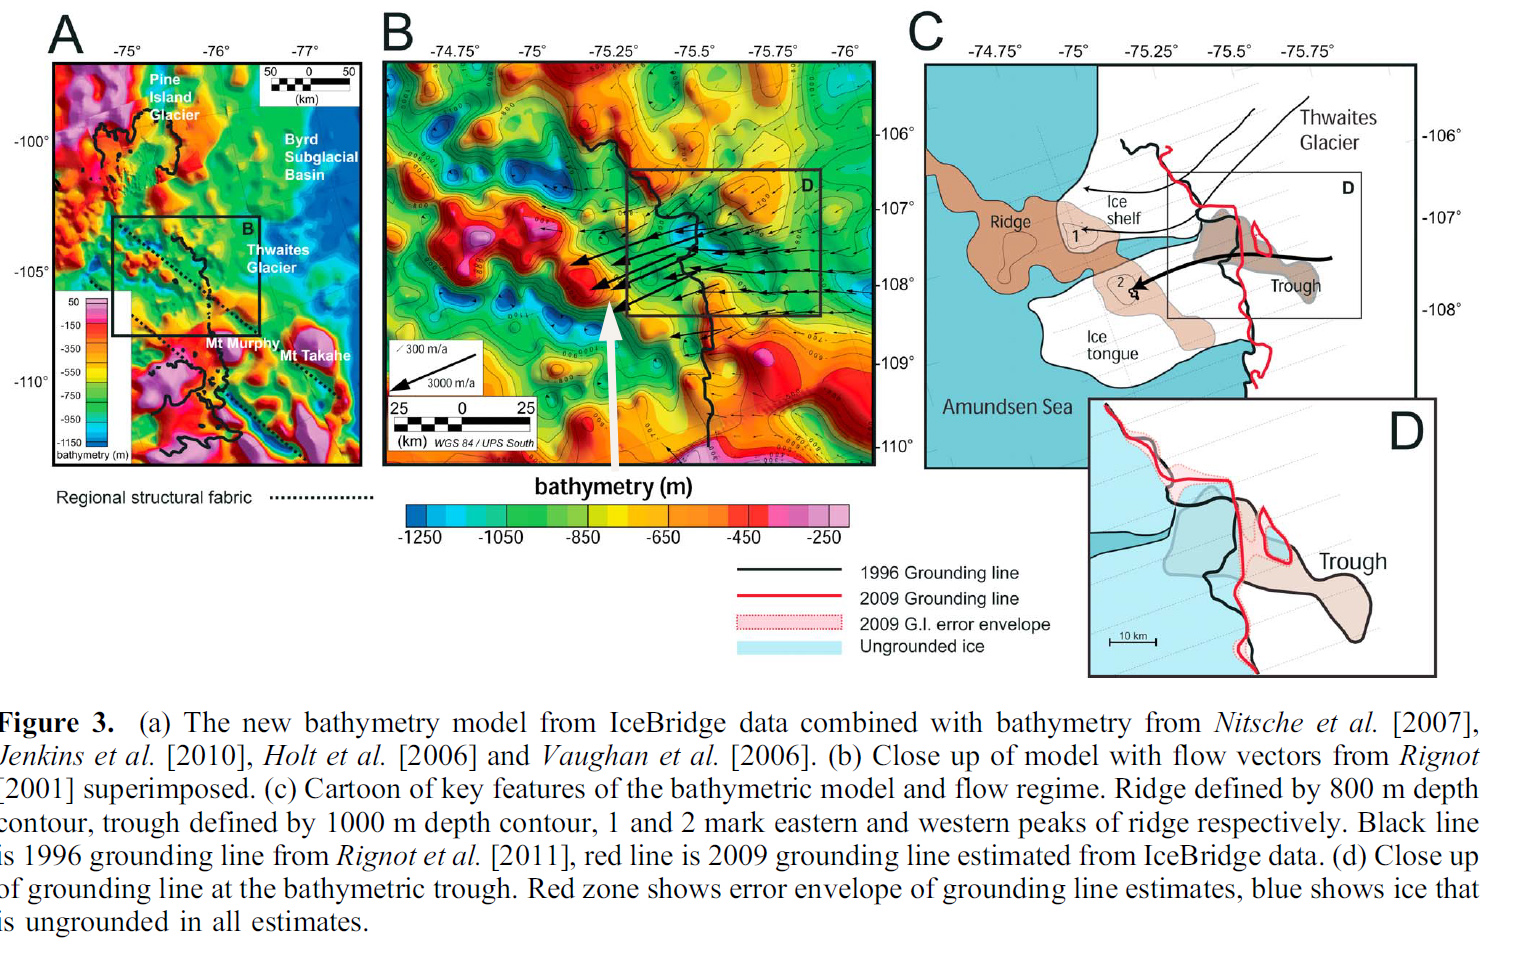
The Thwaites, along with the Pine Island Glacier, is an important glacier because they both tap into the heart of the WAIS but lack big buttressing ice shelves. This is why in 1985 I was busy preparing a bedrock map in front of the glacier from two shipboard seismic transects for Tom Kellogg and Terry Hughes at U Maine. Of course that map did not look nearly as good as the recent ones in Tinto and Bell (2011) from the extensive NASA Operation Icebridge. What they indicate in the two following images from their paper is that before it broke off the new ice tongue was ending on top of a bedrock high (red arrow first image below) that was acting as pinning for the ice tongue. The thicker the ice at that point, the better the pinning point. This bedrock high is noted in their Figure 3D with a white arrow. Kirsty Tinto and Robin Bell (2011) of Columbia University also predicted a faster retreat for the Thwaites Glacier. Rignot et al. (2002) noted that the Thwaites Glacier's grounding line was in retreat, the mass loss was increasing, and the glacier was thinning, although not nearly as fast as the Pine Island Glacier. In the last image below from Rignot (2008), the velocities of the Pine Island and Thwaites Glaciers are shown; the high velocity region of Thwaites is over a wider area, and this has been expanding ((Rignot et al. 2002). The behavior of the Thwaites Glacier with regard to ice frontal changes and thinning is like that of the Smith Glacier also to its west. Unlike the Petermann Glacier, where there is no past history to suggest its terminus will readvance significantly towards its former position, Thwaites Glacier has experienced large calving events in the past, such as in 2002/03. The difference on this occasion is that the ice tongue was quite small and hence more stable than in previous calving events. The continued thinning makes the readvance and subsequent pinning on the bedrock ridge less likely. The rifting is also quite extensive as MacGregor et al. (2012) have noted, I look forward to the observations that will emerge from NASA’s Operation Ice Bridge in Antarctica that begins in a week.

http://glacierchange.wordpress.com/2012/10/08/thwaites-glacier-tongue-major-calving-event-antarctica/

Tuesday, September 11, 2012

Mauri Pelto on Easton Glacier with Peter Sinclair: phenomenal retreat over last 60 years

from Peter Sinclair: Big Ice and Climate Change:  The View from Easton Glacier


This is the first a number of postings that will document fieldwork this past summer on Easton Glacier in the Northern Cascades.

My guide, Dr. Mauri Pelto, is one of the world’s recognized experts on glacier and ice dynamics and has been documenting the decline of the Cascades glaciers for the last 30 years. I interviewed Mauri on a number of topics –  the first one here gives us an overview of a major North American glacier and its changes over the last century and a half.  Working on more as I go through this material – stay tuned.

http://climatecrocks.com/2012/09/11/big-ice-and-climate-change-the-view-from-easton-glacier/

Tuesday, August 28, 2012

Mauri Pelto: Zachariae Isstrøm further retreat, NE Greenland


by Mauri Pelto, From a Glacier's Perspective, August 27, 2012

In an article Dan Bailey and I published at Skeptical Science, we observed that in northern Greenland high velocities extend far inland only on Zachariae and Petermann Glacier tapping into the midst of the ice sheet in northern Greenland. Further, it is the Zachariae Isstrøm (ZIS) that is likely the only of this group that would be comparable to a bank that is too big to fail as its increased velocity band extends well into the ice sheet. ZIS is one of the three main outlets of the northeast Greenland Ice Stream, Storstrommen and Nioghalvfjerdsfjorden (79N) are the other two.

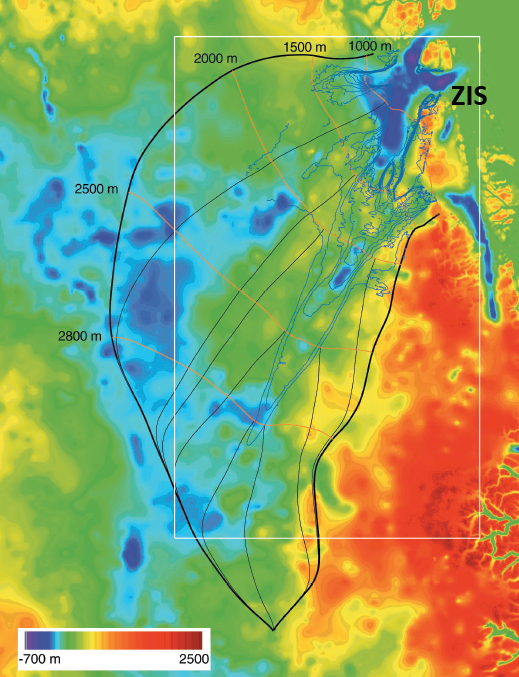
The extent of the high velocity zone is evident in the first image below from the exceptionally detailed work of Joughin et al. (2010), and Joughin et al. (2001). The area of high velocity versus the surrounding ice at over 100 m/year extends 350 km upglacier from the ZIS terminus. The velocity then increased from 100 to 400+ m/year from 200-100 km from the ice front. At the grounding line, the velocity is 1100 m/year (Rignot et al, 2001). The velocity remains high to the ZIS icefront. The width of the ice stream identified by the zone of higher flow is 40 km wide 350 km above the terminus and remains at least 30 km wide all the way to the terminus region. The velocity is lower than on Jakobshavns, but the ice stream is also much wider.
A view of the basal topography from Joughin et al. (2001) indicates that the acceleration occurs in the same area as the bed depth drops significantly below sea level 200 km from the ice front. The base of the glacier is 300-700 meters below sea level all the way to the ice front. The thickness at the grounding line is noted as 550-600 meters by Rignot et al. (2001). The result is an ice flux at the grounding line of ZIS of some 11 cubic kilometers per year, this is much less than the 40+ cubic kilometers from Jakobshavn Isbrae and similar to the 12 cubic kilometers from Petermann Glacier. The red arrows in both images indicates the area of fast ice, discussed below and the yellow arrow the location of the new 2012 ice front.

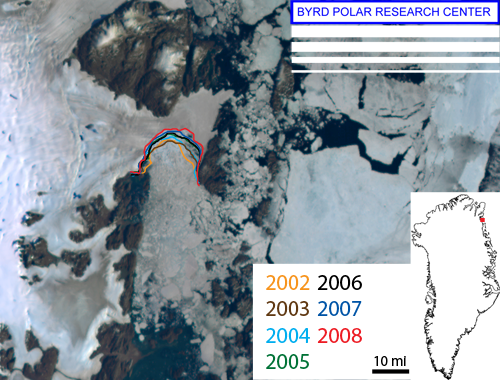
This post examines recent changes in ZIS updating the work of Box and Decker (2011). They noted an average decadal rate of loss of 14 square kilometers/year and the evolving terminus position in the first image below from Jason Box at Meltfactor.org. Box and Decker (2011) also noted a potential advance in 2006-2007, that we will further explore here.

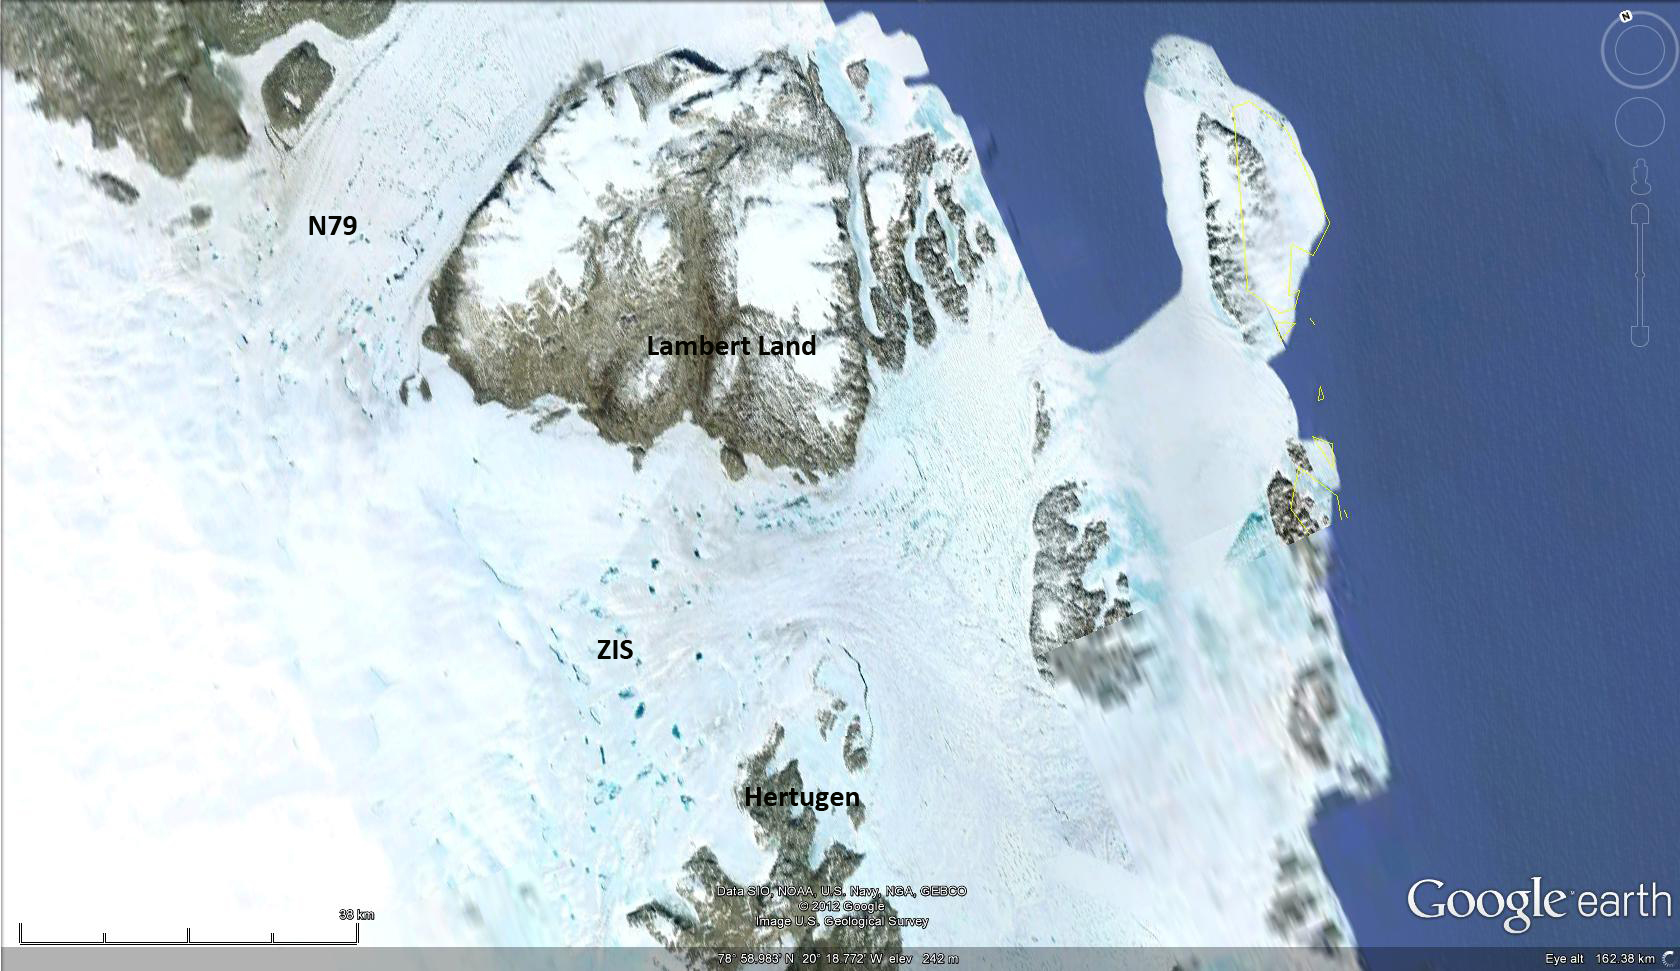
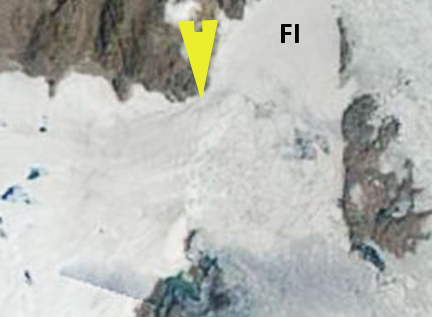
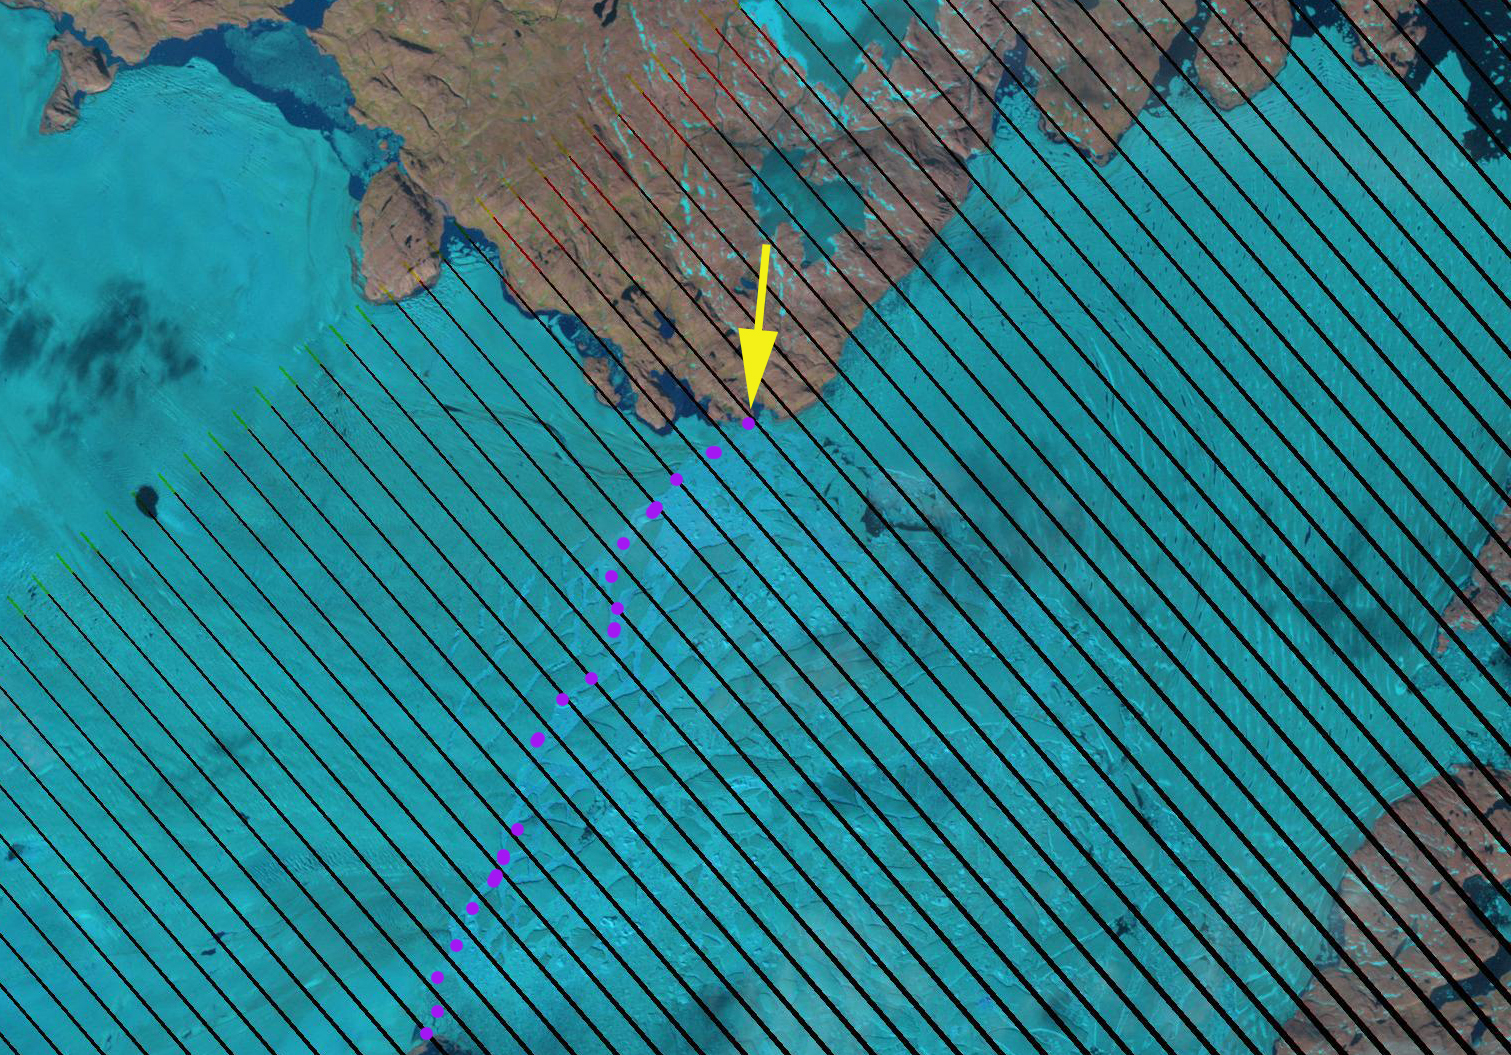
The reduced sea ice in the region has exposed the ZIS terminus to increased open water in what was typically a region that was dominated by persistent sea ice. The enhanced surface melting is also a concern. In 2012 ZIS has experienced an additional retreat that has separated the main glacier from a melange of glacier ice and fast sea ice on the northeast side of the terminus. The changes have been an ongoing watch by several of the participants at the Arctic Sea Ice blog, which has developed into a wonderful community for daily detailed sea ice observations. Espen Olesen and I have discussed the split that occurred this August which warrants pointing out. Here we examine Landsat imagery from 2006, 2008, 2009 and 2010 and MODIS imagery from 2011 and Aug. 19 2012 to depict the changes. The last image is a July 30, 2012, Landsat with the purple terminus line indicated. The images are shown below with the fast ice zone (FI) noted in 2006 and the MODIS images from 2011 and 2012. The new 2012 terminus that has retreated to the corner of is indicated by a yellow arrow. The actual terminus in the Landsat images is indicated by purple dots, but based on the melange that exists on the east side and fast ice on the north side this is not a clear cut distinction. The fast ice is distorted in a convex pattern by the impinging ice front in the Landsat images. The new terminus is at the southeast corner of Lambert land and extends directly southwest to Heretugen Orleans Land.
The retreat follows the calving events on Petermann and Steesnby Glacier. Here there is no single large iceberg to observe. The retreat from 2010 to 2012 is approximately 10 km, the loss of area is particularly hard to accurately determine, today I estimate it is 70 km2, and will look to better derive this estimate from new imagery from Geoeye and other satellites in the coming days and would welcome other such area loss analyses for the 2006-2012 period. The potential advance from 2006-2007 is simply not observed here.

Saturday, August 25, 2012

Steensby Glacier Calving Event and Retreat, northern Greenland, by Mauri Pelto

by Mauri Pelto, From a Glacier's Perspective, August 24, 2012

Steensby Glacier flows north from the Greenland Ice Sheet into the Arctic Ocean between Petermann Glacier to the west and Ryder Glacier to the east. The glacier terminates 100 km up the twisting Sankt George Fjord from the ocean after flowing 60 km down the twisting valley from the ice sheet. This distance and the fact that the fjord empties into the Arctic Ocean would suggest it is less easily reached by warming ocean water to melt the floating glacier tongue. The glacier has a thin floating ice tongue like Petermann Glacier at the terminus with a thickness of 75-105 m. The terminus as a result has a low velocity and would not accelerate and retreat via the same mechanism of backforce reduction that has led to retreat of almost all marine terminating outlet glaciers that do not have large floating ice tongues. The snowline was noted as 800 m in the 1970-1980s, and has in recent years been 1,000 meters (Pelto, 2010). With the warm weather the past two summers it has seemed inevitable that Ryder and Steensby Glacier would have a terminus response. Steensby had last been observed in retreat back in 1947 (Ahnert, 1962). From 1947 to 1976 and since 1976 little had changed. On my return from glacier field work I checked the MODIS daily imagery from 8/15 and saw nothing. This glacier seemed a particularly likely culprit for retreat this summer because the terminus area is such a melange of ice as seen in the 2006 Landsat image (M), and as Ahnert had observed, the crack that created the icebergs is likely the same one visible in 2006 (blue arrows).


On the invaluable blog "Arctic Sea Ice" run by Neven, the calving event was noted by commenters on August 24th by Sphaerica, Twemoran and Espen Olsen. This is what makes the blog so valuable -- many of the participants are actively examining daily satellite imagery and making interesting observations, and as a glaciologist this proves to be a remarkably valuable and interesting resource time and again.
Here we first look at MODIS images of Steensby Glacier from 8/2010, 8/2011, and 2012. The 2012 images are from 8/12, 8/15 , 8/23 and 8/24, with the crack first appearing in the 8/15 and open water appearing on 8/23 and widening by 8/24. The icebergs approximate maximum dimensions are 4 km by 6 km. The last image is a terminus closeup.
[Readers, there are too many images to repost here, so here is the link:  http://glacierchange.wordpress.com/2012/08/25/steensby-glacier-calving-event-and-retreat-northern-greenland/]
Melting has been significant in northern Greenland for three straight summers. In 2010 the first image the melt area is below 1,000 meters at the head of the Steensby Glacier outlet denoted by red arrows, this is a typical pattern of the last few years (P=Petermann, R=Ryder, S=Steensby). In 2012 the area of extensive melt has expanded from a zone around the head of the valley of Steensby and Ryder Glacier near 1,000 m in July (blue arrows) to a wide zone extending all the way from Steensby to Ryder Glacier in August.

Unlike Petermann Glacier, Steensby Glacier does not have a deep connection to the ice sheet as indicated by bedrock maps of the glacier from Bamber et al. (2011). The glacier is much narrower, thinner at the grounding line and its velocity is much less, volume wise -- the Steensby Glacier just lacks the importance in terms of influence on the larger ice sheet that Petermann Glacier has.

Thursday, June 28, 2012

Help support Peter Sinclair's trip to videograph Mauri Pelto's work on glaciers

http://www.kickstarter.com/projects/585166124/climate-crocks-on-ice

ABOUT THIS PROJECT

Over the last 3 and a half years, I've produced more than a hundred videos in the "Climate Denial Crock of the Week" series, and the response has been amazing. I hear from leading climate scientists, oceanographers, glaciologists, and atmospheric scientists every day, who not only love the videos, but use them to teach their students, right up thru graduate level courses. They can do so because all the vids are faithful to the published literature, with copious references that are transparent and easy to check. 
Recently, I was honored to be invited to become a contributor to the prestigious Yale University Forum on Climate Change and the Media, and am now producing monthly projects for them under the title "This is Not Cool".
Many of you also follow the daily postings at the "Climate Crocks" blog, which has become one of the leading "must read" stopovers in the climate-aware blogosphere.
In recent months, I've been privileged more and more to interview and get to know some of the true giants in the field of earth and atmospheric science - and now, I've been invited to join a research team as they make an annual trek to gather data and take readings on a rapidly receding North American Glacier. My host will be one of the world's leading experts on mountain glaciers, Dr. Mauri Pelto, Director of the North Cascade Glacier Climate Project, who has been a frequent advisor, and was one of the first scientists I had the opportunity to interview in researching my series.
I hope to bring even greater immediacy to my viewers and take a closer look at what working, publishing, data-gathering, boots-on-the-ice scientists are seeing and recording every day - the ongoing transformation of planet earth.
Your contribution will make it possible for me to get properly outfitted, travel across the country, spend precious time with Dr. Pelto and his team. I know this is a tough economy for everyone, but I hope you'll consider the value that the Climate Crocks series has brought to the science communication process, and help me take it to a new level.
Thanks to all for your continued support. My promise is to continue to work to make these videos the best, most informative, and entertaining science series on the web.
102
BACKERS
$5,342
PLEDGED OF $4,000 GOAL

15
DAYS TO GO

PLEDGE $25 OR MORE

12 BACKERS
Disc 1 of the three DVD collections of the earliest Climate Crock videos! Save 'em, swap em, collect 'em, show 'em on your local cable channel! Bring 'em to your local tea party meeting and watch the fireworks! Disc One: •Party like its 1998 •2009 Arctic Ice Update •"Creepy at the EPA!" •"Birth of a Climate Crock" •"The Temp Leads Carbon Crock!" (first edition)
Estimated Delivery: Sep 2012

PLEDGE $50 OR MORE

16 BACKERS
Three Disc Set of Climate Crock Classics: Disc One •Party like its 1998 •2009 Arctic Ice Update •"Creepy at the EPA!" •"Birth of a Climate Crock" •"The Temp Leads Carbon Crock!" (first edition) Disc Two •"32,000 Scientists!" •"It's so Cold, there Can't be Global Warming" •"Climate Crock Sacks Hack Attack" Part 1 - the story of 'Climate Gate' •"Climate Crock Sacks Hack Attack" Part 2 •"In the 70s, Scientists Said there'd be an Ice Age" Disc Three •"How do We Know About Climate Change?" •"Flogging the Scientists" •Renewables Solution of the Month: Hybrid Cars •Renewable Solution of the Month: Wind
Estimated Delivery: Sep 2012

PLEDGE $100 OR MORE

20 BACKERS • Limited Reward (55 of 75 remaining)
TRUE collector's item. Limited availability - when they're gone, they're really gone!!! Long before "Climate Crocks", I was a syndicated cartoonist with King Features, and "Alex's Restaurant", the first Green Cartoon Strip, ran (briefly) in papers around the planet. The strip was ahead of its time, but a small number of paperback collections of the classic toons exist, published by Crossing Press in 1993. Pulitzer winner Jim Borgman says, "There are so many strips around with no heart.....Alex's feels real and has a ring to it - the drawing is terrific!" Pulitzer winner Mike Peters says, "The drawings are great, and the IDEAS are wonderful!" Includes 3 disc set of "Climate Crock" DVDs.
Estimated Delivery: Sep 2012

PROJECT BY

Fb_profile_picture.large
Connected as Peter Sinclair (600 friends)
Peter Sinclair is a Human being, a Father, a Husband, a dog owner, and an independent videographer. He resides in Midland, MI.
His video series "Climate Denial Crock of the Week" and "This is Not Cool" have been internationally acclaimed as clear and comprehensive introductions to the most serious issue facing mankind.
Playlist here:
http://www.youtube.com/view_play_list…
  1. climatecrocks.com
  2. twitter.com
  3. youtube.com
  4. yaleclimatemediaforum.org