Steensby Glacier flows north from the Greenland Ice Sheet into the Arctic Ocean between Petermann Glacier to the west and Ryder Glacier to the east. The glacier terminates 100 km up the twisting Sankt George Fjord from the ocean after flowing 60 km down the twisting valley from the ice sheet. This distance and the fact that the fjord empties into the Arctic Ocean would suggest it is less easily reached by warming ocean water to melt the floating glacier tongue. The glacier has a thin floating ice tongue like Petermann Glacier at the terminus with a thickness of 75-105 m. The terminus as a result has a low velocity and would not accelerate and retreat via the same mechanism of backforce reduction that has led to retreat of almost all marine terminating outlet glaciers that do not have large floating ice tongues. The snowline was noted as 800 m in the 1970-1980s, and has in recent years been 1,000 meters (Pelto, 2010). With the warm weather the past two summers it has seemed inevitable that Ryder and Steensby Glacier would have a terminus response. Steensby had last been observed in retreat back in 1947 (Ahnert, 1962). From 1947 to 1976 and since 1976 little had changed. On my return from glacier field work I checked the MODIS daily imagery from 8/15 and saw nothing. This glacier seemed a particularly likely culprit for retreat this summer because the terminus area is such a melange of ice as seen in the 2006 Landsat image (M), and as Ahnert had observed, the crack that created the icebergs is likely the same one visible in 2006 (blue arrows).
On the invaluable blog "Arctic Sea Ice" run by Neven, the calving event was noted by commenters on August 24th by Sphaerica, Twemoran and Espen Olsen. This is what makes the blog so valuable -- many of the participants are actively examining daily satellite imagery and making interesting observations, and as a glaciologist this proves to be a remarkably valuable and interesting resource time and again.
Here we first look at MODIS images of Steensby Glacier from 8/2010, 8/2011, and 2012. The 2012 images are from 8/12, 8/15 , 8/23 and 8/24, with the crack first appearing in the 8/15 and open water appearing on 8/23 and widening by 8/24. The icebergs approximate maximum dimensions are 4 km by 6 km. The last image is a terminus closeup.
[Readers, there are too many images to repost here, so here is the link: http://glacierchange.wordpress.com/2012/08/25/steensby-glacier-calving-event-and-retreat-northern-greenland/]
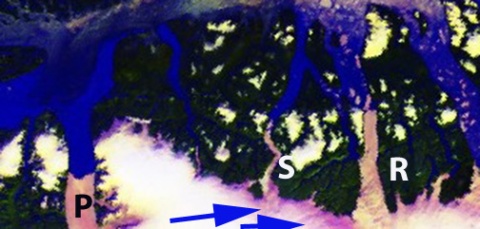
Melting has been significant in northern Greenland for three straight summers. In 2010 the first image the melt area is below 1,000 meters at the head of the Steensby Glacier outlet denoted by red arrows, this is a typical pattern of the last few years (P=Petermann, R=Ryder, S=Steensby). In 2012 the area of extensive melt has expanded from a zone around the head of the valley of Steensby and Ryder Glacier near 1,000 m in July (blue arrows) to a wide zone extending all the way from Steensby to Ryder Glacier in August.


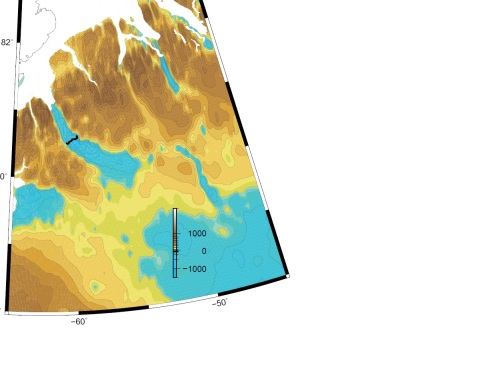
Unlike Petermann Glacier, Steensby Glacier does not have a deep connection to the ice sheet as indicated by bedrock maps of the glacier from Bamber et al. (2011). The glacier is much narrower, thinner at the grounding line and its velocity is much less, volume wise -- the Steensby Glacier just lacks the importance in terms of influence on the larger ice sheet that Petermann Glacier has.


No comments:
Post a Comment