Blog Archive

Tuesday, September 3, 2019

Dorian Hammering Grand Bahama Island: Prolonged Storm Surge Threat Ahead for Southeast U.S.

September 2, 2019, 1:34 PM EDT


Above: @astro_christina captured this image of #HurricaneDorian on September 2, 2019 from the space station.
After thrashing Great Abaco Island on Saturday, Dorian has parked over Grand Bahama Island, which has been getting the most fierce and prolonged battering from an extreme Atlantic hurricane in history. According to the NOAA historical hurricane database, the only comparable Category 5 beating is the one administered to Honduras by Hurricane Mitch of 1998, which spent 12 hours within 50 miles of the island of Guanaja as a Category 5 storm. However, Mitch's eye did not stay parked over land like Dorian's has.
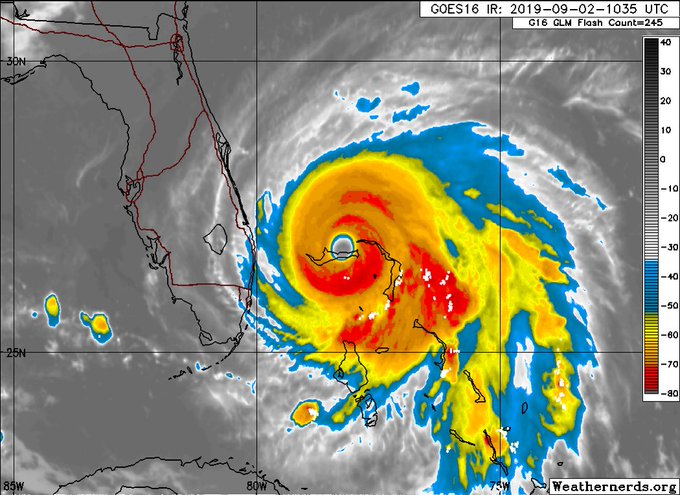
At 3 pm EDT, Dorian was centered about 25 miles east-northeast of Freeport, moving west-northwest at just 1 mph. The hurricane’s eyewall has been slamming the island since 9 pm EDT Sunday, and storm surge has been extreme and prolonged over many areas. Sustained winds were 150 mph, not far below Category 5 strength. However, Hurricane Hunters confirmed a break in the eyewall on Monday afternoon, and the central pressure had risen to 941 millibars, so we can expect Dorian's strength to be further downgraded on Monday evening.
“These hazards will continue over Grand Bahama Island during most of the day, causing extreme destruction on the island,” said the National Hurricane Center in a noon update. There have been multiple reports of storm-surge flooding forcing residents to take shelter in attics.
“The Bahamas is presently at war and being attacked by Hurricane Dorian,” Prime Minister Dr. Hubert Minnis told the Nassau Guardian. “And yet, it has no weapon at its disposal to defend itself during such an assault by this enemy.”

This is a topographic map of Grand Bahama island.

Green: 0-15 ft
Yellow: 15-30 ft
Red: 30+ ft

Dorian's storm surge is estimated at 18-23 ft, which would submerge everything in green and significant parts of the yellow. Hopefully most people managed to move to safe locations.

View image on Twitter

629 people are talking about this

Storm surge: the biggest U.S. threat from Dorian

After days of uncertainty on crucial aspects of Dorian’s track, computer models came into sharper agreement on Sunday night. The 0Z ensemble model runs from the European and GFS models closely agreed that Dorian will arc northeastward just off the coast from east central Florida on Tuesday to south of North Carolina by Friday. A small minority (about 10%) of ensemble tracks produce brief, grazing landfalls.
The latest 12Z Monday runs of the four track models that performed best in the two-day time range in 2018—the European, UKMET, HWRF, and GFS—have all fallen in line with a track about 50 - 80 miles from the coast of Florida and Georgia, then growing very close to the coast or making landfall in the Carolinas. Hurricane watches are not issued until 48 hours before a landfall threat, so we can expect such watches to be extended up the Southeast coast over the next day or two as the threat unfolds. Remember that the average error in a 24-hour NHC forecast is about 40 miles, and a 48-hour forecast is typically in error by about 65 miles.


The long awaited stall of occurred last night, unfortunately over island ☹️

As it remains stalled, it is upwelling cooler water underneath. We see this effect via warming cloud tops near the center. More weakening expected in the short term.
Here is the 24h HWRF forecast for parent domain just looking at the SST field underneath. You can follow the cold wake of the storm track, but notice the <26c br="" dorian.="" ssts="" under="">
This would likely induce continued weakening until Dorian moves away from its own cold wake.

View image on Twitter

32 people are talking about this

Comparing Dorian and Matthew

The consensus track for Dorian bears a close resemblance to that of 2016’s Hurricane Matthew, which caused more than $10 billion in U.S. damage as it curled very near the coast from Florida to North Carolina on a coast-hugging track. The lastest NHC forecast has Dorian following Matthew's track within about 20 miles, all the way from central Florida to South Carolina. What are the similarities and differences?
Size: Dorian is about the same size as Matthew. During its track up the Southeast U.S. coast, Matthew had hurricane-force winds that extended out about 45 mlies to the northwest of the center, and tropical storm-force winds that extended out about 120 miles. For Wednesday, NHC is predicting that Dorian's hurricane-force and tropical storm-force winds will extend out 40 and 120 miles to the northwest, respectively.
Speed: Dorian will be a slower mover than Matthew, especially near Florida. Matthew took a day and a half to get from just east of Florida's Space Coast to just south of Wilmington, North Carolina. Dorian is predicted to take about two days to cover the same territory. As a result, water will pile up along the Southeast coast ahead of Dorian for a longer period than with Matthew, and peak flooding may extend over multiple tidal cycles.
Strength: Dorian will probably be about as strong as Matthew, perhaps a little stronger. Dorian will likely weaken to Category 3 strength as it moves near northern Florida, and it will likely be a Category 1 or 2 off North Carolina. This is quite similar to the weakening that Matthew experienced, although Matthew was already a minimal Category 1 by the time it reached northern South Carolina.
Track: It’s uncertain at this point exactly where Dorian may track closer to or farther from the coast than Matthew. Matthew made landfall just north of Charleston, South Carolina as a Category 1 hurricane. Dorian is more likely to make landfall in North Carolina, according to the latest NHC forecast.
All told, Dorian will have the potential to produce some of the largest storm surges on record along the Southeast coast, and will likely be a multi-billion dollar storm due to storm surge damages alone. Whether or not local all-time records occur, as they did during Matthew in 2016 at several locations, will hinge on Dorian’s exact track, timing, and strength.

Dorian is not moving into a strong preexisting frontal zone, so rainfall well inland will not be excessive, at least initially. The most concerning area for potential inland flooding is North Carolina, as by the time Dorian reaches this location (around Friday) it may be producing an expansive shield of rains to its north and northeast. Widespread rains of 5-10” and localized amounts well over 10” may be possible across eastern North Carolina, which was devastated by massive inland flooding during Matthew as well as during Florence (2018) and Floyd (1999).

President Trump says he didn’t know Category 5 hurricanes existed

On Sunday, President Trump expressed his surprise over Hurricane Dorian’s Category 5 strength, saying:
“I’m not sure I’ve ever even heard of a Category 5. I knew it existed. And I’ve seen some Category 4s. You don’t even see them that much. But a Category 5 is something that, uh, I don’t know that I’ve never even heard the term, other than I know it’s there. That’s the ultimate. And that’s what we have, unfortunately.”
But the President knew full well that Category 5 hurricanes exist, based on his past comments. As reported today by the Capital Weather Gang’s Andrew Freedman, Trump has expressed shock at the existence of Category 5 storms at least two other times: during Hurricane Irma in 2017 (“never even knew a Category 5 existed”) and Hurricane Michael in 2018 (never heard about Category 5s before.”) Oddly, though, Trump has repeatedly called Hurricane Maria, which devastated Puerto Rico in 2017, a Category 5—even though it was a Category 4 at landfall. Troublingly, since the president is in charge of ordering disaster relief in the wake of a hurricane, his Category 5 misconceptions could lead to a slowing or mis-allocation of resources.

President Donald Trump on the existence of Category 5 hurricanes, 2017-2019.

View image on Twitter

22.7K people are talking about this

Trump’s Category 5 blindness is also financially dangerous for a businessman who owns a multi-million-dollar property on a barrier island in a hurricane storm surge zone--the Mar-a-Largo resort in Palm Beach, Florida. NOAA’s National Storm Surge Hazard Maps database predicts that Mar-a-Largo would see inundations of up to 3 – 6’ on the back-bay side during a Category 5 hurricane. The resort was evacuated and boarded up for Dorian, after a 1 pm Sunday evacuation order was given for the barrier island.
Also concerning is the President’s failure to understand the size of Dorian. On Sunday, he tweeted: "In addition to Florida – South Carolina, North Carolina, Georgia, and Alabama, will most likely be hit (much) harder than anticipated. Looking like one of the largest hurricanes ever.”
In these comments, President Trump confused the strength of the storm for its size. The intensity of a hurricane’s peak winds is not correlated with the areal size, and Dorian is an average-sized hurricane whose winds will come nowhere close to affecting Alabama. Officials there had to scramble to put out statements refuting the President’s misinformation. Unfortunately, he repeated the claim later at a FEMA press conference. He told journalists: "And Alabama could even be in for at least some very strong winds and something more than that, it could be. This just came up, unfortunately. It's the size of the storm that we're talking about. So, for Alabama, just please be careful also.”
Finally, we should be concerned about the President’s reported willingness to use nuclear weapons on hurricanes. According to an August 25, 2019 report from Axios, citing inside sources, during one hurricane briefing at the White House, Trump said (paraphrasing the president's remarks): "I got it. I got it. Why don't we nuke them? They start forming off the coast of Africa, as they're moving across the Atlantic, we drop a bomb inside the eye of the hurricane and it disrupts it. Why can't we do that? Trump has denied making the statement.
If one were to detonate a nuclear device in the eyewall of a hurricane, the radioactive fallout would very efficiently be carried high into the atmosphere due to the tremendous upper-level outflow that ventilates a hurricane. In a matter of days, radioactive fallout would be carried around the globe by the sub-tropical jet stream, contaminating rainfall over a huge area. The blast would also have little or no impact on the hurricane, since the amount of energy released by a nuclear device is puny compared to what a hurricane generates. It is also illegal under the terms of the Peaceful Nuclear Explosions Treaty between the U.S. and the former Soviet Union to explode a nuclear weapon in the atmosphere.
Dr. Jeff Masters co-wrote this post, including the section on President Trump.

Tuesday, July 30, 2019

The terrible truth of climate change

by Joëlle Gergis, The Monthly, 2019

The latest science is alarming, even for climate scientists

In June, I delivered a keynote presentation on Australia’s vulnerability to climate change and our policy challenges at the annual meeting of the Australian Meteorological and Oceanographic Society, the main conference for those working in the climate science community. I saw it as an opportunity to summarize the post-election political and scientific reality we now face.

As one of the dozen or so Australian lead authors on the United Nations Intergovernmental Panel on Climate Change’s (IPCC) 6th Assessment Report, currently underway, I have a deep appreciation of the speed and severity of climate change unfolding across the planet. Last year I was also appointed as one of the scientific advisers to the Climate Council, Australia’s leading independent body providing expert advice to the public on climate science and policy. In short, I am in the confronting position of being one of the few Australians who sees the terrifying reality of the climate crisis.

Preparing for this talk I experienced something gut-wrenching. It was the realization that there is now nowhere to hide from the terrible truth.

The last time this happened to me, I was visiting my father in hospital following emergency surgery for a massive brain haemorrhage. As he lay unconscious in intensive care, I examined his CT scan with one of the attending surgeons who gently explained that the dark patch covering nearly a quarter of the image of his brain was a pool of blood. Although they had done their best to drain the area and stem the bleeding, the catastrophic nature of the damage was undeniable. The brutality of the evidence was clear – the full weight of it sent my stomach into freefall.

The results coming out of the climate science community at the moment are, even for experts, similarly alarming.

One common metric used to investigate the effects of global warming is known as “equilibrium climate sensitivity,” defined as the full amount of global surface warming that will eventually occur in response to a doubling of atmospheric CO2 concentrations compared to pre-industrial times. It’s sometimes referred to as the holy grail of climate science because it helps quantify the specific risks posed to human society as the planet continues to warm.

We know that CO2 concentrations have risen from pre-industrial levels of 280 parts per million (ppm) to approximately 410 ppm today, the highest recorded in at least three million years. Without major mitigation efforts, we are likely to reach 560 ppm by around 2060.

When the IPCC’s 5th Assessment Report was published in 2013, it estimated that such a doubling of CO2 was likely to produce warming within the range of 1.5 to 4.5 °C as the Earth reaches a new equilibrium. However, preliminary estimates calculated from the latest global climate models (being used in the current IPCC assessment, due out in 2021) are far higher than with the previous generation of models. Early reports are predicting that a doubling of CO2 may in fact produce between 2.8 and 5.8 °C of warming. Incredibly, at least 8 of the latest models produced by leading research centers in the United States, the United Kingdom, Canada and France are showing climate sensitivity of 5 °C or warmer.

When these results were first released at a climate modelling workshop in March this year, a flurry of panicked emails from my IPCC colleagues flooded my inbox. What if the models are right? Has the Earth already crossed some kind of tipping point? Are we experiencing abrupt climate change right now?

The model runs aren’t all available yet, but when many of the most advanced models in the world are independently reproducing the same disturbing results, it’s hard not to worry.

When the UN’s Paris Agreement was adopted in December 2015, it defined a specific goal: to keep global warming to well below 2 °C and as close as possible to 1.5 °C above pre-industrial levels (defined as the climate conditions experienced during the 1850–1900 period). While admirable in intent, the agreement did not impose legally binding limits on signatory nations and contained no enforcement mechanisms. Instead, each country committed to publicly disclosed Nationally Determined Contributions (NDCs) to reduce emissions. In essence, it is up to each nation to act in the public interest.

Even achieving the most ambitious goal of 1.5 °C will see the further destruction of between 70 and 90% of reef-building corals compared to today, according to the IPCC’s “Special Report on Global Warming of 1.5 °C,” released last October. With 2 °C of warming, a staggering 99% of tropical coral reefs disappear. An entire component of the Earth’s biosphere – our planetary life support system – would be eliminated. The knock-on effects on the 25% of all marine life that depends on coral reefs would be profound and immeasurable.

So how is the Paris Agreement actually panning out?

In 2017, we reached 1 °C of warming above global pre-industrial conditions. According to the UN Environment Program’s “Emissions Gap Report,” released in November 2018, current unconditional NDCs will see global average temperature rise by 2.9 to 3.4 °C above pre-industrial levels by the end of this century.

To restrict warming to 2 °C above pre-industrial levels, the world needs to triple its current emission reduction pledges. If that’s not bad enough, to restrict global warming to 1.5 °C, global ambition needs to increase five-fold.

Meanwhile, the Australian federal government has a target of reducing emissions by 26 to 28% below 2005 levels by 2030, which experts believe is more aligned with global warming of 3 to 4 °C. Despite Prime Minister Scott Morrison’s claim that we will meet our Paris Agreement commitments “in a canter,” the UNEP report clearly identifies Australia as one of the G20 nations that will fall short of achieving its already inadequate NDCs by 2030.

Even with the 1 °C of warming we’ve already experienced, 50% of the Great Barrier Reef is dead. We are witnessing catastrophic ecosystem collapse of the largest living organism on the planet. As I share this horrifying information with audiences around the country, I often pause to allow people to try and really take that information in.

Increasingly after my speaking events, I catch myself unexpectedly weeping in my hotel room or on flights home. Every now and then, the reality of what the science is saying manages to thaw the emotionally frozen part of myself I need to maintain to do my job. In those moments, what surfaces is pure grief. It’s the only feeling that comes close to the pain I felt processing the severity of my dad’s brain injury. Being willing to acknowledge the arrival of the point of no return is an act of bravery.

But these days my grief is rapidly being superseded by rage. Volcanically explosive rage. Because in the very same IPCC report that outlines the details of the impending apocalypse, the climate science community clearly stated that limiting warming to 1.5 °C is geophysically possible.

Past emissions alone are unlikely to raise global average temperatures to 1.5 °C above pre-industrial levels. The IPCC report states that any further warming beyond the 1 °C already recorded would likely be less than 0.5 °C over the next 20 to 30 years, if all anthropogenic greenhouse gas emissions were reduced to zero immediately. That is, if we act urgently, it is technically feasible to turn things around. The only thing missing is strong global policy.

Although the very foundation of human civilization is at stake, the world is on track to seriously overshoot our UN targets. Worse still, global carbon emissions are still rising. In response, scientists are prioritizing research on how the planet has responded during other warm periods in the Earth’s history.

The most comprehensive summary of conditions experienced during past warm periods in the Earth’s recent history was published in June 2018 in one of our leading journals, Nature Geoscience, by 59 leading experts from 17 countries. The report concluded that warming of between 1.5 and 2 °C in the past was enough to see significant shifts in climate zones, and land and aquatic ecosystems “spatially reorganize.”

These changes triggered substantial long-term melting of ice in Greenland and Antarctica, unleashing 6 to 13 meters of global sea-level rise lasting thousands of years.

Examining the Earth’s climatic past tells us that even between 1.5 and 2 °C of warming sees the world reconfigure in ways that people don’t yet appreciate. All bets are off between 3 and 4 °C, where we are currently headed. Parts of Australia will become uninhabitable, as other areas of our country become increasingly ravaged by extreme weather events.

This year the Australian Meteorological and Oceanographic Society’s annual conference was held in Darwin, where the infamous Cyclone Tracy struck on Christmas Day in 1974, virtually demolishing the entire city. More than 70% of the city’s buildings, including 80% of its houses, were destroyed. Seventy-one people were killed and most of the 48,000 residents made homeless. Conditions were so dire that around 36,000 people were evacuated, many by military aircraft. It was a disaster of monumental proportions.

As I collated this information for my presentation, it became clear to me that Cyclone Tracy is a warning. Without major action, we will see tropical cyclones drifting into areas on the southern edge of current cyclone zones, into places such as southeast Queensland and northern New South Wales, where infrastructure is not ready to cope with cyclonic conditions.

These areas currently house more than 3.6 million people; we simply aren’t prepared for what is upon us.

There is a very rational reason why Australian schoolkids are now taking to the streets – the immensity of what is at stake is truly staggering. Staying silent about this planetary emergency no longer feels like an option for me either. Given how disconnected policy is from scientific reality in this country, an urgent and pragmatic national conversation is now essential. Otherwise, living on a destabilized planet is the terrible truth that we will all face.

As a climate scientist at this fraught point in our history, the most helpful thing I can offer is the same professionalism that the doctor displayed late that night in Dad’s intensive-care ward. A clear-eyed and compassionate look at the facts.

We still have time to try and avert the scale of the disaster, but we must respond as we would in an emergency. The question is, can we muster the best of our humanity in time?

Joëlle Gergis

Joëlle Gergis is an award-winning climate scientist and writer based at the Australian National University. She is the author of Sunburnt Country: The History and Future of Climate Change in Australia.

© 2019 The Monthly. All rights reserved.


https://www.themonthly.com.au/issue/2019/august/1566136800/jo-lle-gergis/terrible-truth-climate-change

Sunday, June 23, 2019

Natalia Shakhova, Igor Semiletov & Evgeny Chuvilin: "Understanding the Permafrost–Hydrate System and Associated Methane Releases in the East Siberian Arctic Shelf"; doi.org/10.3390/geosciences9060251

Geosciences, 9(6) (2019) 251
Understanding the Permafrost–Hydrate System and Associated Methane Releases in the East Siberian Arctic Shelf
1
Institute of Natural Resources, National Tomsk Research Polytechnic University, 30 Prospect Lenina, Tomsk 634050, Russia
2
International Arctic Research Center, University Alaska Fairbanks, Akasofu Building, Fairbanks, AK 99775-7320, USA
3
Pacific Oceanological Institute, Russian Academy of Science, 41 Baltiiskaya Street, Vladivostok 690022, Russia
4
Moscow Institute of Physics and Technology, 9 Institutskiy per., Dolgoprudny, Moscow Region 141701, Russia
5
Science and Education Center, Northern (Arctic) Federal University, Naberezhnaya Severnoy Dvini, 17, Arkhangelsk 163002, Russia
6
Skolkovo Institute of Science and Technology (Skoltech), 3, Nobel st., Innovation Center Skolkovo, Moscow 121205, Russia
*
Author to whom correspondence should be addressed.
Received 4 April 2019; accepted 3 June 2019; published 5 June 2019.

Abstract

This paper summarizes current understanding of the processes that determine the dynamics of the subsea permafrost–hydrate system existing in the largest, shallowest shelf in the Arctic Ocean; the East Siberian Arctic Shelf (ESAS). We review key environmental factors and mechanisms that determine formation, current dynamics, and thermal state of subsea permafrost, mechanisms of its destabilization, and rates of its thawing; a full section of this paper is devoted to this topic. Another important question regards the possible existence of permafrost-related hydrates at shallow ground depth and in the shallow shelf environment. We review the history of and earlier insights about the topic followed by an extensive review of experimental work to establish the physics of shallow Arctic hydrates. We also provide a principal (simplified) scheme explaining the normal and altered dynamics of the permafrost–hydrate system as glacial–interglacial climate epochs alternate. We also review specific features of methane releases determined by the current state of the subsea-permafrost system and possible future dynamics. This review presents methane results obtained in the ESAS during two periods: 1994–2000 and 2003–2017. A final section is devoted to discussing future work that is required to achieve an improved understanding of the subject.
Open access:  https://www.mdpi.com/2076-3263/9/6/251/htm