Blog Archive

Showing posts with label Josh Willis. Show all posts

Wednesday, March 16, 2016

NASA: Greenland is melting and it's time to pay attention

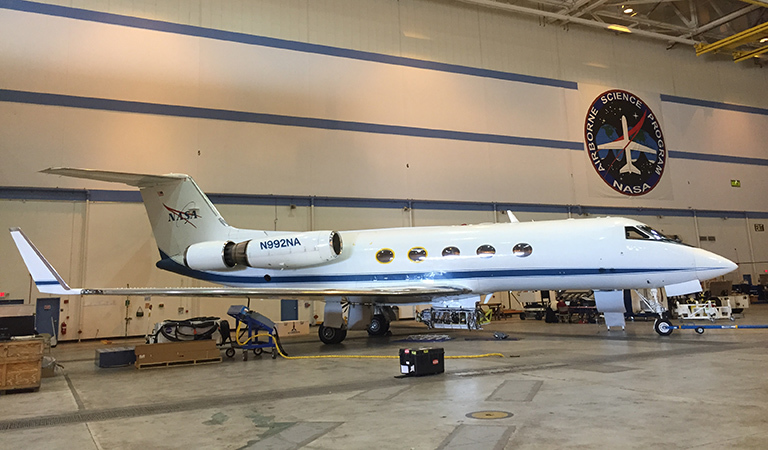
One of NASA's modified G-III aircraft in the hangar at Armstrong Flight Research Center being prepped for a mission to study glaciers around Greenland.
by Laura Faye Tenenbaum, NASA Climate Blog "Earth Right Now," March 16, 2016

Yes, yes, Greenland is melting. You already knew that…probably. And the giant flux of fresh water pouring out of the second largest ice sheet on the planet isn’t slowing down anytime soon. Greenland’s ice melt is actually accelerating. In the last decade alone, NASA’s twin GRACE satellites measured it shedding 2 trillion tons of ice like a fire hose pouring fresh water into the North Atlantic.
But it’s easier to focus on politics, celebrity gossip, reality TV and cat videos than on Earth’s climate. It seems like everyone’s all “Greenland? Who cares. Whatever. Next.” And that upsets me.
Is it really that easy to pretend the effects of global warming don’t exist?
We overlook Greenland ice loss at our own peril. It’s one of the largest contributors to accelerating sea level rise, and in the U.S. alone, nearly 5 million people live in 2.6 million homes at less than 4 feet above high tide. If you happen to be one of them, you should definitely pay attention to Greenland.   
Fortunately for all of us, NASA is paying attention to Greenland in a big way. We’re so concerned about the amount of ice loss that we’ve named a Greenland observing expedition Oceans Melting Greenland, or OMG for short, because that's the most appropriate response to the phenomenon.
Dr. Josh Willis oversees integration of the GLISTIN-A radar instrument to the belly of the aircraft.
This week, OMG heads up north on one of NASA’s G-III modified airplanes to continue a five-year mission that will look closely at how warming ocean water interacts with glaciers surrounding Greenland and melts them. The project began this past year by mapping undersea canyons via a ship equipped with an echo sounder. For this next part of the investigation, a radar instrument attached to the bottom of the G-III, called the Airborne Glacier and Land Ice Surface Topography Interferometer (GLISTIN-A), will be able to measure precisely how much the oceans are eating away at the edges of the ice on a glacier-by-glacier basis.
Instrument integration (a fancy word for attaching instruments to planes and making sure they work and don’t come loose) went down at NASA’s Armstrong Flight Research Center, and Principal Investigator Dr. Josh Willis, Project Manager Steve Dinardo, Co-Investigator Dr. Ian Fenty and I headed there to check it out.

Glaciers on the edge 

As the technicians and engineers tweaked fistfuls of wires, we crawled in, under, through and around the aircraft. Then Dr. Ian Fenty (who helped design the flight plan) and I sat aboard our flying science lab and talked ice loss for a while. “We often find that a glacier that’s been retreating a lot might be in 1,000 feet of water,” he explained. “Whereas the glacier that’s not thinning very much is in water that’s only 100 or 200 feet deep.” That’s because the layers of ocean water around Greenland are in a very unique situation, where you have colder fresh glacier meltwater near the surface over salty ocean water that, due to climate change, has been warming. The water found at 600 feet and below is a relatively warm 4 degrees Celsius compared with the surface water, which is just near freezing at 0 degrees. This means that the “primary suspect” behind the acceleration of Greenland’s melting glaciers is the warming ocean waters that can get right up against the edge and interact with the glacier itself.
As the surface of lower elevation glaciers melts, the water percolates through the ice and forms giant subglacial channels, like a river system under the ice. If the ice running through these narrow rivers breaks off, the friction between the glacier and the substrate gets reduced a bit and literally stretches the ice so the glacier thins out. OMG’s GLISTIN-A radar is going to measure the height of the ice. “If we see a change in elevation from one year to the next, we can know how much ice is being lost and how much the movement of the glacier is speeding up.” Over the next five years OMG plans to go back to Greenland to look for more changes.
NASA technicians put the final touches on the GLISTIN-A instrument.
As I left the hangar and headed home, I thought about how Greenland is such a weird part of the world and how much I hope our society can put aside its troubles so we can work together to preserve it.
Find out more about Oceans Melting Greenland here.
Thank you for your comments.
Laura

Sunday, April 5, 2015

Greenland has massive lakes beneath the ice, repeatedly filling and draining away


In April 2014, researchers flew over a site in southwest Greenland to find that a sub-glacial lake had drained away. This photo shows the crater left behind, as well as a deep crack in the ice.  Credit: Photo by Stephen Price, Los Alamos National Laboratory, courtesy of The Ohio State University. [Click to enlarge image]
Researchers who are building the highest-resolution map of the Greenland Ice Sheet to date have made a surprising discovery: two lakes of meltwater that pooled beneath the ice and rapidly drained away.
One lake once held billions of gallons of water and emptied to form a mile-wide crater in just a few weeks. The other lake has filled and emptied twice in the last two years.
Researchers at Ohio State University published findings on each lake separately: the first in the open-access journal The Cryosphere and the second in the journal Nature.
Ian Howat, associate professor of earth sciences at Ohio State, leads the team that discovered the cratered lake described in The Cryosphere. To him, the find adds to a growing body of evidence that meltwater has started overflowing the ice sheet's natural plumbing system and is causing "blowouts" that simply drain lakes away.
"The fact that our lake appears to have been stable for at least several decades, and then drained in a matter of weeks -- or less -- after a few very hot summers, may signal a fundamental change happening in the ice sheet," Howat said.
The two-mile-wide lake described in Nature was discovered by a team led by researcher Michael Willis of Cornell University. Michael Bevis, Ohio Eminent Scholar in Geodynamics and professor of earth sciences at Ohio State, is a co-author of the Nature paper, and he said that the repeated filling of that lake is worrisome.
Each time the lake fills, the meltwater carries stored heat, called latent heat, along with it, reducing the stiffness of the surrounding ice and making it more likely to flow out to sea, he said.
Bevis explained the long-term implications.
"If enough water is pouring down into the Greenland Ice Sheet for us to see the same sub-glacial lake empty and re-fill itself over and over, then there must be so much latent heat being released under the ice that we'd have to expect it to change the large-scale behavior of the ice sheet," he said.
Howat's team was first to detect the cratered lake described in The Cryosphere, on a spot about 50 kilometers (31 miles) inland from the southwest Greenland coast earlier in 2014. There, previous aerial and satellite imagery indicates that a sub-glacial lake pooled for more than 40 years. More recent images suggest that the lake likely emptied through a meltwater tunnel beneath the ice sheet some time in 2011.
The crater measures 2 kilometers (1.2 miles) across and around 70 meters (230 feet) deep. Researchers calculated that the lake that formed it likely contained some 6.7 billion gallons of water.
That's not a large lake by most reckoning, but it's roughly the same size as the combined reservoirs that supply water to the Columbus, Ohio, metropolitan area's 1.9 million residents. And it disappeared in a single season -- remarkably quickly by geologic standards. Howat characterized the sudden drainage as "catastrophic."
Researchers suspect that, as more meltwater reaches the base of the ice sheet, natural drainage tunnels along the Greenland coast are cutting further inland, Howat explained. The tunnels carry heat and water to areas that were once frozen to the bedrock, potentially causing the ice to melt faster.
"Some independent work says that the drainage system has recently expanded to about 50 kilometers inland of the ice edge, which is exactly where this lake is," he added.
It's possible that the lake was tapped by one of the invading tunnels. It's also possible that thousands of such lakes dot the Greenland coast. They are hard to detect with radar, and researchers don't know enough about why and how they form. In contrast to Antarctica, researchers know much less about what's happening under the ice in Greenland.
"Until we get a good map of the bed topography where this lake was, we have no idea whatsoever how many lakes could be out there," Howat said. "There may be something really weird in the bed in this particular spot that caused water to accumulate. But, if all you need is a bumpy surface a bit inland from the coast, then there could be thousands of little lakes."
Howat and his team flew over the site in southwest Greenland in April 2014, after they realized that detection of the crater, nestled in the midst of a flat ice expanse, was not just an error in the high-resolution surface data they've been collecting. Using DigitalGlobe Inc.'s Worldview satellites, they're assembling a Greenland ice map with 2-meter (approximately 6.5-feet) resolution.
Bevis and his colleagues discovered the lake described in Nature under similar circumstances in March 2013. They were gathering data to supplement their long-standing efforts to weigh the Greenland Ice Sheet with GPS and spotted the mitten-shaped lake by accident.
Using data from Worldview and NASA's Operation IceBridge, the Cornell-led team calculated that the lake filled and emptied twice since 2012, at one point experiencing a sub-surface blowout that drove water from the lake at a volume of 215 cubic meters (nearly 57,000 gallons -- close to the volume of a 30-foot-by-50-foot backyard swimming pool) every second.
Though researchers have long known of the existence of sub-glacial lakes, never before have they witnessed any draining away. The sudden discovery of two -- one of which seems to be refilling and draining repeatedly -- signals to Bevis that Greenland ice loss has likely reached a milestone.
"It's pretty telling that these two lakes were discovered back to back," he said. "We can actually see the meltwater pour down into these holes. We can actually watch these lakes drain out and fill up again in real time. With melting like that, even the deep interior of the ice sheet is going to change."
Coauthors on the paper in The Cryosphere include Myoung-Jong Noh, a postdoctoral researcher, and Seongsu Jeong, a doctoral student, both of earth sciences at Ohio State; Claire Porter of the Polar Geospatial Center at the University of Minnesota; and Ben Smith of the Polar Science Center of the University of Washington.
Coauthors on the paper in Nature include Bradley Herried of the University of Minnesota and Robin Bell of Columbia University. Willis holds a joint appointment at the University of North Carolina, Chapel Hill.
These projects were funded by NASA and the National Science Foundation.

Story Source
The above story is based on materials provided by Ohio State University. The original article was written by Pam Frost Gorder. Note: Materials may be edited for content and length.

Journal References
  1. Michael J. Willis, Bradley G. Herried, Michael G. Bevis, Robin E. Bell. Recharge of a subglacial lake by surface meltwater in northeast Greenland. Nature, 2015; DOI: 10.1038/nature14116
  2. I. M. Howat, C. Porter, M. J. Noh, B. E. Smith, S. Jeong. Brief Communication: Sudden drainage of a subglacial lake beneath the Greenland Ice Sheet. The Cryosphere, 2015; 9 (1): 103 DOI: 10.5194/tc-9-103-2015.

Tuesday, August 20, 2013

"A review of global ocean temperature observations: Implications for ocean heat content estimates and climate change," by John Abraham et al., Rev. Geophys., 2013; doi: 10.1002/rog.20022

Review of Geophysics, 2013; DOI: 10.1002/rog.20022

A review of global ocean temperature observations: Implications for ocean heat content estimates and climate change


  1. J. P. Abraham1,*
  2. M. Baringer2
  3. N. L. Bindoff3,6,8
  4. T. Boyer4
  5. L. J. Cheng5
  6. J. A. Church6
  7. J. L. Conroy7
  8. C. M. Domingues8,
  9. J. T. Fasullo9
  10. J. Gilson10
  11. G. Goni2
  12. S. A. Good11
  13. J. M. Gorman1
  14. V. Gouretski12,
  15. M. Ishii13
  16. G. C. Johnson14
  17. S. Kizu15
  18. J. M. Lyman14,16
  19. A. M. Macdonald17
  20. W. J. Minkowycz18
  21. S. E. Moffitt19,20
  22. M. D. Palmer11
  23. A. R. Piola21
  24. F. Reseghetti22,
  25. K. Schuckmann23
  26.  K. 
  27. E. Trenberth9
  28. I. Velicogna24,25, and 
  29. J. K. Willis25
Abstract


The evolution of ocean temperature measurement systems is presented with a focus on the development and accuracy of two critical devices in use today (expendable bathythermographs and CTDs – conductivity-temperature-depth instruments used on Argo floats). A detailed discussion of the accuracy of these devices and a projection of the future of ocean temperature measurements are provided. The accuracy of ocean temperature measurements is discussed in detail in the context of ocean heat content, Earth's energy imbalance, and thermosteric sea level rise. Up-to-date estimates are provided for these three important quantities. The total energy imbalance at the top-of-atmosphere is best assessed by taking an inventory of changes in energy storage. The main storage is in the ocean; the latest values of which are presented. Furthermore, despite differences in measurement methods and analysis techniques, multiple studies show that there has been a multi-decadal increase in the heat content of both the upper and deep ocean regions, which reflect the impact of anthropogenic warming. With respect to sea-level rise, mutually reinforcing information from tide gauges and radar altimetry show that presently, sea-level is rising at approximately 3 mm yr-1 with contributions from both thermal expansion and mass accumulation from ice melt. The latest data for thermal expansion sea-level rise are included here and analyzed.

http://onlinelibrary.wiley.com/doi/10.1002/rog.20022/abstract

Thursday, February 2, 2012

Peter Sinclair: JPL’s Josh Willis Looks Ahead to Continuing Sea Level Rise

JPL’s Josh Willis Looks Ahead to Continuing Sea Level Rise

In the first of a new series, Jet Propulsion Lab climate scientist Josh Willis provides context for 2011′s small decline in sea level rise. Bottom line: Drop not long-lived, and further sea level rise inevitable. See the video.
“For the past 18 years, the U.S./French Jason-1, Jason-2 and Topex/Poseidon spacecraft have been monitoring the gradual rise of the world’s ocean in response to global warming,” NASA’s Jet Propulsion Laboratory said in a 2011 release.
“While the rise of the global ocean has been remarkably steady for most of this time, every once in a while, sea level rise hits a speed bump,” it continued. In 2011, “ it’s been more like a pothole” as global sea level fell by about a quarter of an inch, or half a centimeter between the summers of 2010 and 2011.”
“So what’s up with the down seas, and what does it mean?”
In the accompanying video by Peter Sinclair, independent videographer, NASA/JPL climate scientist Josh Willis points to the cycle of El Niño and La Niña in the Pacific.
Willis said that while 2010 had begun with a sizable El Niño, by year’s end it was replaced by one of the strongest La Niñas in recent memory. According to JPL, in Pasadena, Ca., that sudden shift in the Pacific changed rainfall patterns across the globe, bringing “massive floods to places like Australia and the Amazon basin, and drought to the southern United States.”
JPL pointed to data from the “Grace” spacecraft indicating that extra rain piled onto the continents in the early parts of 2011.
“By detecting where water is on the continents, Grace shows us how water moves around the planet,” Steve Nerem, a sea level scientist at the University of Colorado in Boulder, said in the JPL press statement.
The extra water flooding Brazil and Australia actually came from the ocean, JPL said.
“Each year, huge amounts of water are evaporated from the ocean. While most of it falls right back into the ocean as rain, some of it falls over land.
“The continents got an extra dose of rain, so much so that global sea levels actually fell over most of the last year,” Carmen Boening, a JPL oceanographer and climate scientist, said.
Willis put the kibosh on those thinking a long-term decline in global sea level is in the works. Sea level drops such as this one cannot last, and over the long-run, the trend remains solidly up, he said.
JPL’s quick take: “Water flows downhill, and the extra rain will eventually find its way back to the sea. When it does, global sea level will rise again.”
“We’re heating up the planet, and in the end that means more sea level rise,” Willis added. “But El Niño and La Niña always take us on a rainfall rollercoaster, and in years like this they give us sea-level whiplash.”
AUTHOR
Peter Sinclair is a veteran videographer who originated the “Climate Crock of the Week” series and now contributes regularly to The Yale Forum.

Monday, January 9, 2012

Must-see video on AGU sea level rise research, with Josh Willis and Jason Box: Climate Change and Sea Level Rise: “An Emerging Hockey Stick”

Climate Change and Sea Level Rise: “An Emerging Hockey Stick”

January 9, 2012


by Peter Sinclair, Climate Crock of the Week, January 9, 2012

Since we have such an active community of armchair oceanographers and spreadsheet Glaciologists here, I thought it would be useful to speak to the real thing, the people who actually spend time on the ocean, on the ice sheets, do the measurements, and come back to share that knowledge with us. I had just that opportunity at the American Geophysical conference in December.

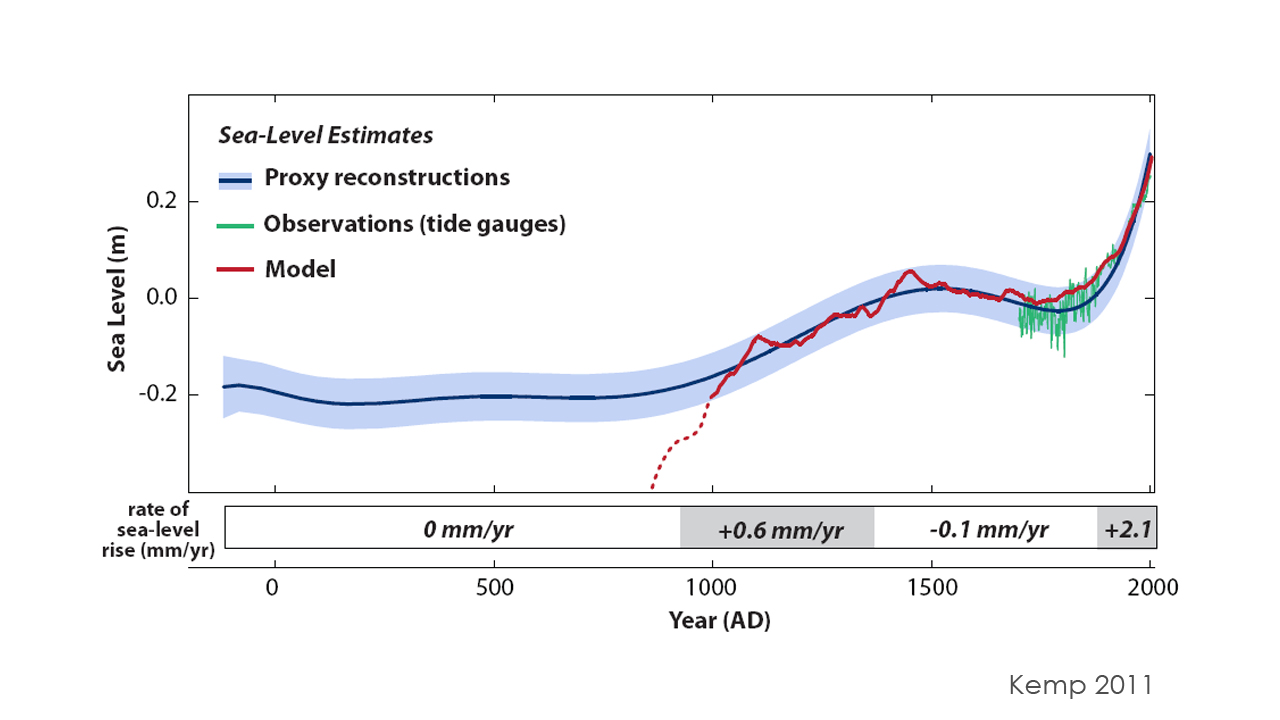
I spoke to Josh Willis, Oceanographer with NASA at the Jet Propulsion Lab – Josh is one of best known young ocean scientists on the planet. He pointed me to the recent Kemp et al study of tidal marshes on the US East coast, which has produced a long record  of sea level over the last 2,000 years, complete with a very Hockey-stickish uptick during the last 200 or so.

Jason Box of the Byrd Polar Center at Ohio State was there, presenting evidence of acceleration in Greenland ice loss over the last 200 years.

His bottom line – “If we talk 10 years from now, my expectation is that Greenland will be losing roughly double what it is now.”

I round out the video with takes from old pros lead NASA scientist Jim Hansen and Admiral David Titley, the US Navy’s Chief Oceanographer.
For more, see my previous Sea Level video:


Wednesday, August 24, 2011

NASA Satellites Detect Pothole on Road to Higher Sea Levels


NASA Satellites Detect Pothole on Road to Higher Seas

The red line in this image shows the long-term increase in global sea level

The red line in this image shows the long-term increase in global sea level since satellite altimeters began measuring it in the early 1990s. Since then, sea level has risen by a little more than an inch each decade, or about 3 mm per year. While most years have recorded a rise in global sea level, the recent drop of nearly a quarter of an inch, or half a centimeter, is attributable to the switch from El Niño to La Niña conditions in the Pacific. The insets show sea level changes in the Pacific Ocean caused by the recent El Niño and La Niña (see http://sealevel.jpl.nasa.gov/science/elninopdo for more information on these images). Image credit: S. Nerem, University of Colorado.  › Larger image
NASA's JPL, August 23, 2011
An Update from NASA's Sea Level Sentinels:

Like mercury in a thermometer, ocean waters expand as they warm. This, along with melting glaciers and ice sheets in Greenland and Antarctica, drives sea levels higher over the long term. For the past 18 years, the U.S./French Jason-1, Jason-2 and Topex/Poseidon spacecraft have been monitoring the gradual rise of the world's ocean in response to global warming.

While the rise of the global ocean has been remarkably steady for most of this time, every once in a while, sea level rise hits a speed bump. This past year, it's been more like a pothole: between last summer and this one, global sea level actually fell by about a quarter of an inch, or half a centimeter.

So what's up with the down seas, and what does it mean? Climate scientist Josh Willis of NASA's Jet Propulsion Laboratory, Pasadena, Calif., says you can blame it on the cycle of El Niño and La Niña in the Pacific.

Willis said that while 2010 began with a sizable El Niño, by year's end, it was replaced by one of the strongest La Niñas in recent memory. This sudden shift in the Pacific changed rainfall patterns all across the globe, bringing massive floods to places like Australia and the Amazon basin, and drought to the southern United States.

Data from the NASA/German Aerospace Center's twin Gravity Recovery and Climate Experiment (Grace) spacecraft provide a clear picture of how this extra rain piled onto the continents in the early parts of 2011. "By detecting where water is on the continents, Grace shows us how water moves around the planet," says Steve Nerem, a sea level scientist at the University of Colorado in Boulder.

So where does all that extra water in Brazil and Australia come from? You guessed it -- the ocean. Each year, huge amounts of water are evaporated from the ocean. While most of it falls right back into the ocean as rain, some of it falls over land. "This year, the continents got an extra dose of rain, so much so that global sea levels actually fell over most of the last year," says Carmen Boening, a JPL oceanographer and climate scientist. Boening and colleagues presented these results recently at the annual Grace Science Team Meeting in Austin, Texas.

But for those who might argue that these data show us entering a long-term period of decline in global sea level, Willis cautions that sea level drops such as this one cannot last, and over the long-run, the trend remains solidly up. Water flows downhill, and the extra rain will eventually find its way back to the sea. When it does, global sea level will rise again.

"We're heating up the planet, and in the end that means more sea level rise," says Willis. "But El Niño and La Niña always take us on a rainfall rollercoaster, and in years like this they give us sea-level whiplash."

For more information on NASA's sea level monitoring satellites, visit: