When we see records being broken and unprecedented events such as this, the onus is on those who deny any connection to climate change to prove their case. Global warming has fundamentally altered the background conditions that give rise to all weather. In the strictest sense, all weather is now connected to climate change. Kevin Trenberth
HIT THE PAGE DOWN KEY TO SEE THE POSTS
Now at 8,800+ articles. HIT THE PAGE DOWN KEY TO SEE THE POSTS
by Tim Radford, Climate News Network, February 13, 2015
LONDON − Scientists believe they may have cracked the mystery of the end of the last ice age. The temperatures suddenly soared, and the glaciers went into retreat, because the deep southern ocean released huge quantities of carbon dioxide.
And the convincing answers have been delivered by analysis of the composition of calcium carbonate shells of ancient marine organisms.
The link between human burning of fossil fuels and the steady rise in atmospheric carbon dioxide levels was proposed more than a century ago and firmly established in the last 30 years.
But the ups and downs of planetary temperatures before the emergence of human civilisation are harder to explain. Fossil evidence suggests a link with carbon dioxide levels, but not necessarily a cause.
Bygone climates
Now paleoceanographer Miguel Martínez-Botí, from the University of Southampton, UK, and ocean and climate change researcher Gianluca Marino, from the Australian National University, report in Nature that they found their evidence in sediment cores – in effect, annual records of bygone climates – rich in the shells of tiny foraminifera called Globigerina bulloides.
This is a species that flourishes in conditions of high nutrients, acting as a kind of biological pump, gulping carbon from the atmosphere.
They found that high concentrations of carbon dioxide dissolved in surface waters of the southern Atlantic Ocean and the eastern equatorial Pacific coincided with rises in atmospheric CO2 at the end of the last ice age.
The implication is that these regions were the source of the carbon dioxide to the atmosphere.
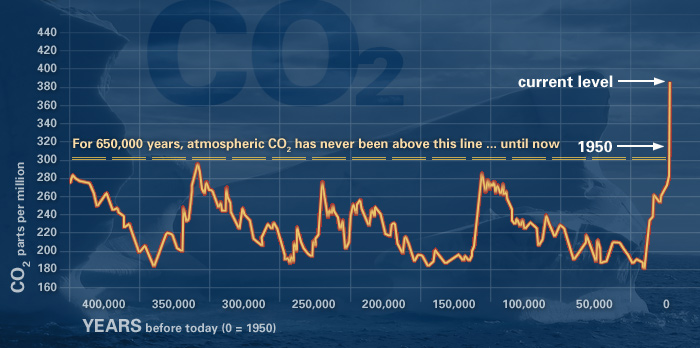
At their coldest, during the ice ages, carbon dioxide levels fell to 185 parts per million. During the interglacials, when the world warmed and lions and hyenas roamed the plains of Europe, the carbon dioxide levels rose to 280 ppm.
Right now, thanks to human activity, CO2 levels are rising ominously towards 400 ppm.
The oceans are home to about 60 times more carbon than the atmosphere and can, it seems, surrender it rapidly.
“The magnitude and rapidity of the swings in atmospheric CO2 across the ice age cycles suggest that changes in ocean carbon storage are important drivers of natural atmospheric CO2 variations,” Dr Martínez-Botí says.
“Our findings support the theory that a series of processes operating in the southernmost sector of the Atlantic, Pacific and Indian oceans, a region known as the Southern Ocean, changed the amount of carbon in the deep sea.
Into the abyss
“While a reduction in communication between the deep sea and the atmosphere in this region potentially locks carbon away from the atmosphere into the abyss during ice ages, the opposite occurs during warm interglacial periods.”
To arrive at their conclusion, the scientists had to analyse subtle evidence from the isotopic composition of the carbonate shells, and then use mathematical techniques to reconstruct a story of a great, faraway sigh of carbon dioxide from the ocean to the atmosphere.
The finding, based on calculated probabilities, is incomplete as there may have been other forces also at play.
Gavin Foster, associate professor in isotope geochemistry at the University of Southampton, says: “While our results support a primary role for the Southern Ocean processes in these natural cycles, we don’t yet know the full story. Other processes operating in other parts of the ocean, such as the north Pacific, may have an additional role to play.”
Supports continued operation of the iconic measurement series
by Robert Munroe, Scripps Institution of Oceanography, September 3, 2014
Scripps Institution of Oceanography at UC San Diego today announced that Wendy and Eric Schmidt have provided a grant that will support continued operation of the renowned Keeling Curve measurement of atmospheric carbon dioxide levels. The grant provides $500,000 over five years to support the operations of the Scripps CO2 Group, which maintains the Keeling Curve.
CO2 Group Director Ralph Keeling said the grant will make it possible for his team to restore atmospheric measurements that had been discontinued because of a lack of funding, address a three-year backlog of samples that have been collected but not analyzed, and enhance outreach efforts that educate the public about the role carbon dioxide plays in climate.
"I'm very grateful to be able to return to doing science and being attentive to these records. When it comes to tracking the rise in carbon dioxide, every year is a new milestone. We are still learning what the rise really means for humanity and the rest of the planet,” said Keeling.
Wendy Schmidt, co-founder with her husband of The Schmidt Family Foundation and The Schmidt Ocean Institute, said “The Scripps CO2 Project is critical to documenting the atmospheric changes on our planet and the Keeling Curve is an essential part of that tracking process. As government funding for science in general is decreasing, Eric and I are delighted to work with Scripps to help it continue its benchmark CO2 Project.”
The Schmidt Family Foundation advances the development of renewable energy and the wiser use of natural resources and houses its grant-making operation in The 11th Hour Project, which supports more than 150 nonprofit organizations in program areas including climate and energy, ecological agriculture, human rights, and our maritime connection.
In 2009, the Schmidts created the Schmidt Ocean Institute (SOI), and in 2012 launched the research vesselFalkor as a mobile platform to advance ocean exploration, discovery, and knowledge, and catalyze sharing of information about the oceans.
In keeping with the couple’s commitment to ocean health issues, Wendy Schmidt has partnered with XPRIZE to sponsor the $1.4 million Wendy Schmidt Oil Cleanup XCHALLENGE, awarded in 2011, and the Wendy Schmidt Ocean Health XPRIZE, a prize that will respond to the global need for better information about the process of ocean acidification. It will be awarded in 2015.
The Keeling Curve has made measurements of carbon dioxide in the atmosphere at a flagship station on Hawaii’s Mauna Loa since 1958. In addition, the Scripps CO2 Group measures carbon dioxide levels at several other locations around the world from Antarctica to Alaska. The measurement series established that global levels of CO2, a heat-trapping gas that raises atmospheric and ocean temperatures as it accumulates, have risen substantially in the past century. From a concentration that had never risen above 280 parts per million (ppm) before the Industrial Revolution, CO2 concentrations had risen to 315 ppm when the first Keeling Curve measurements were made. In 2013, concentrations at Mauna Loa rose above 400 ppm for the first time in human history and likely for the first time in 3-5 million years. Multiple lines of scientific research have attributed the rise to the use of fossil fuels in everyday activities.
The measurement series has become an icon of science with its steadily rising seasonal sawtooth representation of CO2 levels now a familiar image alongside Watson and Crick’s double helix representation of DNA and Charles Darwin’s finch sketches. Keeling Curve creator Charles David Keeling, Ralph Keeling’s father, received several honors for his work before his death in 2005, including the National Medal of Science from then-President George W. Bush.
The value of the Keeling Curve has increased over time, making possible discoveries about Earth processes that would have been extremely difficult to observe over short time periods or with only sporadic measurements. For instance, in 2013, researchers discovered that the annual range of CO2 levels is increasing. This finding may point to an increase in photosynthetic activity in response to a greater availability of a key nutrient for plant life.
Nuances in Keeling Curve measurements have similarly identified the global effects of events like volcanic eruptions, influences that would have been difficult to discern if measurements were made infrequently or periodically suspended. In addition, the Keeling Curve helps researchers understand the proportion of carbon dioxide being absorbed by the oceans, which in turn helps them estimate the pace of phenomena such as ocean acidification. In the past decade, scientists have come to widely study the ecological effects of acidification, which happens as carbon dioxide reacts chemically with seawater.
The Keeling Curve could eventually serve as a bellwether revealing the progress of efforts to diminish fossil fuel use. Save for seasonal variations, the measurement has not trended downward at any point in its history.
43rd International Arctic Workshop, Amherst, Mass., March 11-13, 2014 Julie Brigham-Grette1, MartinMelles2, PavelMinyuk3, and the El'gygytgyn Science Team4
1University of Massachusetts, Amherst 2University of Cologne 3NEISRI-RAS Magadan 4USA, Germany, Russia
The Pliocene-Pleistocene climate evolution of the Arctic must have modulated the glacial history of Greenland and the onset of Northern Hemisphere glaciation. What is known from the terrestrial stratigraphy of Arctic climate change comes from sites that are spatially and temporally fragmented. In 2009, International Continental Deep Drilling at Lake El’gygytgyn (67o 30' N, 172o 05' E) recovered lacustrine sediments dating back to 3.58 Ma that provide the first time-continuous Pliocene-Pleistocene Arctic paleoclimate record of alternating glacial-interglacial change. The warmest/wettest Pliocene interval of the lake record occurs from ~3.58-3.34 Ma and is dominated by exceptional tree pollen implying July temperatures nearly 7-8 oC warmer than today, with nearly ~3 times the annual precipitation. Atmospheric CO2 levels are estimated to have been 360-400 ppm implying exceptionally high climate sensitivity and polar amplification. In fact, pollen spectra and modern analog analysis show an unbroken persistence of summers much warmer and wetter than the last interglacial, MIS 5e until nearly 2.2 Ma. Extreme warmth in the Mid Pliocene Arctic occurs at the same time ANDRILL results suggest the West Antarctic Ice Sheet was non-existent.
Using physical, chemical, and biological proxies we find pronounced glacial episodes commenced ~2.6 Ma ago, but the full range of typical Pleistocene glacial/interglacial change was not established until ~1.8 Ma ago. Greenland must have also responded to numerous “super interglacials” during the Quaternary record, with maximum summer temperatures and annual precipitation, especially during MIS 9, 11 and 31, at Lake El’gygytgyn exceeding that documented for MIS 5e. The correspondence of many of these super-interglacials with retreat of the West Antarctic Ice Sheet (Naish et al. 2009) could coincide with intervals when the Greenland Ice was reduced in size. The climate record from Lake El’gygytgyn, especially the history of past interglacials, provides a fresh means of testing the evolving magnitude of polar amplification over time, and the sensitivity of the Greenland Ice Sheet to extreme warmth in the rest of the Arctic.
Brigham-Grette, J., Melles, M., Minyuk, P., Andreev, A., Tarasov, P., DeConto, R., Koenig, S., Nowaczyk, N., Wennrich, V., Rosén, P., Haltia-Hovi, E., Cook, T., Gebhardt, T., Meyer-Jacob, C., Snyder, J., Herzschuh, U. Pliocene warmth, extreme polar amplification, and stepped Pleistocene cooling recorded in NE Russia. Submitted to Science, 21 November 2012; in revision March 2013.
Melles, M., Brigham-Grette, J., Minyuk, P., and others. 2012. 2.8 Million Years of Arctic Climate Change from Lake El’gygytgyn, NE Russia. Science, 337, 315-320.
Naish, T. et al., 2009. Obliquity-paced Pliocene West Antarctic ice sheet oscillations. Nature, 458, 322-328.
See also Climate of the Past, special issue on Lake El’gygytgyn, 20+ manuscripts.
Morgan Schaller, James Wright, and the core sample that helped them understand what happened -- and how fast it happened -- 55 million years ago. Credit: James Wright, Rutgers University "Rapid" and "instantaneous" are words geologists don't use very often. But Rutgers geologists use these exact terms to describe a climate shift that occurred 55 million years ago.
In a new paper in the Proceedings of the National Academy of Sciences, Morgan Schaller and James Wright contend that following a doubling in carbon dioxide levels, the surface of the ocean turned acidic over a period of weeks or months and global temperatures rose by 5 degrees centigrade – all in the space of about 13 years.
Scientists previously thought this process had occurred over 10,000 years.
Wright, a professor of earth and planetary sciences in the School of Arts and Sciences and Schaller, a research associate, say the finding is significant in considering modern-day climate change.
"We've shown unequivocally what happens when CO2 increases dramatically – as it is now, and as it did 55 million years ago," Wright said. "The oceans become acidic and the world warms up dramatically. Our current carbon release has been going on for about 150 years, and because the rate is relatively slow, about half the CO2 has been absorbed by the oceans and forests, causing some popular confusion about the warming effects of CO2. But 55 million years ago, a much larger amount of carbon was all released nearly instantaneously, so the effects are much clearer."
The window to this important decade in the very distant past opened when Wright helped a colleague, Kenneth Miller, and his graduate students split core samples they extracted from a part of southern New Jersey once covered by the ocean.
The patterns found in the long cylinder of sediment told a story. There were distinct clay bands about 2 centimeters thick occurring rhythmically throughout the cores.
A close-up of the core at the heart of Wright's and Schaller's work. Note the regluar dark bands -- "like a tree ring," Schaller said. Credit: James Wright, Rutgers University
"They called me over and said, 'Look at this!" said Schaller. "What jumped out at me were these rhythmic clay layers, very cyclic. I thought, 'Wow, these have got to mean something."
Wright and Schaller surmised that only climate could account for the rhythmic pattern they saw. "When we see cycles in cores, we see a process," Schaller said. "In this case, it's like a tree ring. It's giving us a yearly account through the sediments."
This discovery provided the necessary data to finally solve the huge conundrum surrounding this event – the significant error in how fast the carbon was released.
Whatever the cause of the carbon release,—some scientists theorize that a comet struck the earth—Wright and Schaller's contention that it happened so rapidly is radically different from conventional thinking, and bound to be a source of controversy, Schaller believes.
"Scientists have been using this event from 55 million years ago to build models about what's going on now," Schaller said. "But they've been assuming it took something like 10,000 years to release that carbon, which we've shown is not the case. We now have a very precise record through the carbon release that can be used to fix those models."
Proceedings of the National Academy of Sciences, 110(40) (October 2013) 15908-15913; doi: 10.1073/pnas.1309188110
Evidence for a rapid release of carbon at the Paleocene-Eocene thermal maximum
James D. Wright and Morgan F. Schaller Abstract
The Paleocene/Eocene thermal maximum (PETM) and associated carbon isotope excursion (CIE) are often touted as the best geologic
analog for the current anthropogenic rise in pCO2.
However, a causal mechanism for the PETM CIE remains unidentified
because of large uncertainties in the duration of the CIE’s
onset. Here, we report on a sequence of
rhythmic sedimentary couplets comprising the Paleocene/Eocene Marlboro
Clay (Salisbury
Embayment). These couplets have
corresponding δ18O cycles that imply a climatic origin. Seasonal insolation is the only regular climate cycle that can plausibly account for
δ18O amplitudes and layer counts. High-resolution stable isotope records show 3.5‰ δ13C decrease over 13 couplets defining the CIE onset, which requires a large, instantaneous release of 13C-depleted carbon. During the CIE, a clear δ13C gradient developed on the shelf with the largest excursions in shallowest waters, indicating atmospheric δ13C decreased by ∼20‰. Our observations and revised release rate are consistent with an atmospheric perturbation of 3,000-gigatons
of carbon (GtC).
Here is a must-see 2012 presentation by Julie
Brigham-Grette of the University of Massachusetts-Amherst, covering the
research her team has been doing into Lake El’gygytgyn
(pronouned El-Guh-Git-Kin), a water-filled meteor crater in Arctic
Russia that came into being after the impact of a ~1-km-diameter
space rock, 3.6 million years ago.
This is incredibly important work because:
The Lake El’gygytgyn region was not glaciated during any of the ice
ages. As a consequence, the more than 300-meter accumulated sequence of lake
sediments represents a continuous, undisturbed sedimentary record going
all the way back from the present to the aftermath of the impact.
The team succeeded in 2009 in extracting cores spanning this entire 3.6 million year period.
The oldest continuous ice core records to date extend back 123,000 years
in Greenland and 800,000 years in Antarctica: the Lake El’gygytgyn cores
go way back beyond those times and provide an unprecedented view of the
past climate of the Arctic.
Results show that during the Pleistocene (2.588 million to 11.7
thousand years ago), there were a number of super-interglacials – like
the present period but much wetter and several degrees warmer in the
Arctic, during which the Greenland and West Antarctic ice-sheets didn’t
just melt a bit. They disappeared.
Skeptical Science recently covered the new 2013 paper by the same
team, describing the Arctic climate in the Lake
El’gygytgyn region during the Pliocene, when boreal forests extended
well up into the Arctic and summer temperatures were 8 oC warmer than they are at present:
The data coming from Lake El’gygytgyn strongly suggest that the
Arctic climate is highly sensitive to small changes in forcing, warming
much faster than the rest of the world in the phenomenon known as Arctic
Amplification. In recent years, Arctic Amplification has emerged as a
strong modern-day climate signal. To cite but one example, the sea-ice
response has been of far greater magnitude than model-based forecasts
projected. Now, the past is giving a similar narrative, and
understanding the climate of the past gives us our best chance of
understanding the climate of the future.
Money quotes at 17:00: “..Greenland Ice sheet has come and gone much more frequently than
any of us had imagined.” 19:48: “..extreme warmth many times throughout the last few million years” and “..It may be much easier to get rid of sea ice than we thought before.”
It’s long been known that massive increases in emission of CO2 from volcanoes, associated with the opening of the Atlantic Ocean in the end-Triassic Period, set off a shift in state of the climate which caused global mass extinction of species, eliminating about 34% of genera. The extinction created ecological niches which allowed the rise of dinosaurs during the Triassic, about 250–200 million years ago. New research released this morning in Science Express has refined the dating of this wave of volcanism. It shows marine and land species disappear from the fossil record within 20,000 to 30,000 years from the time evidence for the eruption of large magma flows appears, approximately 201 million years ago. These volcanic eruptions increased atmospheric CO2 and increased ocean acidity. Mass extinctions due to rapidly escalating levels of CO2 are recorded since as long as 580 million years ago. As our anthropogenic global emissions of CO2 are rising, at a rate for which no precedence is known from the geological record with the exception of asteroid impacts, another wave of extinctions is unfolding. Mass extinctions of species in the history of Earth include:
the ~580 million years-old (Ma) Acraman impact (South Australia) and Acrytarch (ancient palynomorphs) extinction and radiation
Late Devonian (~374 Ma) volcanism, peak global temperatures and mass extinctions
the end-Devonian impact cluster associated with mass extinction, which among others destroyed the Kimberley Fitzroy reefs (~360 Ma)
the upper Permian (~267 Ma) extinction associated with a warming trend
the Permian-Triassic boundary volcanic and asteroid impact events (~ 251 Ma) and peak warming
the End-Triassic (201 Ma) opening of the Atlantic Ocean, and massive volcanism
an End-Jurassic (~145 Ma) impact cluster and opening of the Indian Ocean
the pre-Eocene–Oligocene boundary (~34 Ma) impact cluster and a cooling trend, followed by opening of the Drake Passage between Antarctica and South America, formation of the Antarctic ice sheet and minor extinction at ~34 Ma.
Throughout the Phanerozoic (from 542 million years ago), major mass extinctions of species closely coincided with abrupt rises of atmospheric carbon dioxide and ocean acidity. These increases took place at rates to which many species could not adapt. These events – triggered by asteroid impacts, massive volcanic activity, eruption of methane, ocean anoxia and extreme rates of glaciation (see Figures 1 and 2) – have direct implications for the effects of the current rise of CO2.
Click on graphs to enlarge.
Figure 1. Trends in atmospheric CO2 and related glacial and interglacial periods since the Cambrian (542 million years ago), showing peaks in CO2 levels (green diamonds) associated with asteroid impacts and/or massive volcanism. CO2 data from Royer (2004 and 2006).
Figure 2. Relations between CO2 rise rates and mean global temperature rise rates during warming periods, including the Paleocene–Eocene Thermal Maximum, early Oligocene, mid-Miocene, late Pliocene, Eemian (glacial termination), Dansgaard–Oeschger cycles, Medieval Warming Period, 1750–2012 and 1975–2012 periods. In February 2013, CO2 levels had risen to near 396.80 ppm at Mauna Loa Atmospheric Observatory, compared to 393.54 ppm in February 2012. This rise (3.26 ppm per year) is at the highest rate yet recorded. Further measurements show CO2 is at near 400 ppm of the atmosphere over the Arctic. At this rate the upper stability threshold of the Antarctic ice sheet, defined at about 500–600 ppm CO2 would be reached later this century (although hysteresis of the ice sheets may slow down melting). Our global carbon reserves (including coal, oil, oil shale, tar sands, gas and coal-seam gas) contain considerably more than 10,000 billion tonnes of carbon (see Figure 5). This amount of carbon, if released into the atmosphere, is capable of raising atmospheric CO2 levels to higher than 1,000 ppm. Such a rise in atmospheric radiative forcing will be similar to that of the Paleocene–Eocene boundary thermal maximum (PETM), which happened about 55 million years ago (see Figures 1, 2 and 4). But the rate of rise surpasses those of this thermal maximum by about ten times.
Figure 3. Plot of percent mass extinction of genera versus peak atmospheric CO2 levels at several stages of Earth history.
Figure 4. The Paleocene–Eocene Thermal Maximum (PETM) represented by sediments in the Southern Ocean, central Pacific and South Atlantic oceans. The data indicate: (a) deposition of an organic matter-rich layer consequent on extinction of marine organisms, (b) lowering of δ18O values representing an increase in temperature, and (c) a sharp decline in carbonate contents of sediments representing a decrease in pH and increase in acidity (Zachos et al. 2008). The Paleocene–Eocene boundary thermal maximum event about 55 million years ago saw the release of approximately 2,000–3,000 billion tons of carbon to the atmosphere in the form of methane (CH4). It led to the extinction of about 35–50% of benthic foraminifera (see Figures 3 and 4), representing a major decline in the state of the marine ecosystem. The temperature rise and ocean acidity during this event are shown in Figures 4 and 6. Based on the amount of carbon already emitted and which could continue to be released to the atmosphere (see Figure 5), current climate trends could be tracking toward conditions like those of the Paleocene–Eocene event. Many species may be unable to adapt to the extreme rate of current rise in greenhouse gases and temperatures. The rapid opening of the Arctic Sea ice, melting of Greenland and west Antarctic ice sheets, and rising spate of floods, heat waves, fires and other extreme weather events may signify a shift in the state of the climate, crossing tipping points.
Figure 5. CO2 emissions from fossil fuels (2.12 GtC ~ 1 ppm CO2). Estimated reserves and potentially recoverable resources. By analogy to medical science analysing blood count as diagnosis for cancer, climate science uses the greenhouse gas levels of the atmosphere, pH levels of the ocean, variations in solar insolation, aerosol concentrations, clouding states at different levels of the atmosphere, state of the continental ice sheets and sea ice, position of high pressure ridges and climate zones and many other parameters to determine trends in the climate. The results of these tests, conducted by thousands of peer-reviewed scientists world-wide, have to date been ignored, at the greatest peril to humanity and nature. Continuing emissions contravene international laws regarding crimes against humanity and related International and Australian covenants. In the absence of an effective global mitigation effort, governments world-wide are now presiding over the demise of future generations and of nature, tracking toward one of the greatest mass extinction events nature has seen. It is time we learned from the history of planet Earth.
Figure 6. The Paleocene–Eocene boundary thermal maximum. http://www.uta.edu/faculty/awinguth/petm_research/petm_home.html Andrew Glikson does not work for, consult to, own shares in or receive funding from any company or organisation that would benefit from this article, and has no relevant affiliations. This article was originally published at The Conversation.
Read the original article.
The covariation of carbon dioxide (CO2) concentration and temperature in Antarctic ice-core records suggests a close link between CO2 and climate during the Pleistocene ice ages. The role and relative importance of CO2 in producing these climate changes remains unclear, however, in part because the ice-core deuterium record reflects local rather than global temperature. Here we construct a record of global surface temperature from 80 proxy records and show that temperature is correlated with and generally lags CO2 during the last (that is, the most recent) deglaciation. Differences between the respective temperature changes of the Northern Hemisphere and Southern Hemisphere parallel variations in the strength of the Atlantic meridional overturning circulation recorded in marine sediments. These observations, together with transient global climate model simulations, support the conclusion that an antiphased hemispheric temperature response to ocean circulation changes superimposed on globally in-phase warming driven by increasing CO2 concentrations is an explanation for much of the temperature change at the end of the most recent ice age.
Between about 55.5 and 52 million years ago, Earth experienced a series of sudden and extreme global warming events (hyperthermals) superimposed on a long-term warming trend1. The first and largest of these events, the Palaeocene–Eocene Thermal Maximum (PETM), is characterized by a massive input of carbon, ocean acidification2 and an increase in global temperature of about 5°C within a few thousand years3. Although various explanations for the PETM have been proposed4, 5, 6, a satisfactory model that accounts for the source, magnitude and timing of carbon release at the PETM and successive hyperthermals remains elusive. Here we use a new astronomically calibrated cyclostratigraphic record from central Italy7 to show that the Early Eocene hyperthermals occurred during orbits with a combination of high eccentricity and high obliquity. Corresponding climate–ecosystem–soil simulations accounting for rising concentrations of background greenhouse gases8 and orbital forcing show that the magnitude and timing of the PETM and subsequent hyperthermals can be explained by the orbitally triggered decomposition of soil organic carbon in circum-Arctic and Antarctic terrestrial permafrost. This massive carbon reservoir had the potential to repeatedly release thousands of petagrams (1015 grams) of carbon to the atmosphere–ocean system, once a long-term warming threshold had been reached just before the PETM. Replenishment of permafrost soil carbon stocks following peak warming probably contributed to the rapid recovery from each event9, while providing a sensitive carbon reservoir for the next hyperthermal10. As background temperatures continued to rise following the PETM, the areal extent of permafrost steadily declined, resulting in an incrementally smaller available carbon pool and smaller hyperthermals at each successive orbital forcing maximum. A mechanism linking Earth’s orbital properties with release of soil carbon from permafrost provides a unifying model accounting for the salient features of the hyperthermals.
If you pull the carbon trigger and dump it into the atmosphere, warming happens. Several gigatons have been dumped into the atmosphere, and all the geological evidence says that if we keep on doing what we are doing very bad things are going to happen. He presents an independent line of evidence, separate from that from the atmospheric physicists, showing that putting this amount of CO2 into the atmosphere will cause catastrophe. He says the rock record tells us we have a problem, not models.
Neotropical biomass burning reconstructions synthesized from soil and sedimentary charcoal records indicate a period of reduced biomass burning sustained for several centuries after ∼500 cal. yr BP. Proxy records of solar irradiance, El Niño events, temperature, and precipitation document regionally variable climate-related trends that do not account for the uniform reduction in burning across the Neotropics. Decreased human ignition resulting from pandemic-induced mortality offers an alternative, geographically comprehensive explanation. In addition, natural (solar-volcanic) factors can explain only ∼1.3 ppm out of the rapid 6–10 ppm CO2 decrease between ad 1525 and the early 1600s. Reforestation following land abandonment due to population collapse has the potential to account for the rest of this CO2 decline, and variations in the 13C/12C of atmospheric CO2 and CH4 are consistent with both a major reduction in Neotropical landscape management by fire and massive reforestation. Our findings are demonstrative of the scale at which pre-industrial human activities influenced Earth’s atmospheric greenhouse gas budget.
This graph, based on the comparison of atmospheric samples contained in ice cores and more recent direct measurements, provides evidence that atmospheric CO2 has increased since the Industrial Revolution. Source: NOAA


 Explore further: Late Cretaceous Period was likely ice-free



 Posts
Posts






