Arctic sea ice reflects sunlight, keeping the polar regions cool and moderating global climate. According to scientific measurements, Arctic sea ice has declined dramatically over at least the past thirty years, with the most extreme decline seen in the summer melt season.
Read timely scientific analysis year-round below. We provide an update during the first week of each month, or more frequently as conditions warrant.
Please credit the National Snow and Ice Data Center for image or content use unless otherwise noted beneath each image.
August 11, 2008
Sea ice decline accelerates, Amundsen's Northwest Passage opens
Sign up for the Arctic Sea Ice News RSS feed for automatic notification of analysis updates.
The pace of sea ice loss sharply quickened in the past ten days, triggered by a series of strong storms that broke up thin ice in the Beaufort and Chukchi Seas. Amundsen's historic Northwest Passage is opening up; the wider and deeper route through Parry Channel is currently still clogged with ice.
Note: Analysis updates, unless otherwise noted, now show a single-day extent value for Figure 1, as opposed to the standard monthly average. While monthly average extent images are more accurate in understanding long-term changes, the daily images are helpful in monitoring sea ice conditions in near-real time.
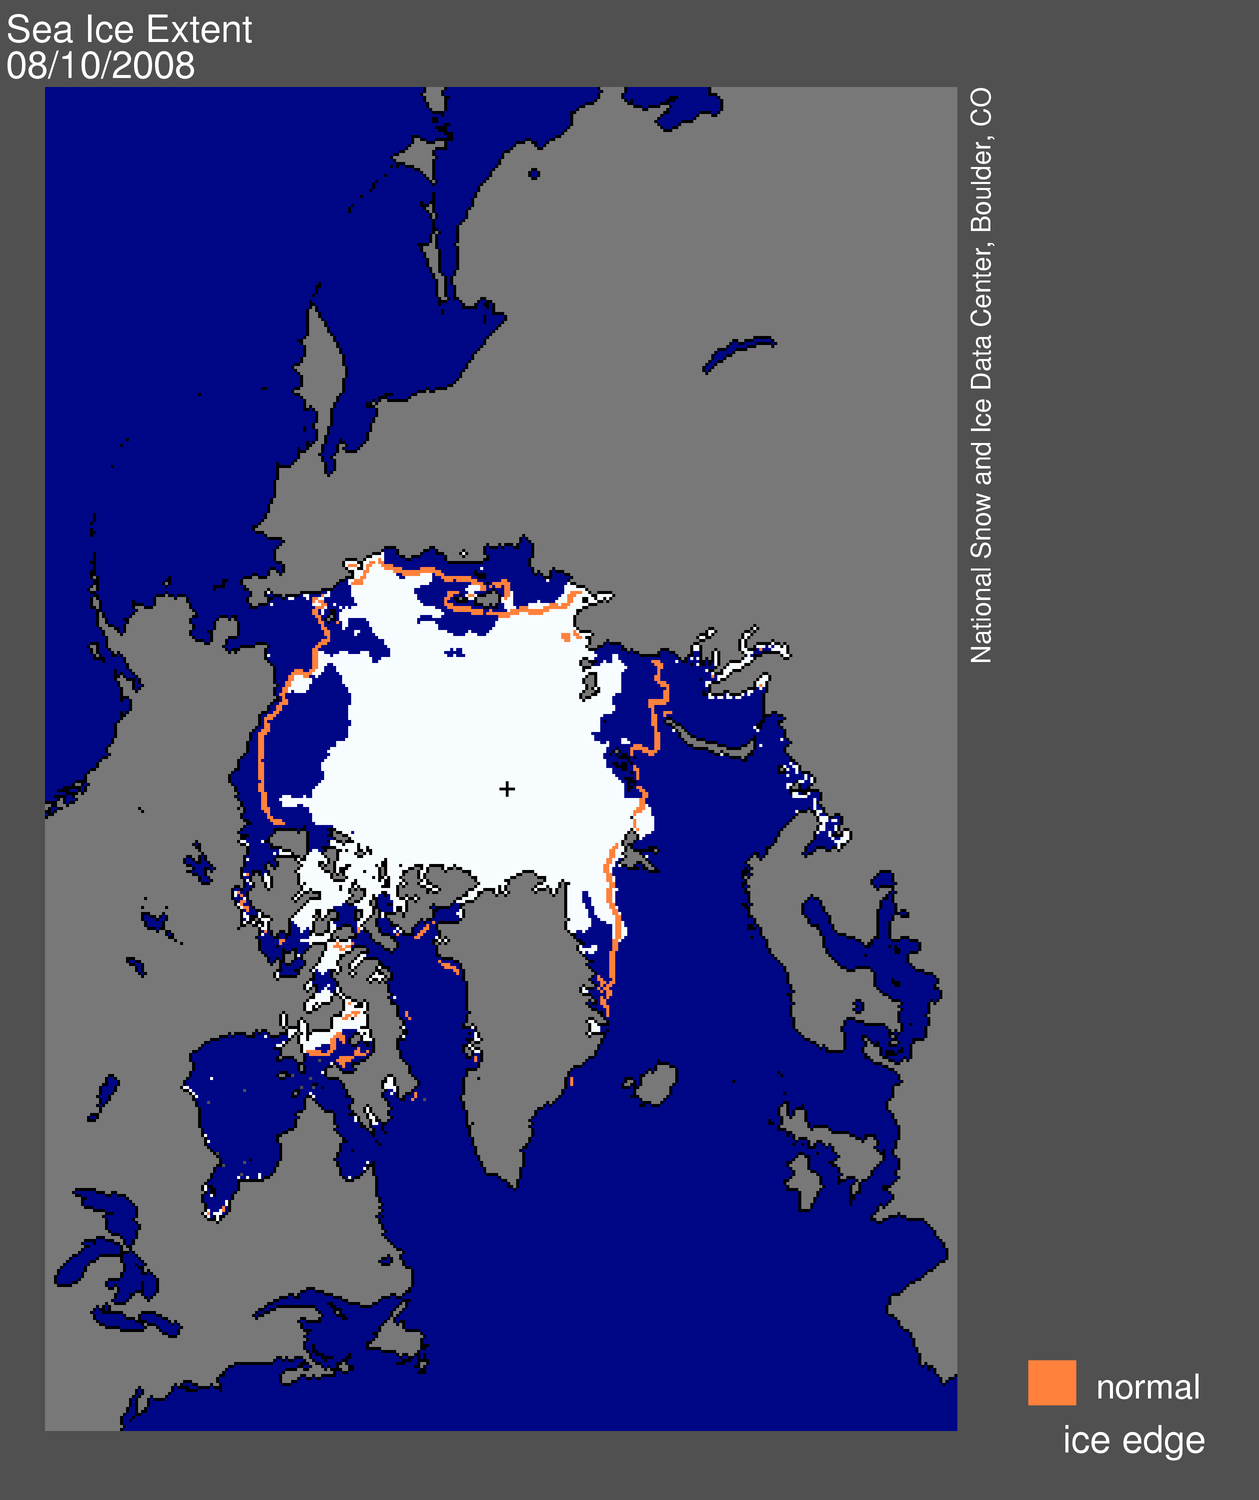
Figure 1. Daily Arctic sea ice extent for August 10, 2008, was 6.54 million square kilometers (2.52 million square miles). The orange line shows the 1979 to 2000 average extent for that day. The black cross indicates the geographic North Pole. Sea Ice Index data. About the data.
Overview of conditions
Arctic sea ice extent on August 10 was 6.54 million square kilometers (2.52 million square miles), a decline of 1 million square kilometers (390,000 square miles) since the beginning of the month. Extent is now within 780,000 square kilometers (300,000 square miles) of last year's value on the same date and is 1.50 million square kilometers (580,000 square miles) below the 1979 to 2000 average.
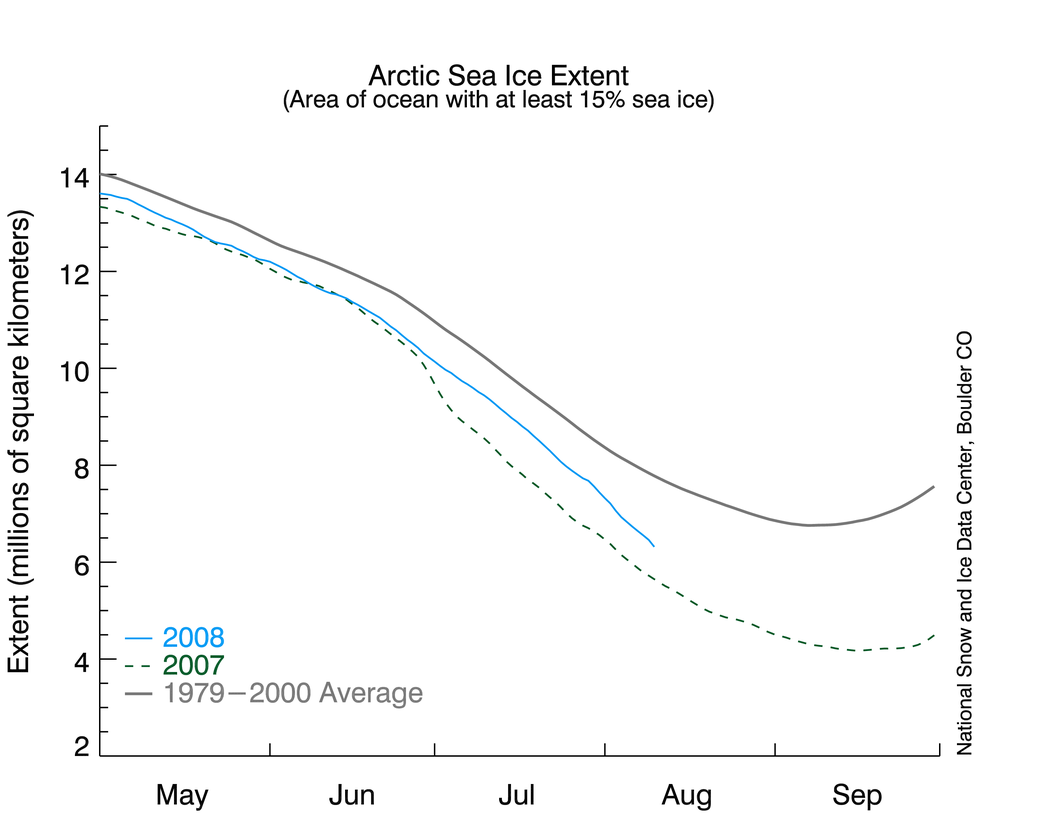
Figure 2. Daily sea ice extent; the blue line indicates 2008; the gray line indicates extent from 1979 to 2000; the dotted green line shows extent for 2007. Sea Ice Index data.
—Credit: National Snow and Ice Data Center
High-resolution Image
Conditions in context
Ice extent has begun to decline sharply. The decline rate surged to -113,000 square kilometers per day on August 7 and as of August 10 was -103,000 square kilometers per day. This compares to the long-term average decline of -76,000 square kilometers per day for this time of year. Normally, the peak decline rate is in early July.
Many of the areas now seeing a rapid retreat saw an early melt onset (see July 2, 2008); this helped set the stage for rapid retreat (July 17 and April 7). However, the more fundamental issue is that these regions started the melt season covered with thin first-year ice, which is especially vulnerable to melting out completely. Thin ice is also vulnerable to breakup by winds; the last ten days have seen a windy, stormy pattern that has accelerated the ice loss.
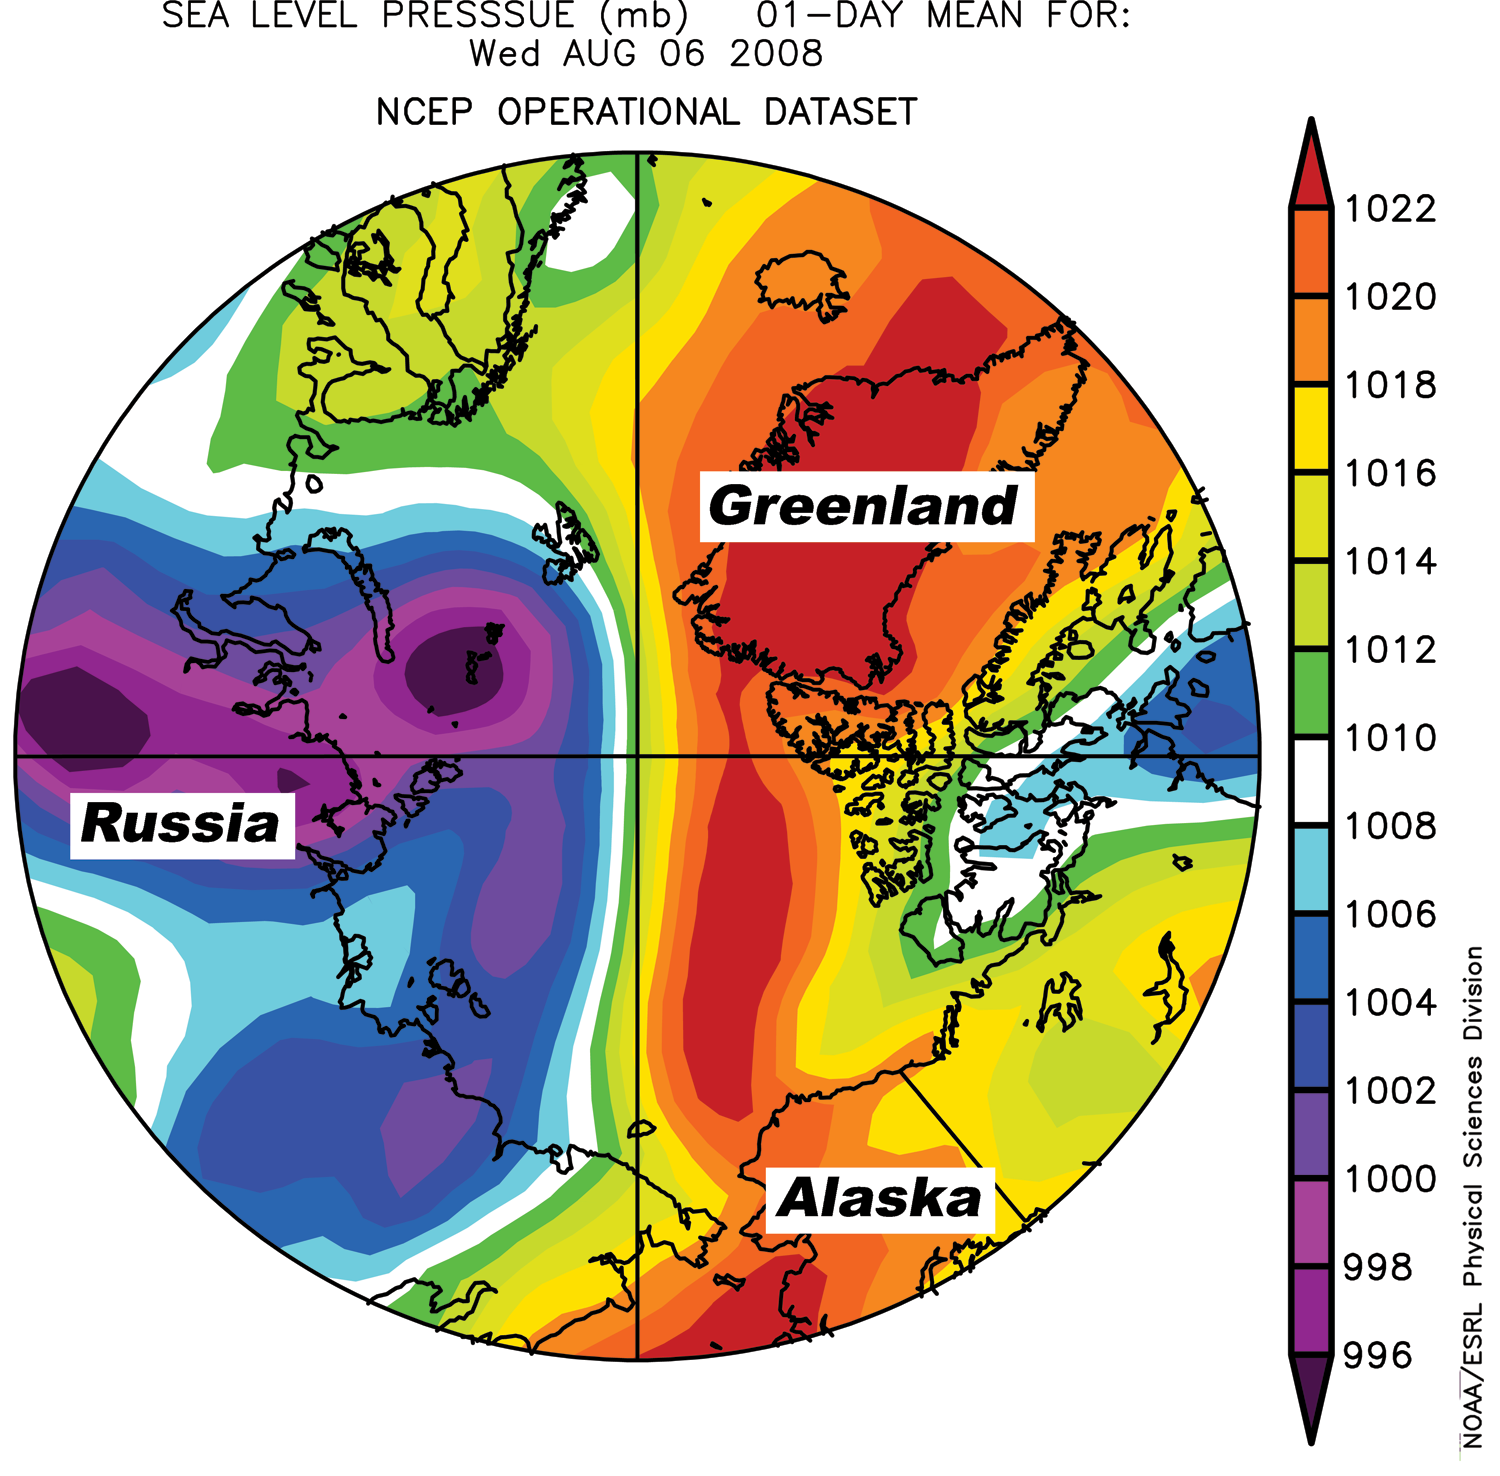 Figure 3. Sea-level pressure for August 8, 2008, shows a weather pattern favoring ice melt. Areas of high pressure are shown in yellow and red; areas of low pressure are shown in blue and purple.
 —Credit: From National Snow and Ice Data Center courtesy Climate Diagnostic Center
High-resolution image
Storms trigger increased melt
A series of storms north of Alaska and Siberia in late July and early August have helped break up the thin ice and have brought warm southerly winds into the region.
Subsequently, a pattern has developed with high pressure over the Beaufort Sea and low pressure over the Laptev and East Siberian Seas (Figure 3). In accord with Buys Ballot's Law, this pattern has brought southerly winds to the region, enhancing melt, breaking up ice, and pushing the ice edge northward.
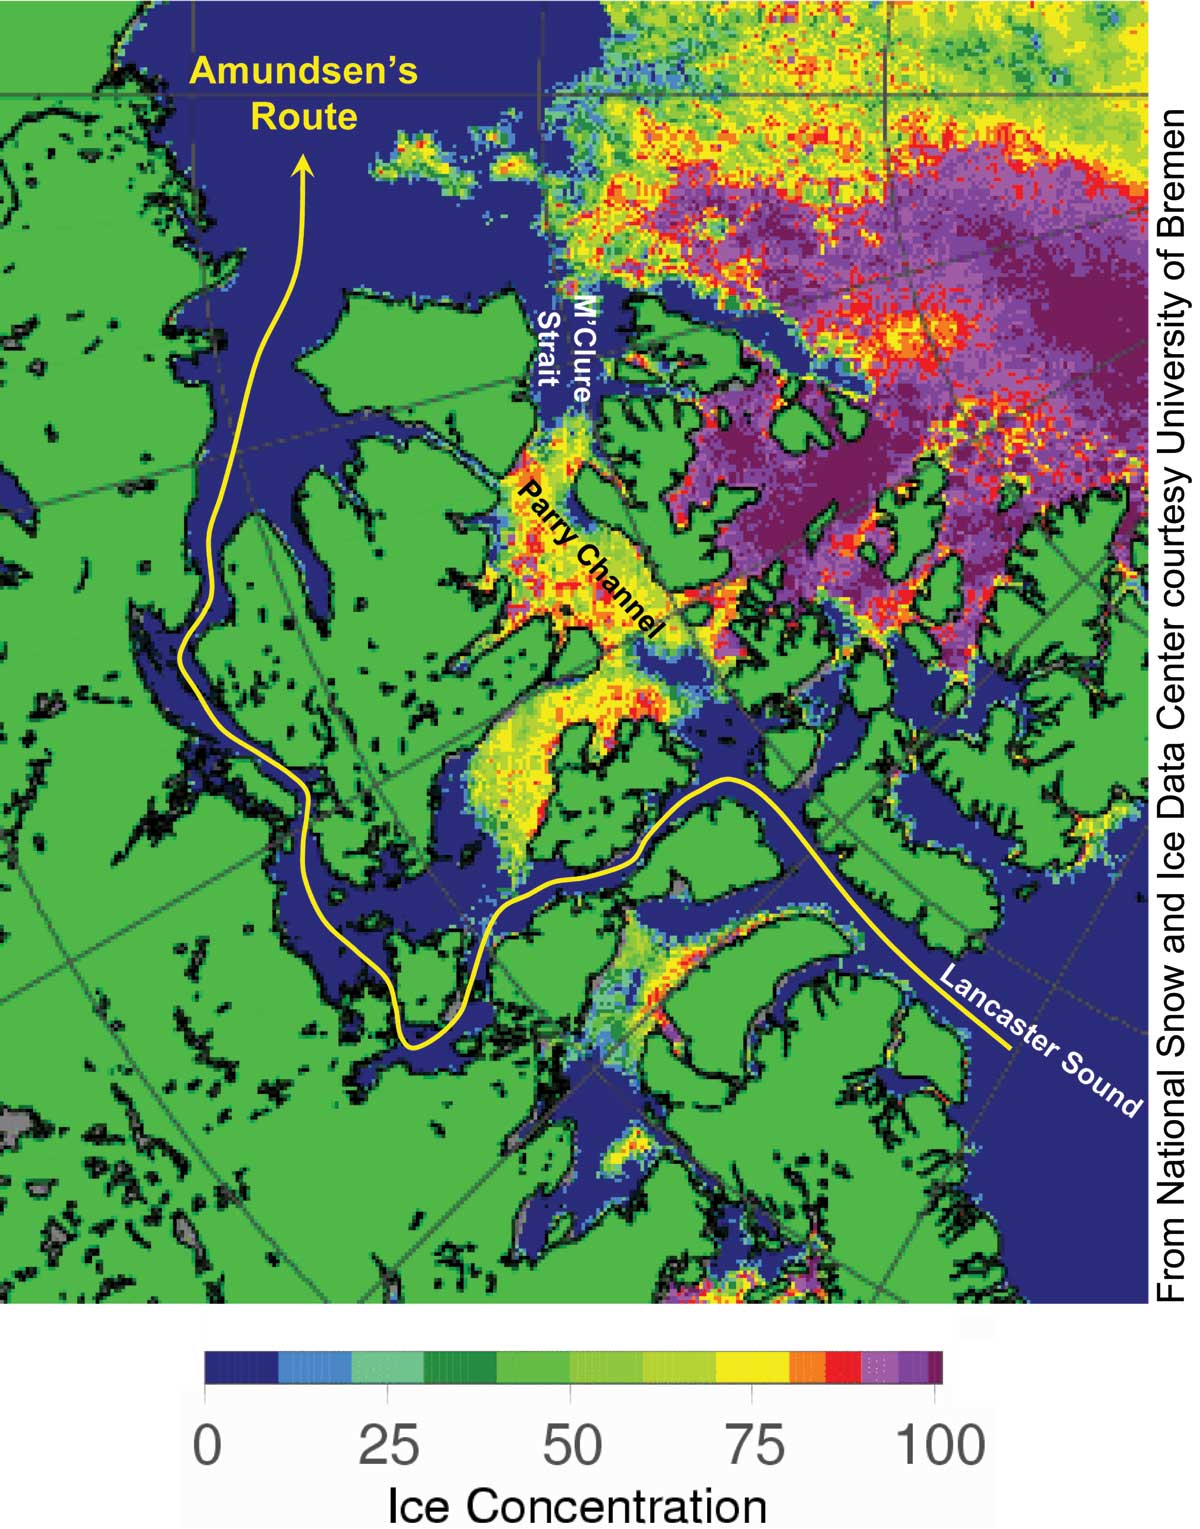
Figure 4. Passive-microwave satellite data shows ice concentration on August 10, 2008, over the Northwest Passage region. The yellow line indicates Amundsen's historic route through the passage. NASA AMSR-E data.
Opening of Amundsen's Northwest Passage
The Northwest Passage that Roald Amundsen navigated with great difficulty starting in 1903 is opening for the second year in a row, as shown in the AMSR-E sea ice product from the University of Bremen (Figure 4).
The most recent operational analysis from the Canadian Ice Service and the U.S. National Ice Center on August 8 showed a small section of Amundsen’s historic path still blocked by a 50-kilometer (31-mile) stretch of sea ice, although that should melt within the next few days.
Amundsen’s route requires sailing through treacherous narrow and shallow channels, making it impractical for deep-draft commercial ships. The more important northern route, through the wide and deep Parry Channel, is still ice-clogged. The northern route opened in mid-August last year; it may still open up before the end of this year's melt season.
For previous analysis, please see the drop-down menu under Archives in the right navigation at the top of this page.
![]() NSIDC scientists provide Arctic Sea Ice News & Analysis, with partial support from NASA.
NSIDC scientists provide Arctic Sea Ice News & Analysis, with partial support from NASA.


No comments:
Post a Comment