Our new paper illustrates the rapid, consistent warming of Earth’s oceans

by John Abraham, "Climate Consensus – The 97%," The Guardian, September 20, 2017
We’ve known for decades that the Earth is warming, but a key question is, how fast? Another key question is whether the warming is primarily caused by human activities. If we can more precisely measure the rate of warming and the natural component, it would be useful for decision makers, legislators, and others to help us adapt and cope. Indeed, added ocean heat content underlies the potential for dangerous intense hurricanes.
An answer to the “how fast?” question was partly answered in an Opinion piece just published on Eos.org, the daily online Earth and space science news site, by scientists from China, Europe, and the United States. I was fortunate enough to be part of the research team.

To measure how fast the globe is warming, we focused on the extra heat that is being trapped in the climate. The key to measuring the extra heat is by comparing the incoming and outgoing energy – just like you watch your bank account, keeping track of income and expenses to tell whether your bank balance will increase or not.
Okay so how do we measure these incoming and outgoing flows? In our view, the best way is in the oceans. We know that the oceans absorb almost all of the excess heat – so, perhaps we can detect energy increases in ocean waters.
Measuring the oceans is challenging. They are vast and they are deep – measurements can be noisy. Detecting a long-term trend (a signal) within the noise can be a challenge. But this challenge is exactly what we focused on. We wanted to know how large the signal-to-noise ratio is for ocean heat measurements, because this would tell us how many years of data are needed to detect warming. Can we detect global warming with one year of measurements? With a decade? Or do we need multiple decades of measurements to be sure the climate is changing?
Our work shows that scientists need less than 4 years of ocean heat measurements to detect a warming signal. This is much shorter than the nearly three decades of measurements that would be required to detect global warming if we were to use temperatures of air near the Earth’s surface. It is also slightly better than the nearly 5 years of sea level rise data that are needed for detecting a long-term trend. This means that the warming is not natural but rather stems from the human-induced climate change, primarily from increases in heat-trapping gases in the atmosphere.
This finding should help change the way we talk about global warming. Normally, scientists and the public wait for the official annual “global temperatures” to be released (every January or February) by major research groups like NASA, NOAA, and the Hadley Centre in the UK. Avid consumers of global warming news often use these air temperatures to “prove” or “disprove” global warming. If it was hot last year, “It's global warming!” If last year was cool, “Global warming is over!”
But the year-to-year fluctuations of air temperatures are predominantly associated with El Niño and weather variability and mislead those who use any one year as climate-change proof. We saw the impact of fluctuations over the past two decades, when a slowing of the rise of global surface temperatures led to false claims that global warming had “stopped” or that there was a “hiatus.” No such cessation occurred for ocean heat content.
Hence, global ocean heat content data isn’t so noisy. It represents the total thermal energy in the ocean waters and is now known with a high degree of certainty (see the figure below), in part because scientists have improved ocean temperature sensing methods and increased the number of sensors throughout the ocean waters.
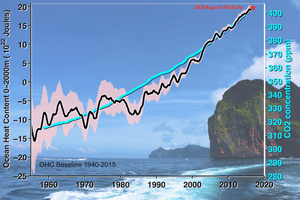
According to our analysis, the top 10 warmest years of ocean heat content are all in the most recent decade (following 2006), with the last two years being the hottest. The heat storage in the ocean corresponds to 3 × 10²³ Joules (a 3 with twenty-three zeroes after it) since 1960. Prior to the 1980s, values are not as well known, and the global record is unreliable prior to about 1960.
In the most recent 25 years, the Earth has gained approximately 0.7 Watts for every square meter of surface area. That may not sound like much, but think about how many square meters are required to cover the surface of the Earth. To put these numbers in perspective, the heat increase in the oceans since 1992 is about 2,000 times the total net generation of electricity in the USA in the past decade.
We believe, and argue, that ocean heat content is the key to quantifying how fast the climate is changing, and it has important implications for regional patterns of climate. According to Trenberth:
A key reason for the exceptionally active Atlantic hurricane season this year is because of the regional build-up of ocean heat, along with its global warming component, that fuels hurricanes.
“Ocean Heat Content” should become a standard metric not only for measuring climate change but for testing our computer models that are used to predict the future climate.


1 comment:
This is an important article. Thanks for posting it
Post a Comment