Blog Archive

Showing posts with label weather weirding. Show all posts

Saturday, April 8, 2017

Farming becoming riskier under climate change

from the UNIVERSITY OF ILLINOIS COLLEGE OF AGRICULTURAL, CONSUMER AND ENVIRONMENTAL SCIENCES, March 27, 2017
URBANA, Ill. - Scientists the world over are working to predict how climate change will affect our planet. It is an extremely complex puzzle with many moving parts, but a few patterns have been consistent, including the prediction that farming as we know it will become more difficult.
Scientists infer the impact on agriculture based on predictions of rainfall, drought intensity, and weather volatility. Until now, however, the average farmer may not have been able to put predictions like these into practice. A new University of Illinois study puts climate change predictions in terms that farmers are used to: field working days.
"Everything else flows from field working days," says U of I and USDA Agricultural Research Service ecologist Adam Davis. "If you're not able to work, everything else gets backed up. Workable days will determine the cultivars, the cropping system, and the types of pest management practices you can use. We're simply asking, 'Can you get in to plant your crop?'"
In a previous study, the group developed models that reliably translated past climate data into field working days for Illinois. In the new study, they coupled those models with climate change scenarios to forecast field working days into the future.
The group ran the models for nine crop districts in Illinois for two time periods, mid-century (2046 to 2065) and late-century (2080 to 2099), using three climate scenarios ranging from mild to extreme.
The models suggest that the typical planting window for corn will no longer be workable; April and May will be far too wet to work the fields in most parts of Illinois.
"Going forward, we're predicting warmer and wetter springs, and drier, hotter summers," Davis says. "The season fragments, and we start to see an early-early season, so that March starts looking like a good target for planting in the future. In the past, March has been the bleeding edge; nobody in their right mind would have planted then. But we've already seen the trend for early planting. It's going to keep trending in that direction for summer annuals."
Those drier, hotter summers are likely to change farming practices too, particularly in southern Illinois.
"Drought periods will intensify in mid- to late-summer under all the climate scenarios. If farmers decide to plant later to avoid the wet period in April and May, they're going to run into drought that will hit yield during the anthesis-silking interval, leading to a lot of kernel abortion. That second planting window is probably pretty risky," Davis says.
Risk is the key word. If farmers bet on the early planting window and get hit with a frost or more March precipitation than expected, are they out of luck? Davis says they will have to choose to mud the seed in, plant a different hybrid, or even scrap corn and go for winter wheat later in the season. But given that many farmers choose hybrids and purchase seeds the previous fall, they're unlikely to have that kind of flexibility come spring. Any miscalculation will be incredibly costly.
"It will come down to whether crop insurers will move planting dates earlier in the spring. They're going to need enough years of empirical evidence that this early window exists before they are likely to make that change," Davis notes.
The researcher suggests three strategies to cope with the changes. Farmers could plant early with long-season cultivars to maximize yield potential, betting on a pollination window to open up before the drought kicks in. Or farmers could choose shorter-season cultivars, planting early and then harvesting before the drought, possibly sacrificing yield.
The last strategy will require a more radical shift.
"Create cropping systems that can deal with increased volatility by conserving soil moisture. Most of the effort in yield stability and resilience focuses on genetic improvement of crops. That's good, but I think we've fallen behind in the cropping system management side. If you've got an elite cultivar that's drought resistant in the same old cropping system that's not shifting with environmental changes, then we're not doing full justice to that cultivar," Davis says.
Given the weather in Illinois this late winter/early spring, this work seems particularly timely.
"All this weird weather? It's part of a trend," Davis says. "Now is the time to prepare, because the future is here."
###
The article, "Changes in field workability and drought risk from projected climate change drive spatially variable risks in Illinois cropping systems," is published in PLOS One. Lead author Bradley Tomasek is at Duke University. Marty Williams and Adam Davis are research ecologists with the USDA Agricultural Research Service, and faculty members in the U of I crop sciences department. Funding was provided by the USDA Agricultural Research Service.

Monday, July 6, 2015

Van Gogh Weather Patterns in Pacific: a climate change connection?

by A. Siegel, "Get Energy Smart! NOW!", July 6, 2015

Science combined with nature can turn imageterrifying realities, at times, into gorgeous art. At this moment, there are three active typhoons in the Pacific.  Above is an image capturing them.
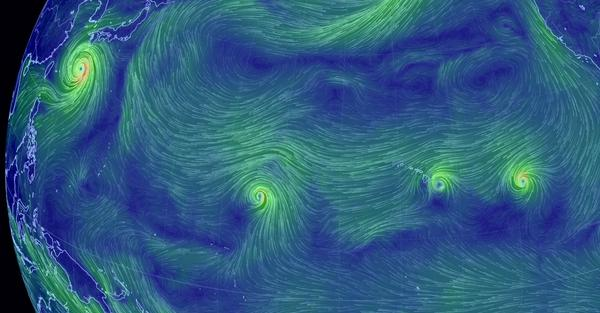
This reminds me strongly of last August when the Pacific Ocean (centered around the Hawaiian Archipelago) had a major meteorological phenomena: a massive set of hurricanes.
Regard this image from that event.
From West to East, these are hurricanes Halong, Genevieve, Iselle, and Julio.
Documentation of severe weather often provides quite striking and even beautiful images.
On first glance, last year and today, my impression was “Van Gogh, not “storm disaster.”

And, even when registering this as a rather impressive (and beautiful image from a) weather pattern, my first thought was not ‘climate change’; yet, this set of four hurricanes is not just occurring within the context of global climate change but could well be a strong indicator of actual change.

Wednesday, July 1, 2015

John Abraham: More evidence that global warming is intensifying extreme weather - A new study finds that global warming is causing weather whiplash

An Indian farmer inspects her agricultural field which is badly affected by the heat wave and scanty rainfall in India.
An Indian farmer inspects her agricultural field which is badly affected by the heat wave and scanty rainfall in India. Photograph: STR/EPA

by John Abraham, "Climate Consensus - The 97%," The Guardian, July 1, 2015

Just this week, a new article appeared in the journal Nature that provides more evidence of a connection between extreme weather and global warming. This falls on the heels of last week’s article which made a similar connection. So, what is new in the second paper? A lot.
Extreme weather can be exacerbated by global warming either because the currents of atmosphere and oceans change, or it can be exacerbated through thermodynamics (the interaction of heat, energy, moisture, etc.). Last week’s study dealt with just the thermodynamics. This week’s study presents a method to deal with both.
The authors, Daniel HortonNoah Diffenbaugh, and colleagues used a new technique to tease apart the complex influences of warming on changes to atmospheric circulation. Dr. Horton told me:
Our study focuses on the need to understand the underlying physical causes of extreme weather events, and to systematically test whether the probability of those underlying conditions has changed in recent decades. Events that are so extreme that they fall outside of our historical experience often result from a suite of complex interacting factors. To better understand these factors we’ve developed a method that allows us to partition the climate influences.
Lead author Daniel Horton.
 Lead author Daniel Horton.
In particular, the authors focused on pressure levels up into the atmosphere (heights of approximately 5 km) from 1979 onwards. Those patterns gave information about atmospheric circulation. The authors grouped the patterns, using seven geographical regions (Europe, Western Asia, Central Asia, Eastern Asia, Western North America, Central North America, and Eastern North America) and four different periods of the year (winter, spring, summer and fall).
They separated changes in circulation from changes in thermodynamic effects. What they found is that most regions have seen increases in summertime warm temperatures in the past three decades. Furthermore, they found that in some regions, a large part of this trend is due to the increases in anticyclonic circulation and atmospheric blocking. The blocking that has been associated with extreme swings of weather (bringing very warm weather to the Western USA and simultaneous cold weather to the east for instance). 
The authors show that as the Earth warms, we expect fewer cold temperature events generally. But, in some cases the circulation changes have led to extreme cold outbreaks in some regions. What has happened is that the Arctic front, which typically confines cold weather to the Arctic region, has undulated sufficiently to allow cold-air breakouts to the south. Think of the polar vortex from last year. 
These findings support the commonly heard term that has emerged in the past few years - “weather whiplash - wild swings from one extreme to another. Importantly, the authors show that the trends are “statistically significant” and are unlikely just random occurrences.
Noah Diffenbaugh.
 Noah Diffenbaugh.
That said, the authors clarify:
The majority of the observed changes in extreme temperature occurrence have resulted from changes in the heat content of the climate system. However, we also find that the risk of extreme temperatures over some regions has been altered by changes in the motion of the atmosphere via changes in the frequency and duration of regional circulation patterns
It’s important to note that the authors do not explicitly attribute the trends to human causes or natural causes. The authors state clearly that we need a deeper understanding of the causes of the trends they’ve found. In particular, a future step will be to separate human causes from natural variability in the climate on the decadal scale. At the same time, they write:
...our quantitative partitioning, in conjunction with targeted climate model simulations offers the potential to fingerprint dynamic and thermodynamic influences in isolation, which in turn may facilitate attribution of the observed trends and projection of future trends.
And that is really what we want to know. How much of this is from humans? How much is natural? And how will things change into the future?

Saturday, June 13, 2015

Rapid Arctic ice loss linked to extreme weather changes in Europe and US

Arctic warming appears to be the prime reason behind fluctuations in the polar jet stream that is causing unusual weather, study says 

by John Vidal, The Guardian, June 1, 2015

BEE9T7 Arctic Glacier Reflected and Melting in Svalbard KongsFjordenGlacierArcticIceBlueSvalbardPolarClimateArcticNorwaySvalbardSpitsbergenNyAlesundNatureLandscapeSceneryPanoramaViewScenicFjordBarentsSeaOceanNordicScandinavianMountainsPolarSummerCalmPlacidPeacefulClimateChangeGlacierMeltingIceEnvironmentalismReflectionDramaticSailingGlobalWarmingKongsfjordenFloat

 Arctic is warming faster than elsewhere, triggering changes in the jet stream which will create more extreme weather in western Europe and North America, researchers say. Photograph: Alamy
The string of massive snowstorms and bone-chilling cold on the US east coast, as well as flooding in Britain and record temperatures in Europe, are linked to rapid ice loss in the Arctic, new research appears to confirm.
While the rapidly-thawing Arctic cannot be held responsible for specific weather events like the “snowmageddon” in 2009, Hurricane Sandy, or European heatwaves, researchers at Rutgers university said it appears to be a prime reason why the polar jet stream – a ribbon of winds that encircles the globe – gets ‘stuck’ with increasing frequency.
Western Europe and large parts of North America will experience more extreme weather because of “Arctic amplification” - the enhanced sensitivity of high latitudes to global warming, the team suggested in a paper published in the journal Philosophical Transactions of the Royal Society A
“We are seeing these extremes because the Arctic is warming faster than elsewhere. The whole lower atmosphere is heating up but the sea ice is the most observable. This is having this effect on the jet stream, making it extend further south and stay longer,” said co-author Jennifer Francis.
“The jet stream creates weather of all sorts and where you are in relation to it dictates wether it is hot or cold. When we have a ridge, or a big bulge, in the the jet stream, it makes it extend further and stay longer. When that ridge is stronger it tends to be more persistent,” she said.
Deep troughs in the jet stream have been seen regularly in the past few years affecting the east coast of the US, western Europe and central Asia. These have brought prolonged, unusually hot weather to some places, and extended cold or record snowfall to others.
“We are seeing extended periods of extreme weather because when the temperature difference between polar and mid northern latitudes gets smaller [because of global warming] this has the effect of weakening the jet stream , allowing it to be deflects more easily and to meander more. It’s a combination of natural conditions being intensified and global warming,” said Professor Francis.
The authors expect that eventually it will be possible to predict accurately which types of extreme events will be more likely to occur in certain areas but because Arctic amplification has emerged only in the past 20 years it is a challenge to pin down exactly how it affects weather patterns. 
But the impacts could be substantial, they warn. “This new manifestation of of global warming ... may have substantial societal impact as more frequent extreme weather events in mid latitudes will affect billions of people directly through damage to property and infrastructure and indirectly through farming and water supplies,” the authors wrote.
The study builds on other research which shows how the changing Arctic may be affecting weather in mid-latitudes. According to some, a slower jet stream takes a more meandering path as it encircles the northern hemisphere. Other studies have linked ice loss in the Barents and Kara seas to the north of Russia with extremely cold winters in central Asia.
According to the US Snow and Ice data centre, Arctic sea ice extent last month averaged 5.4 million square miles), the second lowest April ice extent in the satellite record. It is 313,000 sq m) below the 1981 to 2010 long-term average of 6 million sq m) and 31,000 sq m) above the previous record low for the month observed in 2007.

Wednesday, May 13, 2015

Super El Nino Likely as Huge Warm Water Wave Hits West Coast, Extreme Marine Die Off Developing

by Climate Change SOS, Daily Kos, April 30, 2015
Three tropical cyclones churned the waters around Australia on March 11, 2015, including Pam, which reached category 5 and devastated the south Pacific islands of Vanuatu.
attribution: NASA MODIS
Three tropical cyclones churned the waters around Australia on March 11, 2015, including Pam, which reached category 5 and devastated the south Pacific islands of Vanuatu.
In early March, the strongest wave of tropical convection ever measured (known as the Madden Julian Oscillation) by modern meteorology moved into the western Pacific from Indonesian waters bringing an outbreak of 3 tropical cyclones, including deadly category 5 Pam which ravaged the south Pacific islands of Vanuatu. This extreme outburst of tropical storms and organized thunderstorms pulled strong westerly winds across the equator, unleashing a huge surge of warm water below the ocean surface. Normally, trade winds blow warm water across the Pacific from the Americas to Australia and Indonesia, pushing up sea level in the west Pacific. When the trade winds suddenly reversed to strong westerlies, it was as if a dam burst, but on the scale of the earth's largest ocean, the Pacific. The front edge of that massive equatorial wave, called a Kelvin wave, is now coming ashore on the Americas.
A huge surge of warm water from an enormous deep equatorial wave called a Kelvin wave is now hitting the west coast of the Americas. A wave of similar size struck last year bring a massive marine die off to the west coast, but this year's marine die offs will likely be worse because climate models are predicting it will trigger a super El Nino.
Detailed research in California has found that nutrient upwelling was at a minimum in the El Nino year of 1992 and the super El Nino year of 1998. A huge surge of warm water from an enormous deep equatorial wave called a Kelvin wave is now hitting the west coast of the Americas. A wave of similar size struck last year brought a massive marine die off to the west coast, but this year's die offs will likely be global because climate models are predicting a super El Nino. Credit NOAA.
Last year the largest Kelvin wave ever seen in the Pacific ocean developed in February. After it came ashore and the surge of warm water moved up the Pacific coast, the upwelling of nutrient rich cold water dramatically slowed, and marine life began starving up and down the coast of north America. As the warm water moved north from the equator it merged with an enormous mass of warm stagnant water dubbed "the blob" which had built up in the central north Pacific ocean under the mound of high barometric pressure known as the Pacific high. Because the Pacific high had expanded north of its normal position, possibly because of climate change, warm, stagnant low nutrient water covered a large percentage of the surface of the north Pacific ocean. That stagnant water came ashore on the coast of the Pacific northwest and Alaska as the surge of warm water from the Kelvin wave moved up the California coast. The warm stagnant water lacked nutrients to support the growth of krill and copepods which are at the bottom of the food chain. Species that fed on krill and copepods had little to eat. Juvenile birds were the first to be affected by the lack of food. The west coast marine die off is already a crisis but it's likely to get much worse this summer and fall as  the surge of warm water moves up the coast from the huge Kelvin wave now coming ashore.

"The Pacific Coast saw record numbers of dead Cassin’s Auklets this winter. " Audubon.
10,000 baby sea lions dead on one California island — Experts: “It’s getting crazy… This is a crisis… Never seen anything like it… Very difficult to see so much death” — TV: “Numbers skyrocketing at alarming rates”
An unprecedented number of auklets, a tiny sea bird that dives for plankton, were found dead in Fall 2014, apparently of starvation, along the west coast from California to Canada. Nutrient poor warm waters are the probable cause of the lack of food.
Last year, beginning about Halloween, thousands of juvenile auklets started washing ashore dead from California's Farallon Islands to Haida Gwaii (also known as the Queen Charlotte Islands) off central British Columbia. Since then the deaths haven't stopped. Researchers are wondering if the die-off might spread to other birds or even fish.
"This is just massive, massive, unprecedented," said Julia Parrish, a University of Washington seabird ecologist who oversees the Coastal Observation and Seabird Survey Team (COASST), a program that has tracked West Coast seabird deaths for almost 20 years. "We may be talking about 50,000 to 100,000 deaths. So far."
The warming that last year's huge Kelvin wave brought started a global coral bleaching event is likely to get much worse after this year's huge wave of warm water spreads up and down the coasts of north and south America.
“It started in 2014 – we had severe bleaching from July to October in the northern Marianas, bad bleaching in Guam, really severe bleaching in the north western Hawaiian Islands, and the first ever mass bleaching in the main Hawaiian Islands,” said said Mark Eakin, Noaa’s Coral Reef Watch coordinator.
“It then moved south, with severe bleaching in the Marshall Islands and it has moved south into many of the areas in the western south Pacific. Bleaching just now is starting in American Samoa. In Fiji we’re starting to see some, the Solomon Islands have seen some. We’ve already seen a big event."
Bleaching takes place when corals are stressed due to changes in light, nutrients or temperature – though only the latter can cause events of this magnitude. This causes them to release algae, lose their colour and in some cases die off. It is a relatively rare occurrence. Large-scale bleaching was recorded in 1983, followed by the first global scale event in 1998. A second global wave came in 2010.
NOAA's CFSv2 model is forecasting a strong El Nino event will develop this summer and continue through 2015. Warm water along the west coast, combined with weaker than normal winds caused by El Nino will prevent nutrient rich cold water from welling up along the coast. Species that depend on nutrient upwelling will face starvation. Australia's Bureau of Meteorology has an excellent El Nino forecasting model which is also predicting a strong El Nino. Because the jet stream has already gone into an El Nino pattern by moving south over the eastern Pacific ocean and Mexico and further north than normal over the eastern Atlantic ocean, the likelihood of El Nino failing to strengthen is small. Last year's Kelvin wave failed to bring on a strong El Nino because trade winds in the south Pacific didn't weaken but this year they have and waters along the west coast of south America have already warmed. The south Pacific has moved out of the cool mode it was in a year ago.
NOAA forecast of the departure from normal of Pacific ocean sea surface temperatures.
NOAA forecast of the departure from normal of Pacific ocean sea surface temperatures. NOAA's CFSv2 model predicts a strong El Nino with much above normal sea surface temperatures along the west coasts of south and north America up to January, 2016.
The forecast of a strong El Nino brings good news to California. NOAA's CFSv2 model is forecasting above well above normal precipitation for October through December, 2015. Because models are forecasting El Nino conditions to continue through January 2016 there is a good chance that heavy winter rains will break the California drought. The downside will be massive landslides and flooding in areas that have been affected by recent wild fires.

Wednesday, January 14, 2015

Just another hot year for the record books? Not quite. How 2014 US temperatures support the case for global weirding

by Alex Carr Johnson, High Country News, January 13, 2015
At first glance, the 2014 US Climate Report released this week by the National Oceanic and Atmospheric Agency (NOAA) might look like the new, hotter normal. Overall, the average annual temperature in the lower 48 states was 0.5 °F above the 20th century average. That makes 2014 the 18th warmer-than-average year in a row and the 34th warmest year on record.
For those of us who live in the West, these numbers come as no surprise. All 11 Western states experienced warmer-than-normal years. Eight of them landed in the  top-ten hottest years on record, with California, Nevada and Arizona all experiencing their hottest years ever. Alaska also had a record-breaking hot year, with Anchorage never dipping below 0 °F at any point in 2014, a historic first.
State temperature rankings
Looking east of the Rockies, however, the story quickly becomes, well, weirder. South Dakota had the 34th coldest year on record, and Oklahoma the 29th coldest. Seven states in the middle of the country, from Wisconsin to Louisiana, experienced top-ten most frigid years on record. Most notably, a polar vortex brought the Arctic to the Midwest for the first few weeks of 2014, but cooler-than-normal blasts moved through the region multiple times throughout the rest of the year.
While regional weather differences are nothing new, the prolonged hot-cold divide of 2014 was unprecedented. "Never before have such large areas of the country experienced such radically different temperature extremes," Rebecca Lindsey, managing editor for Climate.gov, explained in a post this past August. From January to July, nearly 40% of the country was affected by extreme temperatures, though which extreme depended on which side of the country you were on.
The primary explanation for the temperature divide rests with the jet stream, a narrow high-speed high-altitude current of air which moves eastward across the northern hemisphere, oscillating between mid- and northern latitudes. Normally, the ridges and troughs of the jet stream tend to shift, allowing for warmer air below and colder air above to swing in and out of each region of the country. Beginning in late 2013, however, the jet stream became stuck. Thanks to a high-pressure system that sat over the northern Pacific and a low-pressure system in the upper Midwest, the jet stream spent the first half of 2014 swinging far north into Alaska and Canada, shooting south along the eastern edge of the Rockies into Texas and the Gulf of Mexico, and then returning north along the eastern seaboard. The West, which remained below the jet stream, stagnated with hot, dry air, while the Midwest was left unguarded from Arctic blasts.
Fortunately for still-drought-stricken California, it does not appear as though the jet stream will be returning to its 2014 rut in the near future, with NOAA forecasting above-average precipitation for California in the first few months of 2015. Don't celebrate too soon, however. The jet stream is just one factor in many that influence short-term climate phenomena and long-term climate trends. The U.S. Seasonal Drought Outlook from December indicates drought will likely persist or intensify in the Pacific Northwest, Great Basin, Four Corners region, and east into the lower plains. Current forecasts indicate continued above-average temperatures in the West for the first quarter of 2015.
Temperature outlook
In regards to the jet stream, this may be just the beginning of many more weird years ahead. Climate scientists are accumulating a growing body of evidence that suggests the quickly-heating Arctic is producing a wavier, stickier jet stream which encourages more persistent weather patterns. This past week, Jennifer Francis of Rutgers University and Stephen Vavrus of University of Wisconsin-Madison published their latest findings on "Arctic amplification" in Environmental Research Letters. "As the Arctic continues to warm faster than elsewhere in response to rising greenhouse-gas concentrations," explain Francis and Vavrus, "the frequency of extreme weather events caused by persistent jet-stream patterns will increase."
For the parched West, let's hope that doesn't mean 2014 on repeat.
http://www.hcn.org/articles/just-another-hot-year-for-the-record-books-not-quite

Monday, August 18, 2014

Scientists probe poorly understood linkage between melting Arctic and extreme weather

by Christa Marshall, E&E reporter, Climate Wire, August 18, 2014


Snowmageddon in Washington, D.C. Extreme floods in the United Kingdom last winter. A Texas heat wave two years ago.
For scientists, they all may be a byproduct of a warming Arctic. Or they might not, as much of the research on causation is still in early stages.
A new review article, released yesterday in Nature Geoscience, offers one additional theory about the link between the Arctic and extreme weather in mid-latitudes, pointing to a possible connection between snow in Siberia and unusual events in much of the United States, Europe and East Asia. But ultimately, the synthesis paper reports that much of the science remains uncertain about the link, as there is contradictory evidence for all of the main theories.
"The discussion on the topic until now has been 'he said, she said' where the ideas presented have been of individual scientists and have covered the spectrum of all possible opinions. This is the first that a group of leading experts with varying opinions all on the same paper and is the most authoritative consensus on the subject," said Judah Cohen, a scientist at Atmospheric and Environmental Research Inc. and lead author of the review article, which included scientists from six universities, research institutes and NOAA.
Basic statistics initially appear to reveal a link between Arctic changes and weather elsewhere. Since the late 1970s, Arctic September sea ice has declined at a rate of 12.4% per decade. The Arctic region has warmed about twice the global average, a phenomenon known as Arctic amplification. At the same time, there has been a trend toward many types of extreme weather in mid-latitudes.
The amount of precipitation on very wet days has increased since the late 1990s in mid-latitudes, for instance, and the percentage of warm days exceeding the 90th percentile has increased from 10% before 1980 to 16% now, the paper notes.

Dynamics that conflict with climate models

The scientists focused on winter weather extremes, as that season has "not always followed the warming script," Cohen said. "While global warming theory is consistent with record warm temperatures and more intense precipitation events, it does not directly explain cold extremes," the paper says. For example, the number of days continuously below freezing has increased in mid-latitudes, a dynamic that is not consistent with the projections of climate models.
The scientists examined dozens of papers and categorized them into three main theories about a possible link between the Arctic and different types of mid-latitude extreme weather. One suggests that warming spurs extra snow over Eurasia, as well as sea ice loss, which in turn shifts storm tracks south.
A second -- and highly discussed -- hypothesis is that a warming Arctic causes the jet stream to weaken and meander more in a North-South direction. Weather systems embedded in the jet stream then move more slowly, allowing events such as lengthy heat waves.
"The temperature difference between the Arctic and mid-latitudes is lessening. This is important because the west to east winds of the jet stream are driven by that temperature difference," said Rutgers University scientist Jennifer Francis, the lead proponent of the theory, in congressional testimony last year. Francis -- one of the co-authors of the new review article -- argued that the lessening temperature differential drives the North-South movement of air.
The third concept -- relevant for winter extremes -- is that the loss of sea ice in the Barents and Kara Seas in fall and winter helps create atmospheric "waves" that transfer energy from the low to the high atmosphere, that in turn alters the deep pressure known as the polar vortex, helping send Arctic blasts south.
The researchers added a fourth theory, that this "wave" phenomena may be boosted by increased snow cover over Siberia in October as well, in conjunction with the loss of sea ice. Previously, sea ice and snow cover on land largely had been talked about separately with the wave theory. "They can amplify the same result," Cohen said.

Four conflicting theories

Each of the theories has drawbacks, according to the paper. While most models show that warming leads to a southward movement of storm tracks, others do not, Cohen said.
The jet stream theory is probably the most controversial, as it is the least studied of the three, even as it is the most discussed, he said. The concept was the focal point of a National Academy of Sciences report in April synthesizing input from an earlier scientific meeting on the plausibility of the Arctic-weather link.
While the jet stream theory is plausible, there are also forces working against it "that may be canceling each other out," Cohen said. Arctic warming is occurring more at the surface and not at jet stream latitudes, he said. The tropics are more where warming is occurring at high latitudes, so it's not clear how much that is countering any influence on the jet stream from the north, he said.
For all three theories, it also is unclear how much Arctic amplification may be caused by mid-latitude weather in the first place via transfer of heat, as opposed to the reverse. Cohen called for more Arctic monitoring stations of everything from humidity to temperature to get a firmer grasp of what's happening.
Earlier this year, five climate scientists wrote a letter in Science during then-frigid temperatures in the eastern United States, urging the public to not make immediate conclusions about a climate change connection to the extreme weather. "The research linking summertime Arctic sea ice with wintertime climate over temperate latitudes deserves a fair hearing. But to make it the centerpiece of the public discourse on global warming is inappropriate and a distraction," the scientists wrote.
While the new analysis does not get any closer to certainty on any of the theories, it was important to get many of the lead scientists studying the topic in consensus on one paper, to provide an information baseline, Cohen said.
"I think the fact that anything was written is an accomplishment," he said.

Thursday, July 17, 2014

Weather weirding: Is global warming causing extreme weather via jet stream waves?

 A new study investigates how changes to atmospheric winds are making weather more extreme

by John Abraham, "Climate Consensus - The 97%," The Guardian, July 17, 2014


The jet stream that circles Earth's north pole travels west to east. But when the jet stream interacts with a Rossby wave, as shown here, the winds can wander far north and south, bringing frigid air to normally mild southern states.
The jet stream that circles Earth's north pole travels west to east. But when the jet stream interacts with a Rossby wave, as shown here, the winds can wander far north and south, bringing frigid air to normally mild southern states. Credit: NASA Goddard Space Flight Center
As I sit here in a northern part of the United States (Minnesota), a rare summer arctic blast barrels down from Canada on what otherwise is one of the warmest days of the year. Global warming? I could use some global warming today, people are saying.
Not only is this a teachable moment, but it coincides with a major new study on climate connections. First, let’s see the current jet stream. It is wildly undulating, first swinging up into northern Canada before curving back and plunging into the central United States. 
Typically, the jet stream represents a separation between cold arctic air and warmer southern air. If you are north of the jet stream, temperatures are cold whereas south of the jet stream it's more likely to be warm.

Image obtained using Climate Reanalyzer (http://cci-reanalyzer.org), Climate Change Institute, University of Maine, USA.

With this in mind, and the jet stream shown, you can almost predict the temperature pattern in the next image. The match is incredible and it is clear that my Minnesota cold-blast is more than balanced out by near 90°F temperatures in northern Canada. With all of this, I want to talk about a new study that looks at these fluctuations on a longer term.

Image obtained using Climate Reanalyzer (http://cci-reanalyzer.org), Climate Change Institute, University of Maine, USA.

Very recently, a paper Amplified mid-latitude planetary waves favor particular regional weather extremes was published in the journal Nature Climate Change. The authors, James Screen and Ian Simmonds, investigated the role that changes to upper level winds in the atmosphere have on the occurrence of extreme weather. What they found was very interesting.
People who follow this site and the climate literature no doubt are aware that a hotly debated topic has arisen in recent years. I have written about studies that have linked loss of Arctic ice and warming of the Arctic region to more severe undulations in the jet stream. That research is still in its infancy and consequently, very exciting. While the idea that global warming increases jet stream undulations have been challenged by others, it is clear that some recent observations support the hypothesis.
The latest study is related to this topic but still unique. The authors don’t ask the question “are humans changing the jet stream patterns?” Instead, they ask, “how do undulations in the jet stream affect weather?” To be fully accurate, the study isn’t just about jet streams, it really deals with mid-latitude planetary waves but for this article, I will use the term “jet stream” as a surrogate for simplicity.
The authors went back into our weather records (1979–2012) and found the 40 months with the most extreme weather (most extreme precipitation and most extreme temperatures). They then evaluated how “wavy” the jet stream was during those extreme months. They found that:
months of extreme weather over mid-latitudes are commonly accompanied by significantly amplified quasi-stationary mid-tropospheric planetary waves. Conversely, months of near average weather over mid-latitudes are often accompanied by significantly attenuated waves.
In common parlance, this means that when the jet stream undulates and travels very slowly, we see more extreme weather. Conversely, when the jet stream travels in a straighter path, the weather is less extreme.
This association itself is not new but it brings the connection of large-scale climatic variations and our local weather to the fore of attention. Perhaps more important, however, are the follow-on observations from the authors. In particular, they report:
Depending on geographical region, certain types of extreme weather (for example hot, cold, wet, dry) are more strongly related to wave amplitude changes than others. The findings suggest that amplification of quasi-stationary waves preferentially increases the probabilities of heat waves in western North America and Central Asia, cold outbreaks in eastern North America, droughts in central North America, Europe, and central Asia, and wet spells in western Asia.
Dr. James Screen, a Research Fellow at the University of Exeter and lead author of the study told me, 
The impacts of large and slow moving atmospheric waves are different in different places. In some places amplified waves increase the chance of unusually hot conditions, and in others the risk of cold, wet or dry conditions.
To my knowledge, previous investigations have not elucidated the geographical locations of extreme weather nor have they identified the location-dependent weather extremes. It will be interesting to watch present and future weather to determine if these relationships between waves and weather continue. 
A note of caution however, we must be mindful that there are other weather factors at play which are superimposed on those discussed in the article. For instance, changes from El Niño to La Niña in the Pacific and long-term variability of sea surface temperatures in the Atlantic are also known to impact our weather extremes. Separating these multiple factors will take skill.

Thursday, July 10, 2014

RealClimate: Rossby waves and surface weather extremes

A new study by Screen and Simmonds demonstrates the statistical connection between high-amplitude planetary waves in the atmosphere and extreme weather events on the ground.

Guest post by Dim Coumou, RealClimate, July 10, 2014

There has been an ongoing debate, both in and outside the scientific community, whether rapid climate change in the Arctic might affect circulation patterns in the mid-latitudes, and thereby possibly the frequency or intensity of extreme weather events. The Arctic has been warming much faster than the rest of the globe (about twice the rate), associated with a rapid decline in sea-ice extent. If parts of the world warm faster than others then of course gradients in the horizontal temperature distribution will change – in this case the equator-to-pole gradient – which then could affect large scale wind patterns.

Several dynamical mechanisms for this have been proposed recently. Francis and Vavrus (GRL 2012) argued that a reduction of the north-south temperature gradient would cause weaker zonal winds (winds blowing west to east) and therefore a slower eastward propagation of Rossby waves. A change in Rossby wave propagation has not yet been detected (Barnes 2013) but this does not mean that it will not change in the future. Slowly-traveling waves (or quasi-stationary waves) would lead to more persistent and therefore more extreme weather. Petoukhov et al (2013) actually showed that several recent high-impact extremes, both heat waves and flooding events, were associated with high-amplitude quasi-stationary waves.

Intuitively it makes sense that slowly-propagating Rossby waves lead to more surface extremes. These waves form in the mid-latitudes at the boundary of cold air to the north and warm air to the south. Thus, with persistent strongly meandering isotherms, some regions will experience cold and others hot conditions. Moreover, slow wave propagation would prolong certain weather conditions and therefore lead to extremes on timescales of weeks: One day with temperatures over 30 oC in say Western Europe is not really unusual, but 10 or 20 days in a row will be.

But although it intuitively makes sense, the link between high-amplitude Rossby waves and surface extremes was so far not properly documented in a statistical way. It is this piece of the puzzle which is addressed in the new paper by Screen and Simmonds recently published in Nature Climate Change (“Amplified mid-latitude planetary waves favour particular regional weather extremes”).

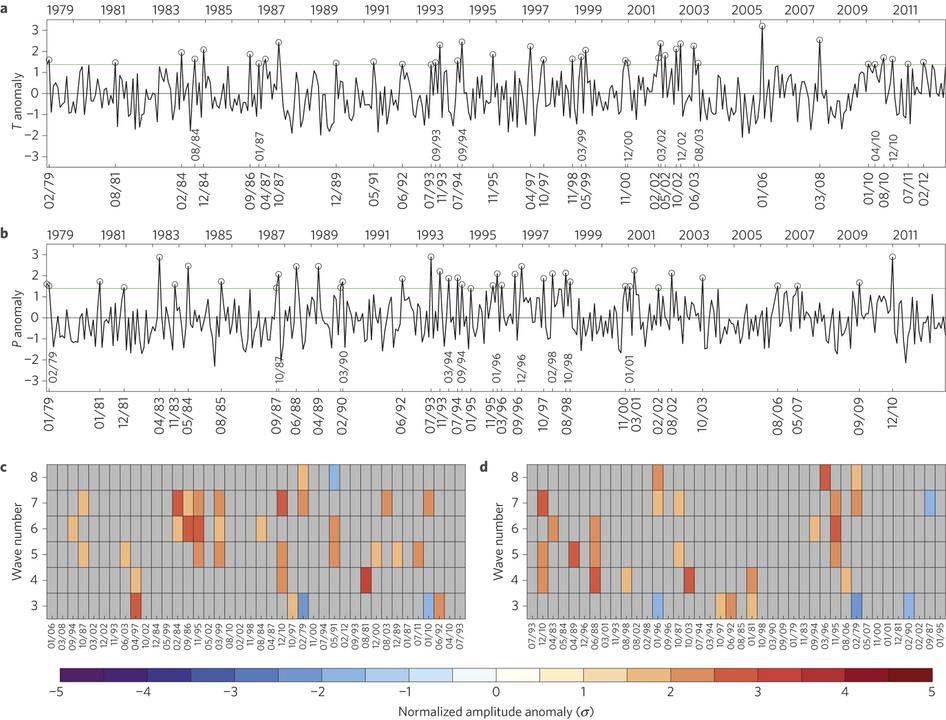
In a first step they extract the 40 most extreme months in the mid-latitudes for both temperature and precipitation in the 19792012 period, using all calendar months. They do this by averaging absolute values of temperature and precipitation anomalies, which is appropriate since planetary waves are likely to induce both negative and positive anomalies simultaneously in different regions. This way they determine the 40 most extreme months and also 40 moderate months, i.e., those months with the smallest absolute anomalies. By using monthly-averaged data, fast-traveling waves are filtered out and thus only the quasi-stationary component remains, i.e., the persistent weather conditions. Next they show that roughly half of the extreme months were associated with statistically significantly amplified waves. Vice versa, the moderate months were associated with reduced wave activity. So this nicely confirms statistically what one would expect.

nclimate2271-f1
Figure: a,b, Normalized monthly time series of mid-latitude–(35°–60° N) mean land-based absolute temperature anomalies (a) and absolute precipitation anomalies (b), 1979–2012. The 40 months with the largest values are identified by circles and labelled on the lower x axis, and the green line shows the threshold value for extremes. cd, Normalized wave amplitude anomalies, for wave numbers 3–8, during 40 months of mid-latitude–mean temperature extremes (c) and precipitation extremes (d). The months are labelled on the abscissa in order of decreasing extremity from left to right. Grey shading masks anomalies that are not statistically significant at the 90% confidence level; specifically, anomalies with magnitude smaller than 1.64σ, the critical value of a Gaussian (normal) distribution for a two-tailed probability p = 0.1. Red shading indicates wave numbers that are significantly amplified compared to average and blue shading indicates wave numbers that are significantly attenuated compared to average. [Source: Screen and Simmonds, Nature Climate Change.]

The most insightful part of the study is the regional analysis, whereby the same method is applied to 7 regions in the Northern Hemisphere mid-latitudes. It turns out that especially those regions at the western boundary of the continents (i.e., western North America and Europe) show the most significant association between surface extremes and planetary wave activity. Here, moderate temperatures tend to be particularly associated with reduced wave amplitudes, and extremes with increased wave amplitudes. Further eastwards this link becomes less significant, and in eastern Asia it even inverts: Here moderate temperatures are associated with amplified waves and extremes with reduced wave amplitudes. An explanation for this result is not discussed by the authors. Possibly, it could be explained by the fact that low wave amplitudes imply predominantly westerly flow. Such westerlies will bring moderate oceanic conditions to the western boundary regions, but will bring air from the continental interior towards East Asia.

Finally, the authors redo their analysis once more but now for each tail of the distribution individually. Thus, instead of using absolute anomalies, they treat cold, hot, dry and wet extremes separately. This way, they find that amplified quasi-stationary waves “increase probabilities of heat waves in western North America and Central Asia, cold outbreaks in eastern North America, droughts in central North America, Europe and central Asia and wet spells in western Asia.” These results hint at a preferred position (i.e., “phase”) of quasi-stationary waves.

With their study, the authors highlight the importance of quasi-stationary waves in causing extreme surface weather. This is an important step forward, but of course many questions remain. Has planetary wave activity changed in recent decades or is it likely to do so under projected future warming? And, if it is changing, is the rapid Arctic warming indeed responsible?

IMG_4765Dim Coumou works as a senior scientist at the Potsdam Institute for Climate Impact Research, where he is leading a new research group which studies the links between large scale circulation and extreme weather.   

References

  1.  J.A. Francis, and S.J. Vavrus. (2012). "Evidence linking Arctic amplification to extreme weather in mid-latitudes," Geophysical Research Letters, 39, http://dx.doi.org/10.1029/2012GL051000
  2.  E.A. Barnes, "Revisiting the evidence linking Arctic amplification to extreme weather in midlatitudes," Geophysical Research Letters, 40, 4734–4739, 2013. http://dx.doi.org/10.1002/grl.50880
  3.  V. Petoukhov, S. Rahmstorf, S. Petri, and H.J. Schellnhuber, "Quasiresonant amplification of planetary waves and recent Northern Hemisphere weather extremes," Proceedings of the National Academy of Sciences, 110, 5336–5341, 2013. http://dx.doi.org/10.1073/pnas.1222000110
  4.  J.A. Screen, and I. Simmonds, "Amplified mid-latitude planetary waves favour particular regional weather extremes," Nature Climate Change, 2014. http://dx.doi.org/10.1038/NCLIMATE2271