When we see records being broken and unprecedented events such as this, the onus is on those who deny any connection to climate change to prove their case. Global warming has fundamentally altered the background conditions that give rise to all weather. In the strictest sense, all weather is now connected to climate change. Kevin Trenberth
HIT THE PAGE DOWN KEY TO SEE THE POSTS
Now at 8,800+ articles. HIT THE PAGE DOWN KEY TO SEE THE POSTS
by Peter Sinclair, This Is Not Cool, December 29, 2015
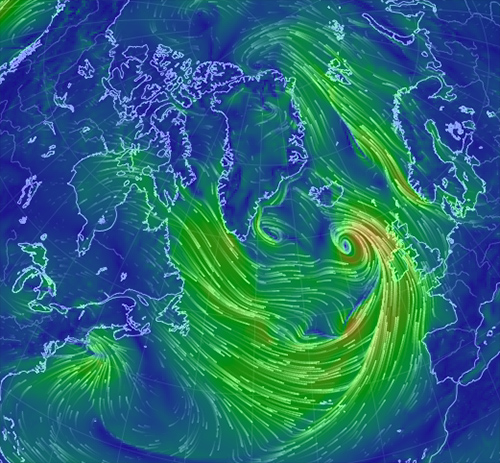
The storm that rampaged thru Texas and wreaked havoc across the south and midwest is winding up to deliver a hot blow to a suddenly vulnerable-even-in-December Arctic.
As it departs North America this week, the storm will rapidly intensify over the northern reaches of the Gulf Stream and draw tremendous amounts of warm air northward from Spain and the Mediterranean Sea toward the Arctic. As the storm approaches Iceland, it will have strengthened to the equivalent of some of the strongest hurricanes ever recorded in terms of atmospheric pressure. Intensely high pressure over western Russia, perhaps boosted by melting sea ice, will aid in setting up the tropics-to-pole atmospheric superhighway.
Unlike other recent episodes of extreme weather around the planet, this storm is probably not related to El Niño, which has limited influence in Europe. The storm will be strengthening over the exact spot that North Atlantic temperatures have been cooling over recent years, an effect that scientists have linked to a slowdown of the basin’s circulation triggered in part by melting sea ice—the same scenario that was highly dramatized in the movie The Day After Tomorrow. This year, there’s been a notable increase in the sharp contrast between this cold patch and record warm ocean temperatures in the tropical Atlantic, an effect that leads to stronger ocean storms—like this one.
The remarkable storm will briefly boost temperatures in the Arctic basin to nearly 10 degrees Fahrenheit warmer than normal—and the North Pole itself will be pushed above the freezing point, with temperatures perhaps as warm as 40 degrees. That’s absolutely terrifying and incredibly rare. Keep in mind: It’s late December and dark 24 hours a day at the North Pole right now. The typical average high temperature this time of year at the North Pole is about minus 15 to minus 20 degrees. To create temperatures warm enough to melt ice to exist in the dead of winter—some 50 or 60 degrees warmer than normal—is unthinkable.
For some perspective, I contacted a team of climate scientists at the University of Washington who maintain a fleet of weather monitoring equipment near the North Pole. James Morison, the principal investigator of the North Pole Environmental Observatory, said he’s “never heard of” temperatures above freezing in the wintertime there. Looking closer at the weather data, it appears this event is in fact unprecedented during the time period from late December through late April.
On Wednesday, the North Pole will be warmer than Western Texas, Southern California, and parts of the Sahara.
In this December 5, 2012, file photo, men walk past a house damaged during Superstorm Sandy in the Belle Harbor section of the Queens borough of New York. IMAGE: KATHY WILLENS/ASSOCIATED PRESS
Hurricanes and tropical storms are reaching their peak intensity closer to the poles, migrating at about 30 miles per decade, according to a new study published Wednesday. If this shift continues, it could have major consequences for places like New York City, Tokyo, Japan and Brisbane, Australia, as well as other high latitude areas that don't normally see intense hurricanes.
The study, published in the journal Nature, is the first to detect this trend, and in doing so it reveals a somewhat indirect but tangible link between human activities and Mother Nature's most powerful storms.
In order to reach their conclusions, the researchers overcame a formidable obstacle that has long hindered research on the links between hurricanes and global warming. Changes in how we detect and measure the intensity of tropical cyclones over the years makes finding statistically significant trends difficult to near impossible.
Typhoon Francisco and Super Typhoon Lekima seen from a satellite on October 23, 2013, as they tracked northwestward toward China and Japan. IMAGE: NOAA
The new study examines a metric known as a storm's "lifetime-maximum intensity" during the period from 1982 to 2012, which is a time frame that is not complicated by changes in storm observations. The metric refers to the point where storms max out in strength.
By examining storm data using this metric, the researchers found a strikingly apparent poleward shift in the locations where storms are reaching their peak intensity. Although the changes varied from ocean basin to ocean basin, with the greatest migration seen in the western North Pacific Ocean, which is the most active area for tropical cyclones, the shift was found in both the Northern and Southern Hemispheres.
In the Northern Hemisphere, the lifetime-maximum intensity point is moving north at 33 miles per decade, whereas in the Southern Hemisphere, that point is moving south at 39 miles per decade.
Such a change is enough to alter the risk that a coastal location will be hit by a major storm, said lead author James Kossin of the National Climatic Data Center.
"There’s no doubt that a signal like this introduces the potential for a change in the risk,” Kossin said in an interview with Mashable. There's certainly a potential for decreased risk in some areas and increased risk in others at higher latitudes.”
The study itself says that if the observed trends continue, there could be "potentially profound consequences for life and property."
In other words, the risk of damage and fatalities from tropical storms and hurricanes could increase in northern latitudes, while declining somewhat at lower latitudes.
Color-enhanced infrared satellite image of Typhoon Usagi as it moved northwestward toward Hong Kong while explosively intensifying to a Category-5 storm. IMAGE: NOAA/COOPERATIVE INSTITUTE FOR METEOROLOGICAL SATELLITE STUDIES, UNIVERSITY OF WISCONSIN-MADISON.
In addition, parts of the tropics that depend on rainfall from tropical storms and hurricanes (collectively referred to as tropical cyclones) to provide water resources may be at risk for lower water availability as the storms move away from them.
One caveat from the study is that there hasn't been a detectable poleward shift in the maximum intensity point of Atlantic tropical cyclones. However, this may be due to other factors that are masking this movement.
"The Atlantic is fairly unique in the last 30 years in how it’s been behaving,” Kossin says. "We kind of suspect that this global signal that we uncovered is just kind of getting muddled up with strong regional effects.
“The takeaway from that is just because we have not seen a trend there in the last 30 years doesn’t mean this effect is not present there, it’s just being masked by other things and it won’t necessarily be masked forever.”
Tracks of all tropical cyclones which formed worldwide from 1985 to 2005. IMAGE: WIKIMEDIA COMMONS
Chris Landsea, a meteorologist at the National Hurricane Center in Miami, Florida, who was not involved in the study, told Mashable: "This is an important, very well researched paper that uncovers something that was unknown previously."
He continued, "Such changes in where storms are peaking are somewhat unexpected (at least to me) but are apparently due to global scale changes in the atmosphere, perhaps tied to anthropogenic [man-made] global warming."
Expanding tropics
The study ties the migration of storms' peak intensity points to a gradual expansion of the tropics, which in turn has been linked to manmade factors. The expansion has to do with the widening of what is known as the Hadley Cell, which is a pattern of air circulation that causes air to converge near the Equator, sparking thunderstorms with heavy rain throughout the tropics. (This helps explain the typical location of rain forests worldwide.)
As air spills out of the Hadley cell and descends, it dries and warms, which is why the subtropics at the edges of the Hadley Cell are often home to deserts.
Studies of how emissions of planet-warming greenhouse gases will affect the tropics have consistently shown that the tropics will expand poleward in both hemispheres, which will push the dry subtropics poleward as well. This is part of the reason why the Southwest U.S. is poised to become drier as the climate warms, since the subtropics are starting to encroach on that area.
Diagram of tropical air circulation, including the Hadley Cell.
According to Kossin, the expansion of the tropics has also been tied to emissions of aerosols, which are small particles in the atmosphere, from factories and natural sources like desert dust, as well as manmade depletion of the stratospheric ozone layer. It is not yet clear which factor is the biggest contributor to the expansion of the tropics, however, Kossin said.
If greenhouse gases are driving the expansion of tropical atmospheric circulation, "then we won’t be seeing any stop to this in the near future," Kossin says.
However, if the main driver is the depletion of the ozone layer, the phaseout of ozone-depleting pollution should slow this expansion over time.
In addition to the growing tropics, two other environmental changes have taken place that affect storm intensity. The first concerns vertical wind shear. This refers to the change in wind speed or direction (or both) with height. Vertical wind shear has increased in the tropics, but decreased farther away from the tropics, closer to the poles. Vertical wind shear can make it difficult for tropical storms and hurricanes to form and intensify, since they tear apart the thunderstorms that comprise the inner core of such storms.
The second is that potential intensity, which is how strong a storm can get given sea surface temperatures and the temperature and moisture content of the upper atmosphere, is also changing. “In the tropics the potential intensity is decreasing, and it's increasing outside of the tropics,” Kossin said.
Hugh Willoughby, a hurricane researcher at Florida State University, told Mashable in an email that the study's results match his understanding of how air circulation is changing in and around the tropics. "My take on the situation is that shear attributable to the subtropical jet will increase as the planet warms; whereas the shear attributable to the middle latitude jet will decrease as high latitudes warm more than the tropics," he said. Willoughby was not involved in the new study.
The link between global warming and tropical cyclone behavior has been a source of controversy in the past, but this study appears to present clear, and unexpected, evidence that storms are already responding to the changing climate.
The big question is what it will mean for coastal residents around the world, but early hints are not encouraging for higher latitude cities.
by David Spratt, Climate Code Red, January 28, 2014 It's a cliche that a picture tells a story better than a thousand words, and it's really true in the case of this extraordinary map of weather modelling of northern hemisphere temperature anomalies (variations from the expected values based on climate records) for 29 January 2014:
It shows swathes of North America and northern Eurasia with winter temperatures up to 20 degrees Celcius (20 C) below the average for this time of the year (deep purple), whilst much of the Arctic is up to 20 C warmer than usual (bright red).
If the Arctic is the Northern Hemisphere's refrigerator, then the freezer door has been opened wide, with frigid air draining into USA/Canada/Eurasia, and unusually warm air rushing into the Arctic.
The reason is well understood, and it's climate-change-driven destabilisation of the jet stream. The jet stream is the river of high altitude air that works to separates Arctic weather from that of northern Europe, Russia and Canada, and which governs much Northern Hemisphere weather. Arctic summer sea-ice loss ice loss has added to ocean and atmospheric heat, pushing the jet stream into a more meandering, S-shape pattern, dragging down and stalling cold and wet conditions over Europe, and bringing extreme weather in its wake.
There is evidence connecting sea-ice loss to the more severe and extreme weather patterns in Europe and North America, consistent with research from the US National Oceanic and Atmospheric Administration (NOAA). As Arctic melting and warming destabilize the jet stream and making it more "wavy," it allows frigid air to plunge farther south. As the jet stream's waves become larger, they slow down or even stall at times, leading to a significant increase in so-called "blocking events," such as the current stalled cold front. These cause extreme weather simply because they lead to unusually prolonged conditions of one type or another.
The consequences are as diverse as the prolonged 2013 summer heatwave, drought and wildfires in the USA; the cool, dull and extremely wet first half of summer 2012 and subsequent extended winter in the UK and other parts of Eurasia; the current extreme cold in much of North America and Eurasia; record heat to the Arctic, as was dramatically experienced in Alaska; and unusual cold, heavy snowfall, record rain and hot spells to much of northern Europe and North America. Following Superstorm Sandy’s battering of the US northeast coast in 2012, flooding in June across central Europe was the worst in 400 years. It's not hard to connect the dots between Sandy and global warming as extreme weather becomes the new norm
Professor Jennifer Francis, of the Rutgers Institute of Coastal and Marine Science, saysthe Arctic-driven changes to the jet stream allow “the cold air from the Arctic to plunge much further south. The pattern can be slow to change because the [southern] wave of the jet stream is getting bigger… so whatever weather you have now is going to stick around.”
In March, new research found that “the severe loss of summertime Arctic sea ice — attributed to greenhouse warming — appears to enhance Northern Hemisphere jet stream meandering, intensify Arctic air mass invasions toward middle latitudes, and increase the frequency of atmospheric blocking events like the one that steered Hurricane Sandy west into the densely populated New York City area.”
A recent study by Liu et al. found that “the recent decline of Arctic sea ice has played a critical role in the recent cold and snowy winters” across the Northern Hemisphere, and Qiuhong Tang of the Chinese Academy of Sciences and colleagues from Beijing and the US report in Nature Climate Change that they have identified a link between declining snow and ice in the polar north, and catastrophic heat waves, droughts and floods in the mid-latitudes. They found a distinct set of patterns of circulation associated with the loss of snow and ice: the upper atmospheric winds in the north become weaker, and the jet stream shifts northwards, which means that weather systems become more stable. The longer a weather system stays in one location, the greater the probability that the conditions will become extreme. http://www.climatecodered.org/2014/01/with-arctic-freezer-door-open-frigid.html
Environmental Research Letter,8 (2013) 041002;doi:10.1088/1748-9326/8/4/041002
The where and when of wetter and drier: disappearing Arctic sea ice plays a role
Abstract
Summer precipitation in northern Europe has been above average for each of the past six years (2007–2012), a pattern that is unprecedented in over a century. During these same years, the summer Arctic sea-ice cover has averaged about 40% below its typical extent prior to the 1950s and set two new record minima. Could there be a connection? This is the question that motivated the new study by Dr. James Screen, a Research Fellow at the University of Exeter, UK, that appears in this issue of ERL (2013 Environ. Res. Lett.8 044015). Adding to the growing body of evidence linking rapid Arctic warming to changing weather patterns in the northern hemisphere mid-latitudes, he concludes that sea-ice loss and associated surface warming lead to large-scale circulation patterns that favor wet summers in northern Europe and dry summers along the northern Mediterranean.
by Jennifer Francis
Dr. Screen used a state-of-the-art atmospheric model to compare the mid-latitude circulation during conditions of extensive sea ice (representative of the late 1970s) to that with much reduced sea ice (representative of present day). Except for the sea-ice extent and ocean temperatures where ice was lost, all surface conditions were fixed at climatological values in the model, thereby isolating the influence of sea-ice loss. Observation-constrained reanalysis fields were composited for the wettest and driest summers in northern Europe and used to verify the model simulations.
The atmospheric responses to reduced sea ice in both real and modeled worlds show not only precipitation patterns in Europe similar to those observed during the past six abnormally wet summers, but they also reveal features in the large-scale circulation that appear coincident with unusual weather patterns experienced elsewhere around the Northern Hemisphere in recent years. For example, the meridional wind anomalies near the jet-stream level (Figure 6a in Screen 2013) suggest that reduced sea ice favors enhanced ridging over the western North Atlantic, which is consistent with increased high-pressure blocking observed during June (Hanna et al.2013) and expanded melting of the Greenland ice surface (Nghiem et al.2012). The increased ridging implied by the pair of positive/negative anomalies over North America is consistent with recent drought and heat waves in the western part of the continent. Enhanced troughing in the eastern North Pacific agrees with an observed poleward shift in the Aleutian storm track (Bender et al.2012). More generally, the patterns of response to sea-ice loss revealed in this investigation further support previous studies linking Arctic warming and ice loss with changes in the large-scale circulation (e.g., Overland et al.2012, Screen and Simmonds 2013, Francis and Vavrus 2012, Petoukhov et al.2013 and Cassano et al.2013 and references therein).
This new study by Dr. Screen contributes additional evidence that Arctic sea-ice loss is partly responsible for shifting weather patterns, and provides new detail about the timing, location, and types of patterns that are expected to emerge as Arctic and global warming continue unabated.
Edited by Kerry A. Emanuel, Massachusetts Institute of Technology, Cambridge, MA, and approved October 18, 2013 (received for review July 30, 2013)
Abstract
Changes in global (ocean and land) precipitation are among the most important and least well-understood consequences of climate change. Increasing greenhouse gas concentrations are thought to affect the zonal-mean distribution of precipitation through two basic mechanisms. First, increasing temperatures will lead to an intensification of the hydrological cycle (“thermodynamic” changes). Second, changes in atmospheric circulation patterns will lead to poleward displacement of the storm tracks and subtropical dry zones and to a widening of the tropical belt (“dynamic” changes). We demonstrate that both these changes are occurring simultaneously in global precipitation, that this behavior cannot be explained by internal variability alone, and that external influences are responsible for the observed precipitation changes. Whereas existing model experiments are not of sufficient length to differentiate between natural and anthropogenic forcing terms at the 95% confidence level, we present evidence that the observed trends result from human activities.
Significance
This study provides evidence that human activities are affecting precipitation over land and oceans. Anthropogenic increases in greenhouse gases and stratospheric ozone depletion are expected to lead to a latitudinal intensification and redistribution of global precipitation. However, detecting these mechanisms in the observational record is complicated by strong climate noise and model errors. We establish that the changes in land and ocean precipitation predicted by theory are indeed present in the observational record, that these changes are unlikely to arise purely due to natural climate variability, and that external influences, probably anthropogenic in origin, are responsible.
Human influence detected in global rainfall patterns by Gabriel Popkin, ScienceNews.org, November 11, 2013
BLOWING UP Stormy weather appears over the eastern United States in this satellite photo. Human-caused climate change is pushing storms away from the equator, a new analysis finds.
Greenhouse gases emitted by human activity are strengthening storms and causing rain bands and dry zones to move poleward, scientists report November 11 in the Proceedings of the National Academy of Sciences.
Climate simulations have long forecast that climate change caused by greenhouse gas emissions will make rain heavier and more intense, while also pushing storms and deserts away from the equator. Observed climate patterns that match these predictions are called "fingerprints" of human activity. Researchers have struggled to find such fingerprints because weather is notoriously fickle.
In the new study, Kate Marvel and Céline Bonfils, climate scientists at Lawrence Livermore National Laboratory in California, develop a statistical method to separate human influence from natural variation in precipitation. The researchers use the method to see whether satellite and ground-based rain measurements from 1979 to 2012 matched predicted fingerprints. Marvel and Bonfils find that storms had indeed strengthened, and both storms and deserts had migrated toward the poles.
Only human influence can account for these trends happening in tandem, Marvel and Bonfils conclude.
NASA Study Finds Rising Arctic Storm Activity Sways Sea Ice, Climate October 6, 2008 -- A new NASA study shows that the rising frequency and intensity of arctic storms over the last half century, attributed to progressively warmer waters, directly provoked acceleration of the rate of arctic sea ice drift, long considered by scientists as a bellwether of climate change.
NASA researcher Sirpa Hakkinen of Goddard Space Flight Center in Greenbelt, Md., and colleagues from Woods Hole Oceanographic Institution, Woods Hole, Mass., and the Arctic and Antarctic Research Institute, St. Petersburg, Russia, set out to confirm a long-standing theory derived from model results that a warming climate would cause an increase in storminess. Their observational approach enabled them to not only link climate to storminess, but to also connect increasing trends in arctic storminess and the movement of arctic ice -- the frozen ocean water that floats on the Arctic's surface. Results from their study as well as what they could mean for future climate change appeared this month in the American Geophysical Union's Geophysical Research Letters. > Larger image Data from Arctic buoys reporting surface air temperatures and sea level pressure were used to create sparse storm tracks from 1950 to 1972. Buoys also captured the data used to create the more abundant storm tracks from 2000 to 2006. Credit: NASA.
"Gradually warming waters have driven storm tracks -- the ocean paths in the Atlantic and Pacific along which most cyclones travel -- northward. We speculate that sea ice serves as the 'middleman' in a scenario where increased storm activity yields increased stirring winds that will speed up the Arctic's transition into a body of turbulently mixing warm and cool layers with greater potential for deep convection that will alter climate further," said Hakkinen. "What I find truly intriguing about confirming the link between the rise in storminess and increased sea ice drift is the possibility that new sinks for carbon dioxide may emerge from this relationship that could function as negative feedback for global warming."
Hakkinen and colleagues analyzed 56 years of storm track data from earlier studies and annual data on atmospheric wind stress, an established indicator of storm activity, that is generated by the National Center for Atmospheric Research in Boulder, Colo. The data confirmed an accelerating trend in storm activity in the Arctic from 1950 to 2006. Acknowledging ice as a harbinger of climate change, they next analyzed ice drift data collected during the same 56-year period from drifting stations and after 1979 from drifting buoys positioned around the Arctic that measured surface air temperature and sea level pressure. > Click to view animation (6 Mb) Pushed along by surface winds, sea ice is constantly in motion, as seen in this animation produced from observations by the AMSR-E instrument aboard NASA's Aqua satellite in 2005-2006. Credit: NASAThe team found that the pace of sea ice movement along the Arctic Ocean's Transpolar Drift Stream from Siberia to the Atlantic Ocean accelerated in both summer and winter during the 55-year period. The accelerating pace of sea ice drift coincided with an increase in wind stress. Because the surface wind is known to be the "driving force" behind the movement of sea ice, they concluded that the increase in arctic storminess and the sea ice drift speeds are linked. The finding could reinforce the critical role changes in the Arctic Ocean play in global ocean circulation and climate change.
"Ice is a very simple medium. It really is highly responsive to atmospheric forcing, a great test bed for studies like ours. Sea ice is a bellwether of climate change," said Hakkinen. "Several analyses of sea level pressures suggest increased storm activity, but some of these reports are contradictory. We used a different approach to get to the bottom of this by looking at changes in wind stress and sea ice drift rather than sea level pressure as others had done. We identified a new trend -- an increase in the magnitude of surface wind stresses over the 56-year period that tells us that storm activity and sea ice movement are connected through a cause-and-effect relationship. We didn't have solid proof until now. This relationship holds major importance for the stability of the Arctic Ocean, and the mixing of warmer and cooler layers of its water."
Progressively stronger storms over the Transpolar Drift Stream forced sea ice to drift increasingly faster in a matter of hours after the onset of storms. After analyzing past data from ground-based stations based in northern Alaska, on the mobile Fletcher's Ice Island, and in North Pole area’s formerly claimed by then-Soviet Union, and others scattered across the Arctic by the International Arctic Buoy Program, Hakkinen and colleagues reported an increase over 56 years in maximum summer sea ice speeds from about 20 centimeters per second to more than 60 centimeters per second, and wintertime speeds from about 15 centimeters per second to about 50 centimeters per second.
The moving sea ice forces the ocean to move which sets off significantly more mixing of the upper layers of the ocean than would occur without the "push" from the ice. The increased mixing of the ocean layer forces a greater degree of ocean convection, and instability that offers negative feedback to climate warming. Globally, oceans absorb about 30% of the carbon dioxide carried by the atmosphere. According to the new findings by Hakkinen and her colleagues, the Arctic's capacity to absorb carbon dioxide could climb.
Hakkinen believes the study's approach also holds relevance for testing scientific computer models. "Twentieth century model simulations of storm activity and carbon dioxide scenario simulations from the last half century will be a test for climate change prediction models to see if they produce results in line with ours," she said.
"Although it remains to be seen how this may ultimately play out in the future, the likelihood this increasing trend and link between storminess and ice drift could expand the Arctic's role as a sink for extracting fossil fuel-generated carbon dioxide from the air is simply fascinating," said Hakkinen. "If it unfolds in the way we suppose, this scenario could, of course, affect the whole climate system and its evolution."
Here is a graph of storm data gleaned from the NOAA National Climatic Data Center (U.S. Department of Commerce). What this graph obviously shows is that the National Oceanic and Atmospheric Administration (NOAA) is a fringe left-wing organization using taxpayer money to say that the sky is falling because they are anti-business and hate America…Right?
Climate model simulations suggest that the extratropical storm tracks will shift poleward as a consequence of global warming. In this study the northern and southern hemisphere storm tracks over the Pacific and Atlantic ocean basins are studied using observational data, primarily from the International Satellite Cloud Climatology Project, ISCCP. Potential shifts in the storm tracks are examined using the observed cloud structures as proxies for cyclone activity. Different data analysis methods are employed, with the objective to address difficulties and uncertainties in using ISCCP data for regional trend analysis. In particular, three data filtering techniques are explored; excluding specific problematic regions from the analysis, regressing out a spurious viewing geometry effect, and excluding specific cloud types from the analysis. These adjustments all, to varying degree, moderate the cloud trends in the original data but leave the qualitative aspects of those trends largely unaffected. Therefore, our analysis suggests that ISCCP data can be used to interpret regional trends in cloudiness, provided that data and instrumental artefacts are recognized and accounted for. The variation in magnitude between trends emerging from application of different data correction methods, allows us to estimate possible ranges for the observational changes. It is found that the storm tracks, here represented by the extent of the midlatitude-centered band of maximum cloud cover over the studied ocean basins, experience a poleward shift as well as a narrowing over the 25 year period covered by ISCCP. The observed magnitudes of these effects are larger than in current generation climate models (CMIP3). The magnitude of the shift is particularly large in the northern hemisphere Atlantic. This is also the one of the four regions in which imperfect data primarily prevents us from drawing firm conclusions. The shifted path and reduced extent of the storm track cloudiness is accompanied by a regional reduction in total cloud cover. This decrease in cloudiness can primarily be ascribed to low level clouds, whereas the upper level cloud fraction actually increases, according to ISCCP. Independent satellite observations of radiative fluxes at the top of the atmosphere are consistent with the changes in total cloud cover. The shift in cloudiness is also supported by a shift in central position of the mid-troposphere meridional temperature gradient. We do not find support for aerosols playing a significant role in the satellite observed changes in cloudiness. The observed changes in storm track cloudiness can be related to local cloud-induced changes in radiative forcing, using ERBE and CERES radiative fluxes. The shortwave and the longwave components are found to act together, leading to a positive (warming) net radiative effect in response to the cloud changes in the storm track regions, indicative of positive cloud feedback. Among the CMIP3 models that simulate poleward shifts in all four storm track areas, all but one show decreasing cloud amount on a global mean scale in response to increased CO2 forcing, further consistent with positive cloud feedback. Models with low equilibrium climate sensitivity to a lesser extent than higher-sensitivity models simulate a poleward shift of the storm tracks.



 Posts
Posts





