Blog Archive

Showing posts with label Kelvin wave. Show all posts

Thursday, April 24, 2014

Is a Powerful El Niño Brewing in the Pacific Ocean?

by Rob Painting, Skeptical Science, April 23, 2014

Key Points:
  • El Niño puts in an appearance every two to seven years, and involves the abrupt discharge of heat from the tropical ocean to the atmosphere - often resulting in years with warmer-than-average global surface temperatures.
  • Every now and then a very large event occurs, such as the one in 1997-1998 which broke surface temperature records at the time and caused worldwide disruption and damage.
  • The current large build-up and eastward movement of heat in the equatorial subsurface ocean strongly hints at a powerful El Niño developing this year.
  • A powerful El Niño is by no means guaranteed, but should one develop mid-2014 to mid-2015 would likely be the hottest 12 months ever recorded. Unfortunately widespread weather-related chaos and mass coral bleaching is almost certain to follow.
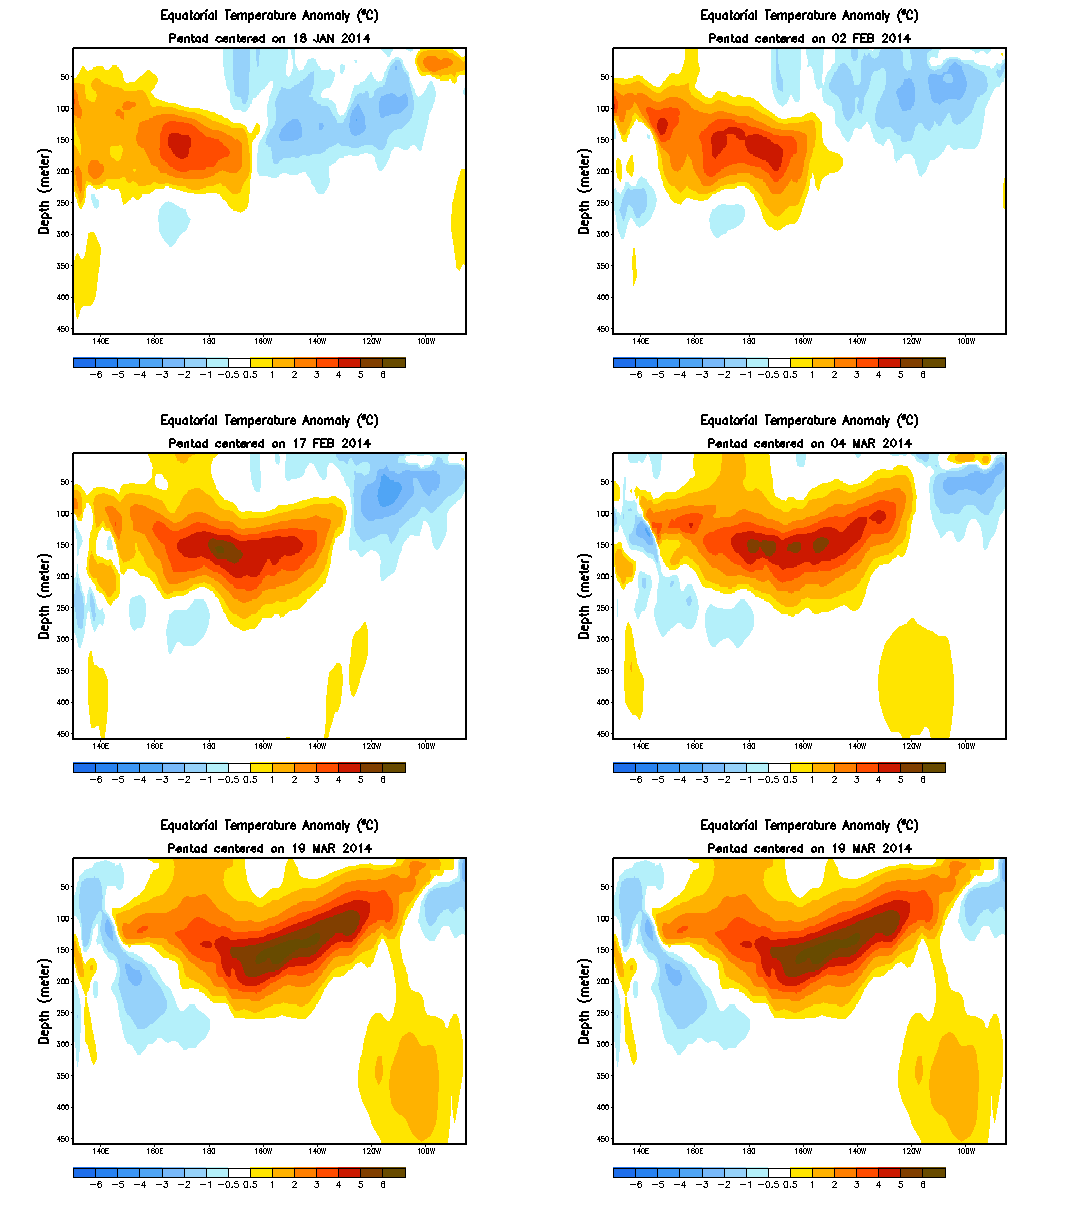
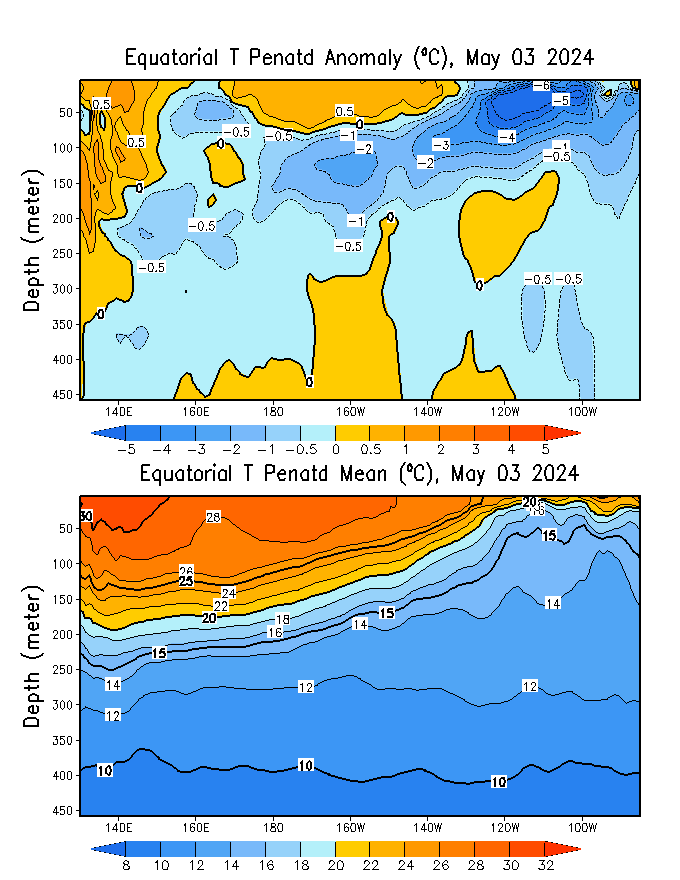
Figure 1.  Ocean temperature vs depth anomalies for the equatorial Pacific in 2014. Image from NOAA CPC.

Normal Transmission in the Tropical Pacific Ocean

The prevailing (dominant) winds in the tropical Pacific Ocean are the easterly trade winds which blow toward the west off the equator. These winds exist, in part, because the strong solar heating of the ocean there drives strong evaporation and the uplift of warm air from the sea surface. Air flows in above the sea surface to take the place of the warm air that has been vertically displaced, but this low-level air curves toward the west due to Earth's eastward rotation - a phenomenon known as the Coriolis Effect.
An index known as the Southern Oscillation Index (SOI) describes the state of the trade winds, and measures the air pressure difference at sea level between Tahiti in the central Pacific and Darwin at the edge of the western Pacific. Under normal conditions the ocean near Tahiti sits in an area of high pressure, and Darwin in an area of low pressure. As the ocean surface is warmer in the western Pacific there is stronger upward movement of warm moist air (convection) and this lowers atmospheric pressure there relative to the ocean around Tahiti. As a result air at sea level moves 'downhill' from high to low pressure and the trade winds are reinforced.
Figure 2.  Recent SOI observations showing present negative conditions - an indication that the pressure at Tahiti is currently lower than that at Darwin. Sustained negative values below -8 generally indicate El Niño conditions. Image from the Australian Bureau of Meteorology (BOM).     
Persistent trade winds have a curious effect on the motion of the water beneath them. Rather than travelling in the same direction as the wind, as one might intuitively expect, the westerly-moving trade winds induce a net current below the surface (Ekman transport) that travels at right angles (90°) to the wind. This near-surface current moves to the right of the wind direction in the Northern Hemisphere, and to the left in the Southern Hemisphere, and what we end up with is a large-scale movement of water away from the equator near the surface. This surface displacement pulls cold water up from the deep at the equator and creates the 'cold tongue' in the eastern and central Pacific
Figure 3.  Upwelling at the equator. The trade winds result in a net flow of water away from the equator due to the Coriolis Force. At the equator subsurface water is drawn up to the surface to replace it. The shallow thermocline (a result of water displacement to the west in the thin equatorial strip where the Coriolis Force drops to zero) in the east enables nutrient rich cold water from the deep to be drawn up to the surface, whereas in the west the deep thermocline results in recirculation within the layer above the thermocline. Image by jg.
Because there is no Coriolis Force in a thin band along the equator, rather than being directed at right angles to the wind (as elsewhere), water is dragged along in the direction of the wind, and piles up in the west and deepens the thermocline - so long as the wind is maintained. This piling up of water mass in the western Pacific also results in the flow of tropical water through the Indonesian archipelago into the Indian Ocean.  

El Niño: A Break From Normal Transmission

Every 2-7 years or thereabouts El Niño signals an abrupt turnaround in this familiar pattern. Unlike La Niña, which is a strengthening of the normal circulation, El Niño comes about when the trade winds weaken. Although the details are vague and the precise triggers for El Niño development are still unknown, the normally intense trade winds weaken and the water piled up in the west begins to move back toward the eastern tropical Pacific in waves known as Kelvin waves. With this relaxation of the trade winds, the flow of warm water through the Indonesian Archipelago begins to wind down too.
Kelvin waves are 'helped' eastward by westerly wind bursts often associated with the formation of tropical lows and cyclones. As these spin clockwise in the Southern Hemisphere and counter- clockwise in the Northern Hemisphere, the equator-ward edge results in intense westerly winds. Very close to equator, where the Coriolis force is zero, water is dragged in the same direction as the wind, but outside this thin strip the Coriolis force makes its presence felt. As mentioned earlier, the Coriolis force results in a net movement of water below the surface that is at right angles (90°) to the wind - to the right of motion in the Northern Hemisphere and to the left in the Southern hemisphere. So the flow of water beneath the surface in response to westerly wind bursts moves toward the equator, and any poleward deviations are likewise generally directed back toward the equator. The Coriolis Effect therefore results in the Kelvin wave being confined to the equator, with the equator itself acting as a boundary between the wave travelling west in the two hemispheres.
Figure 4.  The transit of the equatorial Kelvin wave across the Pacific basin is revealed by the sea surface height anomalies in 2014. As the warm water moves across the basin the greater thermal expansion of the warmer-than-normal water elevates the sea surface above it. Image from NOAA GODAS. 
When the Kelvin waves reach the eastern Pacific they ride up the thermocline slope (the sharp temperature transition between less dense warm surface water and dense cool deep water) toward the surface, depressing the thermocline in the process, and are deflected north and south along the coast of North and South America. This gives the characteristic warm tongue-like feature in sea surface temperatures in the eastern Pacific during the peak phase of El Niño, and also shuts off the upwelling of cold water there. Not only is heat at the surface given up to the cooler atmosphere above, but heat is discharged poleward out of the equatorial zone via the ocean itself in a series of processes that are too long-winded to go into here. Suffice to say that the discharge ofheat from the equatorial ocean eventually moves it back to a recharge mode - accumulating warm water for the next El Niño discharge.

Large Warm Water Anomaly Typically Equals Large El Niño 

The large blob of warm water moving westward in the animation in Figure 1 above may look impressive, but how does it stack up against previous El Niño? The image below (Figure 5) illustrates the size (magnitude) of the equatorial warm water volume anomaly (the warm blob) relative to previous years. This shows that the current blob of warm water is comparable in magnitude, at this stage, to the El Niño event of 1997-1998.
Figure 5.  Equatorial warm water volume anomaly (temperatures above 20 °C) over the last few decades and up to early 2014. Warm volume anomaly in blue and seasurface temperatures (SST) for the NINO 3.4 region in red. As the grey band indicates, the 2014 volume anomaly is second only to the event of 1997-1998 in magnitude. Image from the TAO Project at NOAA.  
Do larger equatorial warm water volume (WWV) anomalies necessarily translate into larger El Niño events? Although we have only a few decades worth of reliable observations, it does seem that the magnitude of the warm water anomaly typically leads to larger events. The relationship between WWV and eventual sea surface temperatures are apparent in Figure 5, but this was also a key finding of Meinen and McPhadden (2000) - see Figure 6.      
  
Figure 6.  Comparison of Nino3 SST and WWV anomalies. SST time series has been shifted backward by 7 months to maximize the cross correlation between WWV and SST. Lines represent least square fits to the values, separated into seasons with a negative WWV anomaly and those with a positive WWV anomaly. Image from Meinen and McPhadden (2000).

Keep a Close Watch on the Pacific 

As stated earlier, we only have just over two decades worth of reasonably detailed observations, so it is by no means guaranteed that a powerful El Niño will develop. But, based on what we have observed and our current physical understanding of the phenomenon, the evolution of an intense El Niño event is possible. It's true the models are not yet predicting a large event, but they did fail to predict the magnitude of the 1997-1998 event, so are not necessarily a reliable indicator of scale this far in advance.    
The arrival of a powerful El Niño would cause an abrupt rise in global surface temperatures as heat is discharged from the tropical ocean, and would entail widespread weather-related disruption and suffering around the world - so is not something to be welcomed. We (SkS) will take a look at the likely consequences if such an event unfolds, but for now we'll keep a watchful eye on the Pacific...

Tuesday, March 25, 2014

If you like drama, this is fairly exciting: Monster El Nino Emerging From the Depths: Nose of Massive Kelvin Wave Breaks Surface in Eastern Pacific

by Robert Schribbler, from his blog, March 25, 2014


Monster El Nino
(A monster Kelvin wave, possibly more powerful than the 1997-98 event, is now rushing toward the surface of the Eastern Pacific. Image source: NOAA/ESRL.)
We are observing an extraordinarily powerful Kelvin Wave, one that was likely intensified by factors related to human global warming, traveling across the Pacific. It appears to be an epic event in the making. One that may be hotter and stronger than even the record-shattering 1997-98 El Nino. What this means is that we may well be staring down the throat of a global warming riled monster.
*   *    *    *    *
Ever since the early 2000s very strong east-to-west trade winds have been blowing across the Pacific. By around 2010, the force of this wind pattern had risen to never before seen records. Over the years, these record winds piled very warm waters in a region of the world east of the Philippines and Australia. As the pool grew warmer, evaporation increased and salinity levels in the hot water pool spiked. Increasing salinity in the zone resulted in a down-welling current that transferred heat into the ocean’s depths.
By 2013, this hot water pool had grown into a vast abyss of heat. Cyclones forming over this zone experienced a kick in intensity as the typical upwelling force of their winds only dredged more hot water from the ocean deeps. It was a pattern that is contrary to typical tropical storm dynamics in which cooler waters drawn up by intense storms tend to limit their peak strength. Not so with mega-typhoon Haiyan, the strongest storm ever to strike land. The cyclonic wind pattern only dredged more heat from the extraordinarily deep hot water. And so the storm only grew stronger and stronger, knowing little in the way of limits before it barreled into an already storm-battered Philippines.
After Haiyan’s passage, the heat pool remained, only growing deeper and more intense, waiting for a change in the wind. And by January of 2014, that wind change was already well on its way.
In Deep, Hot Water
Like an enormous bag waiting to burst eastward, the hot water pool contained temperatures of 29-30 degrees C or hotter and sagged deep, extending up to 150 meters below the ocean surface. A vast stretch of explosive heat that had been held in check from an equatorial surge only by the strongest trade winds on record. But by January, those trade winds had faded. The east-west flow first weakened, then it fluttered, then it died, allowing the wind direction to reverse.
Strong Trade Winds Hot Ocean
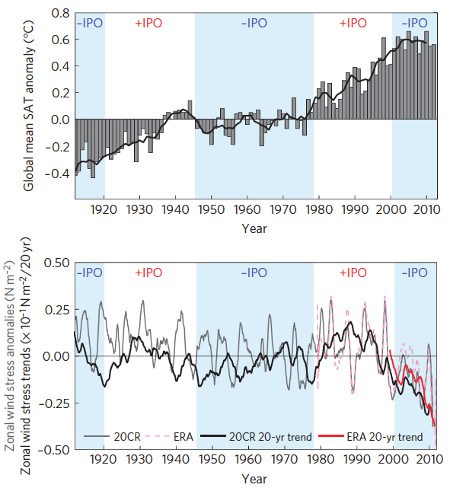
(Did strong trade winds intensify the current Kelvin Wave by piling hot water into the Western Pacific? Top graph shows ocean heat content rise, bottom graph shows zonal wind strength of the trade winds through 2011. Note that IPO divergence roughly correlates with trade wind intensity fluctuation. Image source: England Study.)
This trade wind reversal has, since January, been facilitated by a string of explosive low-pressure systems that developed in the vicinity of the Western Pacific both south and north of the equator. Northern Hemisphere storms circulate in a counter-clockwise fashion, while Southern Hemisphere storms circulate clockwise. When the storms line up, they kick storm winds out along the equator, providing strong reversals to the trade winds and further shoving our hot, monster Kelvin wave to the east.
And as the trade winds fell and reversed due to this sporadic assault of countervailing storms, the hot, deep pool of water surged eastwards. To those on the surface, the motion was invisible. And but for a series of floats spread throughout the Pacific, we would never know a monster thing was rushing along toward the east at a depth of about 150 meters below.
But the floats did their work and by late February it looked like a rather strong heat pulse was on its way across the Pacific Ocean. Risks began to dramatically increase that the heat would breach the surface of the Eastern Equatorial Pacific and set in place the globe-altering weather pattern called El Nino. In a world where human warming was already having serious impacts, the emergence of a new, potentially strong El Nino was not at all a welcome sign. For one, it meant new global high temperature records were likely to soon follow.
It also meant that world food security may well be about to receive yet one more staggering blow.
First Warnings
As the signal for a new El Nino began to appear in the models during late February, NOAA started to issue watches and predictions. Initial estimates were for a 52% chance of El Nino by late 2014.
These warnings caused a ripple of concern through the global food markets. Already reeling under the insults of a series of severe, climate change induced, droughts from Brazil and Argentina, to California and Texas, to the Middle East, to China, the world’s growers were hardly prepared for another series of anomalous weather eventsRussia rolling into bread-basket Ukraine further set anxieties alight. But the threat of even a moderate El Nino and its associated droughts and extreme weather seemed to be a rising perfect storm for what was already a terrible year.
Southeast Asia often experiences an interruption of the annual monsoon in association with El Nino. So the region, which was already suffering from ground water shortages, lowering glacial outflows and sporadic periods of intense drought — all conditions related to growth, over-consumption and climate change — could ill afford yet one more strike against it.
Still, the strike appeared to be gathering heat and steam.
A Rising Monster Pushing the Tip of Its Nose up in the Eastern Pacific
As growers and states with marginal or bad food security grew more anxious, the hot water surge intensified. Researchers independent of NOAA began to issue estimates for a 60, 70 even 80% probability for the emergence of El Nino. Others, tracking what now appeared to be the hottest Kelvin wave ever seen, began to issue warnings that a monster event may well be on the way.
Deep Hot Water
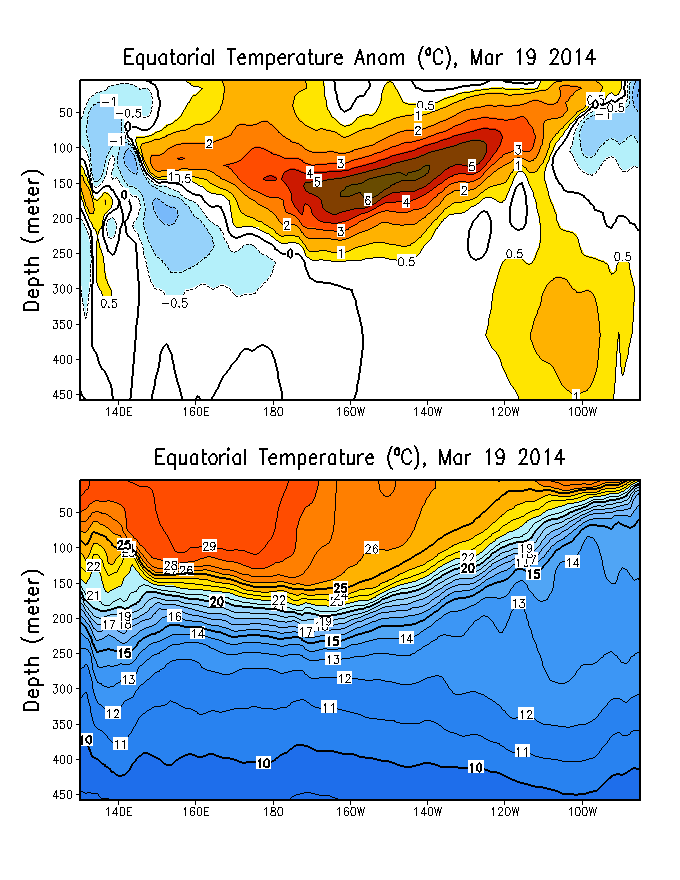
(Most recent NOAA Kelvin wave assessment. Top panel shows deep-water high-temperature anomalies telegraphing across the Pacific and pushing toward the surface. Large, deep pool of hot water providing energy to for the wave is visible in the bottom panel. Image source: NOAA.)
At issue were deep ocean temperature anomalies that were now rushing across the Pacific and beginning to rise toward the surface. The zone in late February that had indicated temperature anomalies in the range of +4-6 C was over an area of approximately 48 degrees of longitude. By March 19, the hot zone of 4-6 C above normal temperatures had expanded to cover about 62 degrees of longitude, and contained a hotter 5-6 C anomaly zone that was now larger than the 4-6 C zone from late February. The deep, hot water pool in the Western Pacific was now beginning to set up a kind of bridge in which it could transfer east, dump its heat into the atmosphere and disrupt global weather. Perhaps, somewhat more disturbing, it was linking to a deep pool of warmer water off the coast of South America (also see animation at the top of this post).
By comparison, the monster El Nino of 1997 featured a Kelvin wave covering about the same area but whose high temperature anomalies only peaked out at about 4.5 C above average. So the current Kelvin wave is of approximately the same size but, based on current observations, appears to contain more heat.
The Kelvin wave had also begun to tilt up in the front with its ‘nose’ just starting to break the Pacific Ocean surface at between 120 and 100 West longitude. This put the tip of the rising heat spike almost due south of Baja California and almost due west of the Peru and Ecuador border as of yesterday, March 23.
Monster El Nino Shows Nose
(Monster El Nino pokes the tip of its nose through Pacific surface waters between 120 W longitude and 100 W longitude along the equator. Image source: NOAA/ESRL.)
In the above ocean temperature anomaly measure for March 23, 2014, we can see a hot pool in the range of 1 to 2 C above average beginning to emerge between 120 and 100 West longitude. It is a heat pulse that has eliminated all but the closest near-shore cool upwelling along the west coast of South America.
Should the rest of the Kelvin wave follow, temperature anomalies in this region will spike well above 4 C and possibly has high as 5-6 C. Such an event would be even stronger than the one seen in 1997-98, drive global temperatures about 0.05 to 0.2 C hotter than previous records in a single year, and set off a series of extreme weather that, when combined with the already severe conditions set in place by human-caused warming, may well be far in excess of those seen during past events.
Links:
http://robertscribbler.wordpress.com/2014/03/25/monster-el-nino-emerging-from-the-depths-nose-of-massive-kelvin-wave-breaks-surface-in-eastern-pacific/

Friday, March 21, 2014

Unusually Intense El Nino May Lie Ahead, Scientists Say

by Andrew Freedman, Mashable, March 19, 2014
Since climate forecasters declared an "El Niño Watch" on March 6, the odds of such an event in the tropical Pacific Ocean have increased, and based on recent developments, some scientists think this event may even rival the record El Niño event of 1997-1998. If that does happen, then 2015 would almost be guaranteed to set a record for the warmest year on Earth, depending on the timing of the El Niño conditions.
El Niño and La Niña events refer to fluctuations in air and ocean conditions in the tropical Pacific. El Niño events are characterized by warmer than average sea surface temperatures in the central and eastern equatorial Pacific, and they add heat to the atmosphere, thereby warming global average temperatures. They typically occur once every 3 to 7 years and can also alter weather patterns around the world, causing droughts and floods from the West Coast of the U.S. to Papua New Guinea.
El Niño events tend to dampen hurricane activity in the North Atlantic, and some research has even linked El Niño events to civil conflicts in Africa.
When combined with global warming from greenhouse gas emissions and other sources, El Niño events greatly increase the odds that a given year will set a new global temperature record, as occurred in 1998.
Tony Barnston, the chief forecaster at Columbia University’s International Research Institute for Climate and Society (IRI), told Mashable that the odds of an El Niño event developing during the next six months have increased to about 60%, which is up from just over 50% on March 6.

Sea Surface Temperature Anomalies

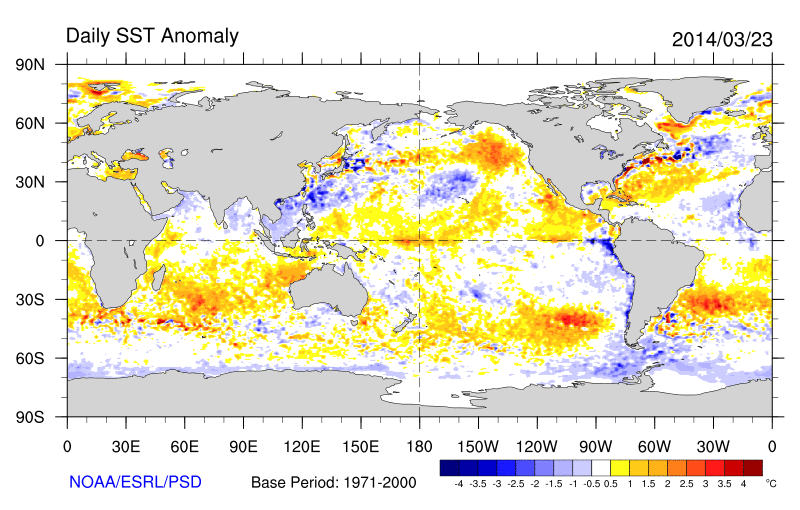
Global sea surface temperature anomalies, showing milder than average conditions in parts of the tropical Pacific. IMAGE: NOAA.

The Pacific Ocean exists in a constant state of unease, like an ocean badly in need of a mood stabilizer. Trade winds blow along and to the north of the equator from east to west, piling up warm ocean waters in the western Pacific, and causing sea levels to be higher in the west than they are in the east. Like a tipping bathtub, this setup can quickly be reversed with a reversal in trade winds and a sloshing of the warm sea surface temperatures from the western Pacific to the east, first at depth in a series of undersea waves known as Kelvin waves, and next toward the surface as the warm waters rise off the west coast of South America.
This complex chain of events, in which the atmosphere and the ocean act in concert to set up El Niño conditions, is well under way now. Starting in January of this year, there have been a series of strong bursts of winds coming out of the west in the equatorial tropical Pacific, and these have essentially replaced the typical easterly trade winds.
Partly as a result of these wind bursts, ocean buoys and satellites have detected the movement of unusually warm ocean waters from the western Pacific to the east. Ocean surface currents, which normally move westward across the Pacific basin, have reversed as well. El Niño forecasters have taken this as a further sign of a developing El Niño, and these conditions were a key reason why an El Niño Watch was issued on March 6.
Eric Blake, a hurricane specialist at NOAA’s National Hurricane Center in Miami, said conditions are changing rapidly in the Pacific, going from 50/50 odds of an El Niño, to a setup that eerily resembles the circumstances that preceded the monster El Niño of ‘97-'98.
“It’s something we haven’t really seen since the '97 El Niño,” Blake said of the westerly wind bursts and ocean observations. Instead of having trade winds blowing from the east at five to 10 mph, some locations in the western Pacific have had winds from the west blowing at up to 30 miles per hour, Blake says. This is important because it has ripple effects on the sea and below the sea surface.
“[It’s] not that we can’t step away from it, but with each passing day [an El Niño event is] becoming more likely,” Blake told Mashable.
Paul Roundy, a meteorology professor at the University at Albany, State University of New York, said that the westerly wind bursts have been extremely strong compared to historical records. Two of these events in particular, Roundy says, “were of similar amplitude to the events that preceded the 1997 El Niño.”
In addition, the warm waters moving eastward under the surface have been measured as much as nine degrees Fahrenheit above average, which is greater than similar waves observed prior to the 1997 El Niño event. “The present event is actually bigger than it was in 1997,” said Roundy.
Roundy cautioned that this doesn’t necessarily mean that the current event will be stronger than 1997-98 was, but it does raise red flags.


Wind patterns in the next two months will help determine whether an El Niño actually forms, and how strong it becomes. For example, even a temporary reversal of trade winds back to more typical conditions could dampen the eastward moving wave of warm water. So far, though, this hasn’t happened.
“Instead of switching to easterly winds there’s been an actual continuation of westerly winds,” Roundy said.
One problem that forecasters encounter when trying to foresee the likelihood and intensity of El Niño events is that there is limited historical data of the vast Pacific Ocean. Observational data only dates back to about 1990, Roundy says.
Making matters more difficult for forecasters is the recent degradation of a crucial buoy network used for El Niño and La Niña monitoring. Budget cuts have led to missing data, with the network known as the Tropical Atmosphere Ocean Project, or TAO array, operating at just 30 to 40% percent of capacity (see figure below).
TAO Status

Map showing the TAO buoys, with buoys reporting recent data colored in yellow and those without recent data in red. IMAGE: NATIONAL DATA BUOY CENTER

Roundy said the chances of an unusually strong El Niño event “Are much higher than average, it’s difficult to put a kind of probability of it … I’ve suggested somewhere around 80%”
“The conditions of the Pacific ocean right now are as favorable for a major event as they were in march of 1997. That’s no major guarantee that a major event develops but clearly it would increase the likelihood of a major event occurring,” Roundy says.
Barnston said any similarities of current conditions in the Pacific to those seen before the 1997-98 El Niño are an insufficient basis for forecasting an intense event. “As for the strength of the event, it is not known. Just seeing similarities with 1997 is not enough to go on," Barnston told Mashable in an email. "Unless we continue to get westerly wind events in the coming weeks, there is no guarantee that it will be a big event, and there is a 40% or so chance we will not get an El Niño at all,” he told Mashable in an email.
Roundy and Blake also urged caution about concluding that an El Niño event is nearly certain to occur, and that it will be intense. Rather, Blake said, the situation bears close watching.
“Anytime you have a non-negligible chance of something extreme happening, and you see it happening in a way that you haven’t seen in 15 to 20 years, it’s interesting,” says Blake.

Friday, March 7, 2014

Is the Mother of All Super El Ninos coming at us? Too soon to say. Let's hope not.

NOAA: El Nino watch for later this year

by Peter Sinclair, climatecrocks.com, March 6, 2014

Published on March 6, 2014
WeatherNationTV Chief Meteorologist Paul Douglas goes over the El Nino forecast issued from NOAA. How does this set up compare to previous El Ninos? And what can we expect from the long range forecasts? Will this help or hurt the historic drought situation across the West?

More as this develops.  Nobody knowledgeable is calling this for certain, but equally nobody looks forward to the effects of a strong El Nino.

In a bulletin issued this morning, NOAA issued an El Niño Watch predicting a roughly 50% chance for development later this year. An “El Niño” is the abnormal warming of ocean temperatures in the eastern Pacific Ocean along the west coast of South America near Peru and Ecuador. It can have profound influences on weather patterns around the world. 
NOAA’s bulletin says “sea surface temperature anomalies have recently increased near the International Date Line” as well as “in the central and east-central equatorial Pacific,” and that “many dynamical models predict El Niño to develop during the summer or fall.” 
El Niño conditions are declared when the average sea surface temperatures in the eastern Pacific are at least 0.5°C above average for three consecutive months. These abnormally elevated sea surface temperatures allow for the atmosphere to warm and provide instability, leading to the development of thunderstorm activity.
Despite the predictions and the issuance of an El Niño Watch, NOAA cautions that there is still “considerable uncertainty” in the models as to whether or not an El Niño will actually develop. Discerning weather observers will remember that the last predicted El Niño in 2012 turned out to be a bust. 
All in all, NOAA’s current forecast indicates that there is a 50/50 chance for an El Niño to form later this year, and as with any long-range forecast, significant uncertainties exist that warrant careful caution and observation.

Figure 1. Depth-longitude section of the departure of ocean temperature from average over the equatorial Pacific upper ocean between 0–300 meters between 5° S and 5° N during the period February 25–March 1, 2014. Averages are taken from a 1981–2010 base period. While surface temperatures in the Eastern Pacific were near average to cooler than average, a strong eastwards-propagating Kelvin wave with temperatures up to 6 °C (11 °F) above average at a depth of about 160 meters was headed towards the Eastern Pacific. If unusually strong westerly winds continue over the equatorial Western Pacific during March and April, this Kelvin wave has the potential to trigger a strong El Niño event over the Eastern Pacific later this year. Image credit: NOAA/CPC.
The potential El Niño event has been made more likely over the past month due to the intensification of a strong “Westerly Wind Burst” (WWB) along the equatorial Pacific west of the Date Line. As of March 6, 2014, westerly winds that were more than 10 m/s (22 mph) stronger than average had developed between 140°–150° E, just north of New Guinea. These unusually strong westerly winds were acting to push warm water piled up to the east of the Philippines eastwards towards South America. 
The “Westerly Wind Burst” was due, in part, to the counter-clockwise circulation of wind around Typhoon Faxai, which became a tropical storm on February 28 near 9° N, 149° E, and later intensified into a Category 1 typhoon. The Madden Julian Oscillation (MJO), a pattern of increased thunderstorm activity near the Equator that moves around the globe in 30–60 days, was also likely involved in amplifying the WWB. In order to keep the momentum of this WWB going and trigger a full-fledged El Niño event, some additional west-to-east push of winds is likely needed during March and April. Some extra push may come from a tropical disturbance (96P) that has developed this week south of the Equator near 13° S, 153° E, to the northeast of Australia. 
The clockwise circulation of air around this storm is bringing increased westerly winds to the Equator in the region of the WWB, and the Joint Typhoon Warning Center is giving this disturbance a “medium” chance of developing into a tropical depression or tropical storm by Friday. The GFS and European models predict that this storm will move southwards and bring heavy rain to the Queensland province of Australia over the weekend.

Figure 2. Departure of the 5-day average west-to-east blowing wind (the “zonal” wind) from average, averaged along the Equator, between 2° S and 2° N. A strong “Westerly Wind Burst” (WWB) formed in January 2014 near 140° E, and has intensified and propagated eastwards along the Equator. As of March 6, 2014, westerly winds that were more than 10 m/s (22 mph) stronger than average had developed. Image credit: NOAA/PMEL.
Link: http://climatecrocks.com/2014/03/06/noaa-el-nino-watch-for-later-this-year/

Wednesday, July 21, 2010

Mass transport induced by internal Kelvin waves beneath shore-fast ice, by Eivind Støylen & Jan Erik H. Weber, J. Geophys. Res., 115 (2010)

Journal of Geophysical Research, Vol. 115, C03022, 9 pp., 2010; doi: 10.1029/2009JC005298


Mass transport induced by internal Kelvin waves beneath shore-fast ice

Eivind Støylen and Jan Erik H. Weber
Department of Geosciences, University of Oslo, Oslo, Norway

Abstract

A one-layer reduced-gravity model is used to investigate the wave-induced mass flux in internal Kelvin waves along a straight coast beneath shore-fast ice. The waves are generated by barotropic tidal pumping at narrow sounds, and the ice lid introduces a no-slip condition for the horizontal wave motion. The mean Lagrangian fluxes to second order in wave steepness are obtained by integrating the equations of momentum and mass between the material interface and the surface. The mean flow is forced by the conventional radiation stress for internal wave motion, the mean pressure gradient due to the sloping surface, and the frictional drag at the boundaries. The equations that govern the mean fluxes are expressed in terms of mean Eulerian variables, while the wave forcing terms are given by the horizontal divergence of the Stokes flux. Analytical results show that the effect of friction induces a mean Eulerian flux along the coast that is comparable to the Stokes flux. In addition, the horizontal divergence of the total mean flux along the coast induces a small mass flux in the cross-shore direction. This flux changes the mean thickness of the upper layer outside the trapping region and may facilitate geostrophically balanced boundary currents in enclosed basins. This is indeed demonstrated by numerical solutions of the flux equations for confined areas larger than the trapping region. Application of the theory to Arctic waters is discussed, with emphasis on the transport of biological material and pollutants in nearshore regions. 

Received 22 January 2009; accepted 28 October 2009; published 26 March 2010.

Støylen, E., & J. E. H. Weber (2010), Mass transport induced by internal Kelvin waves beneath shore-fast ice, J. Geophys. Res., 115, C03022; doi: 10.1029/2009JC005298. 

Monday, April 12, 2010

El Nino renewed by Kelvin waves

Kelvin Wave Renews El Niño

NASA's Earth Observatory, March 21, 2010.  Click on this link to see full graphic:
Kelvin Wave Renews El Niño
Color bar for Kelvin Wave Renews El Niño
  acquired January 15, 2010 - February 15, 2010
download large January 15th image (411 KB, PNG) acquired January 15, 2010
download large January 30th image (416 KB, PNG) acquired January 30, 2010
download large February 15th image (416 KB, PNG) acquired February 15, 2010
download animation (2 MB, QuickTime) acquired December 1, 2009 - March 4, 2010

The climate pattern known as the El Niño-Southern Oscillation, or “ENSO” for short, is the biggest cause of large-scale climate variability in the tropics. During an El Niño episode, the central and eastern Pacific Ocean are warmer than normal. The above-normal sea surface temperatures are maintained by gentle but giant waves of warm water that slosh across the Pacific from Indonesia toward South America.

This series of globes shows the eastward progression of one of these deep Kelvin waves in February 2010. The globes show sea surface height anomalies, which means places where the water surface is higher (red) or lower (blue) than average. A higher-than-average sea surface height at a given location indicates that there is a deeper-than-normal layer of warm water. Lower-than-average sea surface height indicates a shallower layer of warm water. The globes are based on 10 days of data centered on January 15, January 30, and February 15, 2010.

In January (left-hand globe), sea surface heights across the central and eastern equatorial Pacific were elevated (red), but not extremely so, potentially a sign that El Niño was weakening. But in early February, a strong sea level anomaly appeared northeast of Australia (center globe). This swell of deep, warm water is the start of the Kelvin wave, and by late February, it had spread eastward into the central Pacific (right-hand globe) and re-invigorated the current El Niño.

Where do Kelvin waves come from? Under normal conditions, the tropics’ prevailing easterly winds push Sun-warmed surface waters across the Pacific from the Americas toward Indonesia, creating a deep pool of warm water in the western Pacific. During an El Niño, the trade winds falter, and sometimes even reverse, for months. When the winds that maintain the warm pool falter, a large pulse of warm water from the western Pacific slides back toward the east. The most current sea surface height images are available on the JASON mission sea level Webpage.

Link:  http://earthobservatory.nasa.gov/IOTD/view.php?id=43105