Blog Archive

Showing posts with label Julienne Stroeve. Show all posts

Saturday, October 4, 2014

Nick Breeze: [Gavin Schmidt] Tweeting on Thin Ice - Reflecting on the Arctic Sea Ice Meeting at the Royal Society

by Nick Breeze, Envisionation, September 30, 2014

When it comes to changes in the global climate, one of the most visible and disturbing sites is the data that shows the diminishing state of sea ice in the Arctic region. It is both dramatic and symbolic, with known and unknown consequences. As someone who has been following the scientific literature on this for a few years now, I cannot help feeling that our collective societies, and especially those with real power, will rue the days they turned their backs on this dynamic and important component of our climate.
With this in mind, I was positively excited to attend the two-day event at the Royal Society on the 22nd and 23rd of September, titled, ‘Arctic sea ice reduction: the evidence, models, and global impacts.’ The list of scientists attending read like a dream team of big brains on Arctic sea ice matters:

Dr Julienne Stroeve, University of Colorado, USA; Reduction of summer sea ice extent
Professor Mark Serreze, National Snow and Ice Center, USA; Changes in Arctic sea ice and the polar atmosphere
Professor Peter Wadhams, University of Cambridge, UK; Sea ice thickness from submarines
Professor Ronald Kwok, Jet Propulsion Laboratory, CALTECH, USA; Satellite observations of sea ice thickness
Dr Andrey Proshuntinsky, Woods Hole Oceanographic Institution, USA; Arctic circulation regimes
Dr Helene Hewitt, Met Office Hadley Centre, UK; Using models to understand and predict Arctic Sea Ice
Professor John Turner, British Antarctic Survey, UK; Why is sea ice increasing in the Southern Ocean?
Dr Marika Holland, National Center for Atmospheric Research, USA; The capabilities and limitations of Arctic sea ice ocean climate models
Professor Daniel Feltham, University of Reading, UK; Sea ice mechanics and the next generation of sea ice physics
Dr Dirk Notz, Max Planck Institute for Meteorology, Germany; Processes controlling the Arctic sea ice mass balance
Professor Don Perovich, Dartmouth College, USA; Field studies of sea ice melt
Professor Grae Worster, University of Cambridge, UK; Sea ice thermodynamics and brine drainage
Dr Gavin Schmidt, NASA, USA; Atmospheric composition and radiative impacts of Arctic sea ice loss
Professor Jennifer Francis, Rutgers University, USA; The impact of Arctic sea ice loss on extreme weather
Dr Sheldon Bacon, National Oceanography Centre, UK; The Arctic Ocean freshwater budget and implications for climate
One of the most striking debates in the discussion of Arctic sea ice is the rate of loss and risk of feedbacks, such as large-scale methane release. The large-scale methane releases are a feature of the Earth’s history, where huge amounts of this deadly gas are released at a rate where they cannot be broken down, and therefore overwhelm the atmosphere. This heating effect, in turn, creates amplified heating making it difficult for life to survive. It is estimated that when the last big methane burst occurred, millions of years ago, 90% of life on Earth died and the recovery rate for biodiversity was millions of years more.
Russian scientist’s, Dr Natalia Shakhova and Dr Igor Semilitov have been conducting annual trips to the East Siberian Arctic Shelf for over ten years and are reporting an increased destabilisation of the permafrost on the shallow Arctic ocean floor in the region. The loss of ice has meant that significant heating has occurred this sensitive region, causing the frozen seabed to rise from -7 degrees centigrade to between -1 C and +3 C. Obviously, above zero, the seabed changes state from ice to water and releases methane from the rotting organic debris that has been frozen for thousands, or millions of years.
More importantly, this permafrost layer acts as a seal over an enormous store of methane hydrates conservatively estimated to be around 1,500 gigatonnes. To put this in perspective, there is currently about 5.5 gigatonnes of methane in the Earth’s atmosphere. A release of a small percentage of 50 gigatonnes has been cited as a risk. Wadhams and his colleagues used the Stern model to calculate that such a release would have the equivalent economic value of $50 trillion USD (roughly the same as global GDP). That is obviously much more than we could ever afford and the world, post-release, would look vastly different, with hardly any humans, or other species, remaining compared to what we see today.
Professor Wadhams gave his talk at the Royal Society focusing on the behaviour of sea ice, using submarine data to back up previous estimates of sea ice decline in volume over multi decades. As these are observations, it is not really something that can be contested. Wadhams has been going on trips to the Arctic aboard military submarines for many years, collecting data to feed into the models, calculating volume in addition to the ice area (extent) shown from the satellites. This has shown a dramatic drop in sea-ice volume by 40% since the late 1970s. The implications are that we are risking setting off a feedback process of methane release that could cause a huge boost to global warming. That is the view from those collecting data from the region.
On the other side of the debate stands the modellers. David Archer (not present at the event) is referred to as the “go to man” on Arctic methane. Archer says that no risk is posed from methane releases from Arctic shelves such as the one in Eastern Siberia. To represent this view at the Royal Society meeting was Dr Gavin Schmidt, the newly positioned Director of NASA’s Goddard Institute For Space Studies. Dr. Schmidt presented his modelling data, positing that there is no evidence such a risk exists. This is as a result of his examination of the data record of the Holocene period; a period of climate stability in which we and many other species have flourished. There are other scientists who look at our unprecedented climate situation and conclude that this is the beginning of the “Anthropocene”; a period of climate driven by human activity.
Schmidt does acknowledge there was a huge methane release way back in the geological record but states that the world was a very different place then and we cannot draw conclusions from it. Schmidt’s view is based much more on modelling data and theory, which is viewed with suspicion by some, due to the inability of the models to keep pace in real-time with the rapid decline of Arctic sea ice. The argument goes that if you cannot get the model to reproduce what is happening today, how can you draw conclusions of what the sea ice will do in 10, 20 or 100 years? All scientists use models, and they are very useful in looking at climate and their results are always getting better, as both the technological capacity, and the scientists understanding of Earth system processes gets better.
Dr Schmidt’s presentation was especially crafted to dispel the idea of a risk from methane releases and to directly discredit the work of Shakhova et al. Even when he mentioned the word methane, he did so encouraging the audience to make horror noises. This seems to me a thoughtless act, considering people are risking their lives to collect the data on the subject. I interviewed Shakhova in June and she gave examples of other expeditions that have had fatal outcomes for those involved. Also, considering Professor Wadhams was sat in the audience and held a different view, it seemed divisive and childish. Schmidt presented in his summary that there was no risk of a methane “bomb,” or other large-scale multi-gigatonne release from hydrate stores in the Arctic.

Although he didn’t explicitly say it, the implication was that the work of those saying “there is a risk” is rubbish. He showed models developed by Archer to prove it. However, I failed to draw a similar conclusion as Schmidt, because the scientists telling us there IS an issue, are the only ones actually visiting the region and collecting data. Shakhova said in June, when we spoke, that a decade ago there were hardly any bubbles coming out, and the ice pack on top was frozen solid. They could drive heavy vehicles out on the ice. Due to global warming, it has vanished, and now the dark open water is absorbing the sun's heat energy, and the waves that occur during intensifying storms (a new phenomenon for the Eastern Siberian Arctic Shelf) are transporting this heat down to the seabed, where the melting occurs. Thus, their observations show plumes of methane pouring off the seabed, from melting permafrost and over a kilometre wide.
The opposing views portended to set up a scenario for great discussion and perhaps, potentially, collaboration on how scientists could move forward to get to the bottom of what is happening in the volatile polar region. However, what really transpired was that Dr Schmidt was not that interested in any serious consideration of views outside those of his colleagues and had come here to only try and discredit what he might call “opponents.” Even when Professor Wadhams asked him a serious question at the end of his presentation, about what sea water temperature data is feeding Archer’s model (as it was being shown as evidence), he simply replied that “it’s [the answer] in the paper.” Conversely, when Wadhams was on the stage, Schmidt only raised his hand to ask “Is any of this based on physics?” to which Wadhams replied “no,” referring to the fact that it is collected, observational data.
Although having two opposing camps adds a bit of flavour to the proceedings, what soured the taste afterwards was Schmidt’s insulting tweeting during Wadhams' presentation. Probably aware that an older professor is not so likely to be microblogging during a serious conference on his main subject of expertise, Schmidt released the following tweets in reference to him:

"Some anticipation for Peter Wadhams. Audience members already crying," "Wadhams still using graphs with ridiculous projections with no basis in physics," "Wadhams now onto methane pulse of 50 GT. But no better justified than his previous statements," and "Wadhams clearly states that there is no physics behind his extrapolations.”
There is no doubt that such “tweets” must resonate with his own choir of over 5,800 followers on Twitter, but does it add anything whatsoever to the meeting in the room? In terms of credibility alone, it should be highlighted that Wadhams has been studying the sea ice for over 40 years and published over 300 papers on the subject. He has made countless voyages to both polar regions and even the Prime Minister of the day, Margaret Thatcher was heard to shout out in Downing Street, “Dennis… The ICE MAN is here!”, having previously telephoned him during an expedition to the Antarctic ahead of a conference in the 1980s. Even if Professor Wadhams was not a person of such high stature, Dr Schmidt’s treatment of him does sully a framework for finding answers to serious questions that science has always been so good at. It undermines the purpose of the meeting hosted by the Royal Society and also the reputation of his current position at Goddard (a position held by one of the most excellent and modest of climate experts we have seen, James Hansen, whom I was fortunate to meet and interview in 2012).
To conclude, the opportunity to discuss in depth the opposing views was squandered in place of a shallow and degrading barrage of Tweets. These were designed to undermine and dismiss a growing field of research that is being published around the world by many institutions, such as the United Nations Environment Programme, as well the peer-reviewed literature. Instead of an arena of informed and intellectual discussion, this behaviour is more akin to playground politics blended with egotistical nastiness.
On a completely different level altogether, one major triumph of the event was the presentation given by Professor Jennifer Francis from Rutgers University, USA, titled, ‘The impact of Arctic sea ice loss on extreme weather.’ Francis has been regularly cited by the mainstream media in recent months when we have experienced extreme weather events.  Her teams work has produced evidence linking the decline in Arctic sea ice to the changes in the oscillation of the jet stream, that delivers our weather and is now being affected by man-made climate change. Such work has been picked up by President Obama’s Chief Science Advisor, Dr John Holdren who is thus briefing the President. I was lucky enough to catch up with Professor Francis later in the week and conduct an interview. We’ll be posting this very shortly.

Wednesday, April 2, 2014

NOAA Arctic Sea Ice Report of April 2, 2014

Arctic sea ice at fifth lowest annual maximum

Arctic sea ice reached its annual maximum extent on March 21, after a brief surge in extent mid-month. Overall the 2014 Arctic maximum was the fifth lowest in the 1978 to 2014 record. Antarctic sea ice reached its annual minimum on February 23, and was the fourth highest Antarctic minimum in the satellite record. While this continues a strong pattern of greater-than-average sea ice extent in Antarctica for the past two years, Antarctic sea ice remains more variable year-to-year than the Arctic.

Overview of conditions

Figure 1. Arctic sea ice extent for March 2014 was 14.80 million square kilometers (5.70 million square miles). The magenta line shows the 1981 to 2010 median extent for that month. The black cross indicates the geographic North Pole.  Sea Ice Index data. About the data||Credit: National Snow and Ice Data Center|High-resolution image
Figure 1. Arctic sea ice extent for March 2014 was 14.80 million square kilometers (5.70 million square miles). The magenta line shows the 1981 to 2010 median extent for that month. The black cross indicates the geographic North Pole. Sea Ice Index data. About the data.
Credit: National Snow and Ice Data Center
High-resolution image
Arctic sea ice extent for March 2014 averaged 14.80 million square kilometers (5.70 million square miles). This is 730,000 square kilometers (282,000 square miles) below the 1981 to 2010 average extent, and 330,000 square kilometers (127,000 square miles) above the record March monthly low, which happened in 2006. Extent remains slightly below average in the Barents Sea and the Sea of Okhotsk, but is at near-average levels elsewhere. Extent hovered around two standard deviations below the long-term average through February and early March. The middle of March by contrast saw a period of fairly rapid expansion, temporarily bringing extent to within about one standard deviation of the long-term average.

Conditions in context

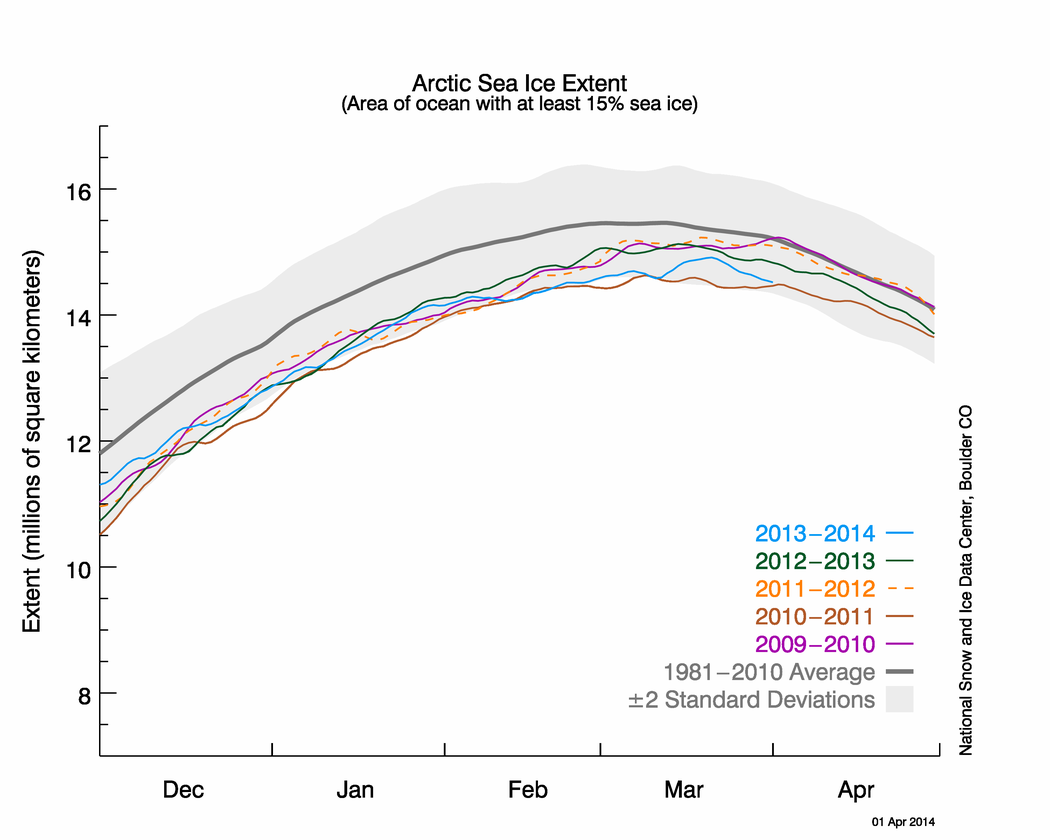
Figure 2. The graph above shows Arctic sea ice extent as of April 1, 2014, along with daily ice extent data for four previous years. 2013-2014 is shown in blue, 2012 to 2013 in green, 2011 to 2012 in orange, 2010 to 2011 in brown, and 2009 to 2010 in purple. The 1981 to 2010 average is in dark gray. Sea Ice Index data.||Credit: National Snow and Ice Data Center|High-resolution image
Figure 2. The graph above shows Arctic sea ice extent as of April 1, 2014, along with daily ice extent data for four previous years. 2013 to 2014 is shown in blue, 2012 to 2013 in green, 2011 to 2012 in orange, 2010 to 2011 in brown, and 2009 to 2010 in purple. The 1981 to 2010 average is in dark gray. Sea Ice Index data.
Credit: National Snow and Ice Data Center
High-resolution image
In the Arctic, the maximum extent for the year is reached on average around March 9. However, the timing varies considerably from year to year. This winter the ice cover continued to expand until March 21, reaching 14.91 million square kilometers (5.76 million square miles), making it both the fifth lowest maximum and the fifth latest timing of the maximum since 1979. The latest timing of the maximum extent was on March 31, 2010 and the lowest maximum extent occurred in 2011 (14.63 million square kilometers or 5.65 million square miles).
The late-season surge in extent came as the Arctic Oscillation turned strongly positive the second week of March. This was associated with unusually low sea level pressure in the eastern Arctic and the northern North Atlantic. The pattern of surface winds helped to spread out the ice pack in the Barents Sea where the ice cover had been anomalously low all winter. Northeasterly winds also helped push the ice pack southwards in the Bering Sea, another site of persistently low extent earlier in the 2013 to 2014 Arctic winter. Air temperatures however remained unusually high throughout the Arctic during the second half of March, at 2 to 6 degrees Celsius (4 to 11 degrees Fahrenheit) above the 1981 to 2010 average.

March 2014 compared to previous years

Figure 3. Monthly March ice extent for 1979 to 2014 shows a decline of X.X% per decade relative to the 1981 to 2010 average.||Credit: National Snow and Ice Data Center|  High-resolution image
Figure 3. Monthly March ice extent for 1979 to 2014 shows a decline of 2.6% per decade relative to the 1981 to 2010 average. Credit: National Snow and Ice Data Center. High-resolution image
Average ice extent for March 2014 was the fifth lowest for the month in the satellite record. Through 2014, the linear rate of decline for March ice extent is 2.6% per decade relative to the 1981 to 2010 average.

An increase in multiyear ice

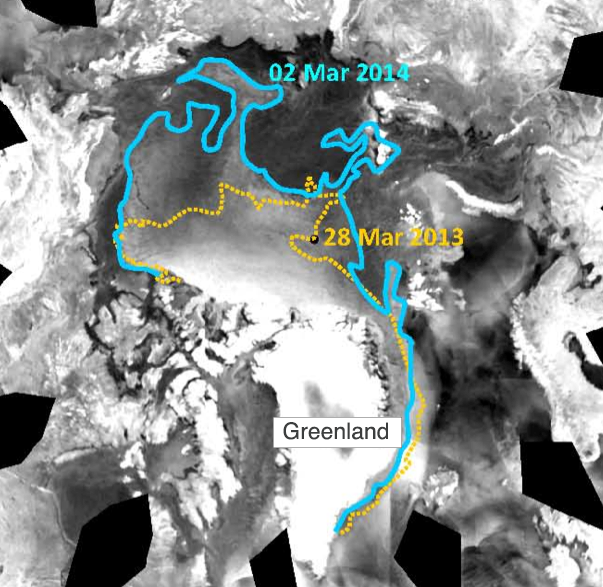
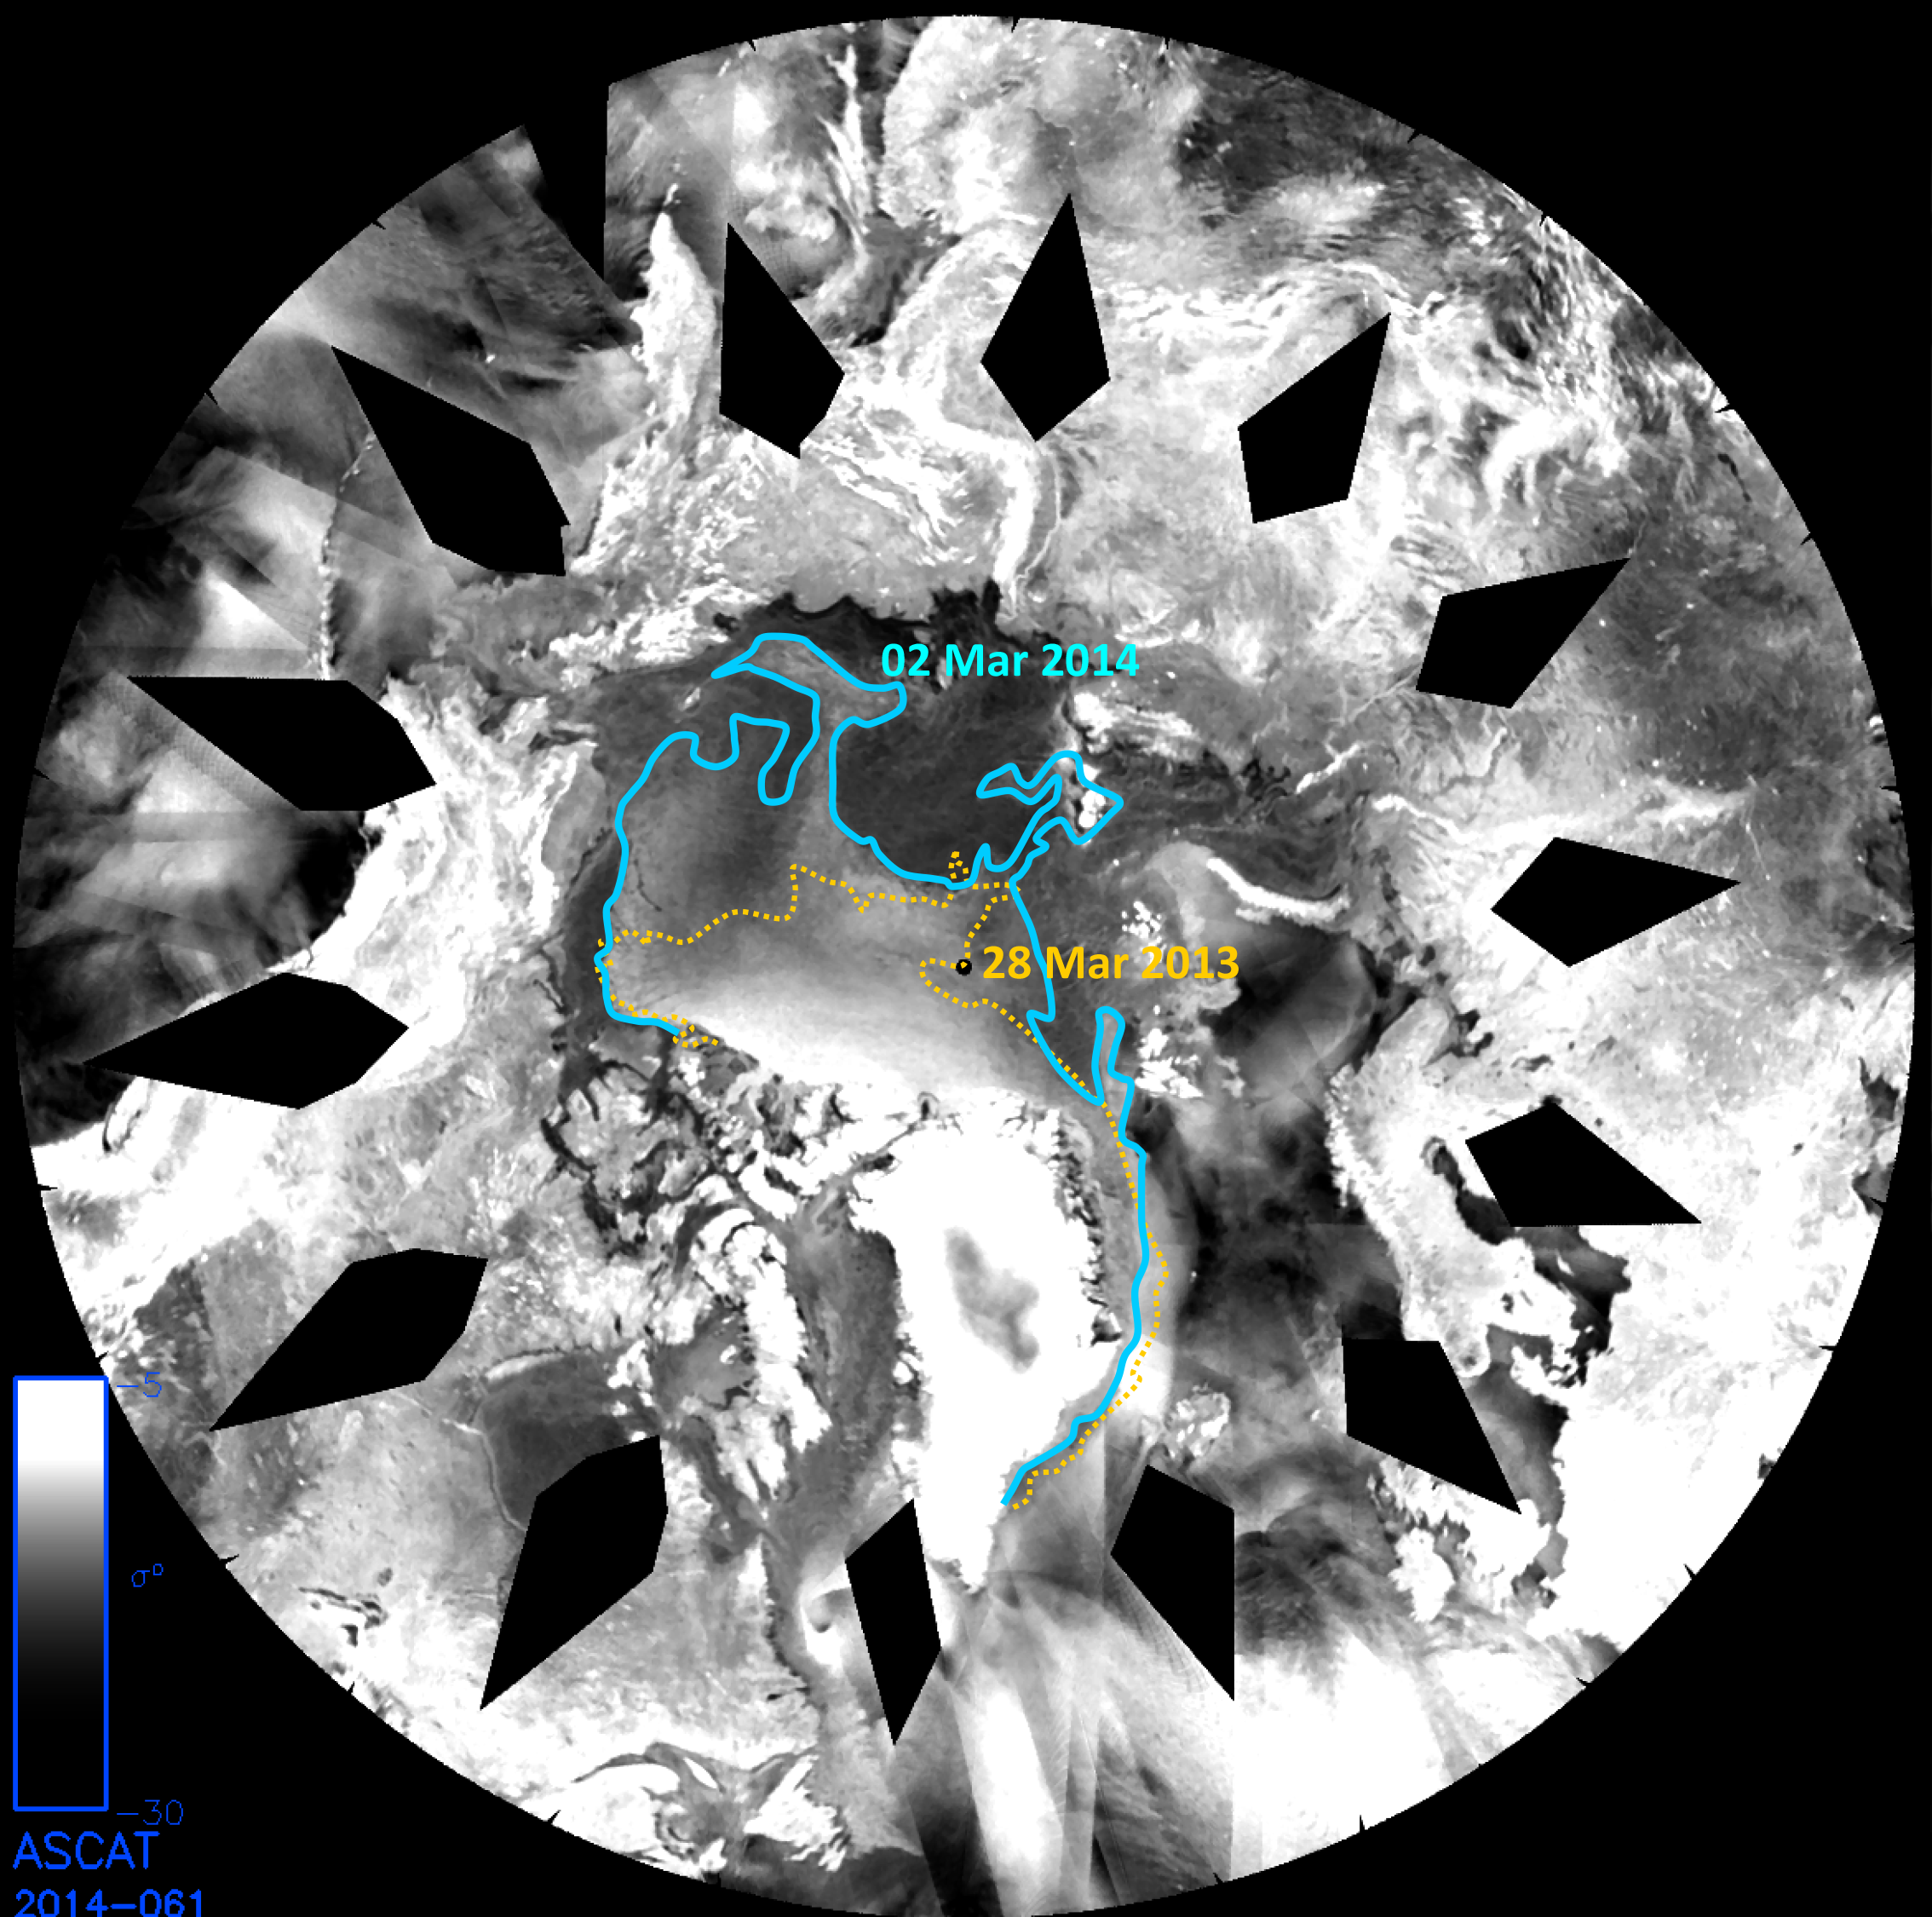
Figure 4. Imagery from the European Advanced Scatterometer (ASCAT) show the distribution of multiyear ice compared to first year ice for March 28, 2013 (yellow line) and March 2, 2014 (blue line). ||Credit: Advanced Scatterometer imagery courtesy NOAA NESDIS, analysis courtesy T. Wohlleben, Canadian Ice Service |  High-resolution image
Figure 4. Imagery from the European Advanced Scatterometer (ASCAT) show the distribution of multiyear ice compared to first year ice for March 28, 2013 (yellow line) and March 2, 2014 (blue line).
Credit: Advanced Scatterometer imagery courtesy NOAA NESDIS, analysis courtesy T. Wohlleben, Canadian Ice Service
High-resolution image
The extent of multiyear ice within the Arctic Ocean is distinctly greater than it was at the beginning of last winter. During the summer of 2013, a larger fraction of first-year ice survived compared to recent years. This ice has now become second-year ice. Additionally, the predominant recirculation of the multiyear ice pack within the Beaufort Gyre this winter and a reduced transport of multiyear ice through Fram Strait maintained the multiyear ice extent throughout the winter.
In Figure 4, Advanced Scatterometer (ASCAT) imagery reveals the distribution of multiyear ice compared to first year ice for March 28, 2013 (yellow line) and March 2, 2014 (blue line). The ASCAT sensor measures the radar–frequency reflection brightness of the sea ice at a few kilometers resolution. Sea ice radar reflectivity is sensitive to the roughness of the ice and the presence of saltwater droplets within newer ice (and, later in the season, the presence of surface melt). Thus older and more deformed multiyear ice appears white or light grey (more reflection), whereas younger, first-year ice looks dark grey and/or black.

Ice age tracking confirms large increase in multiyear ice


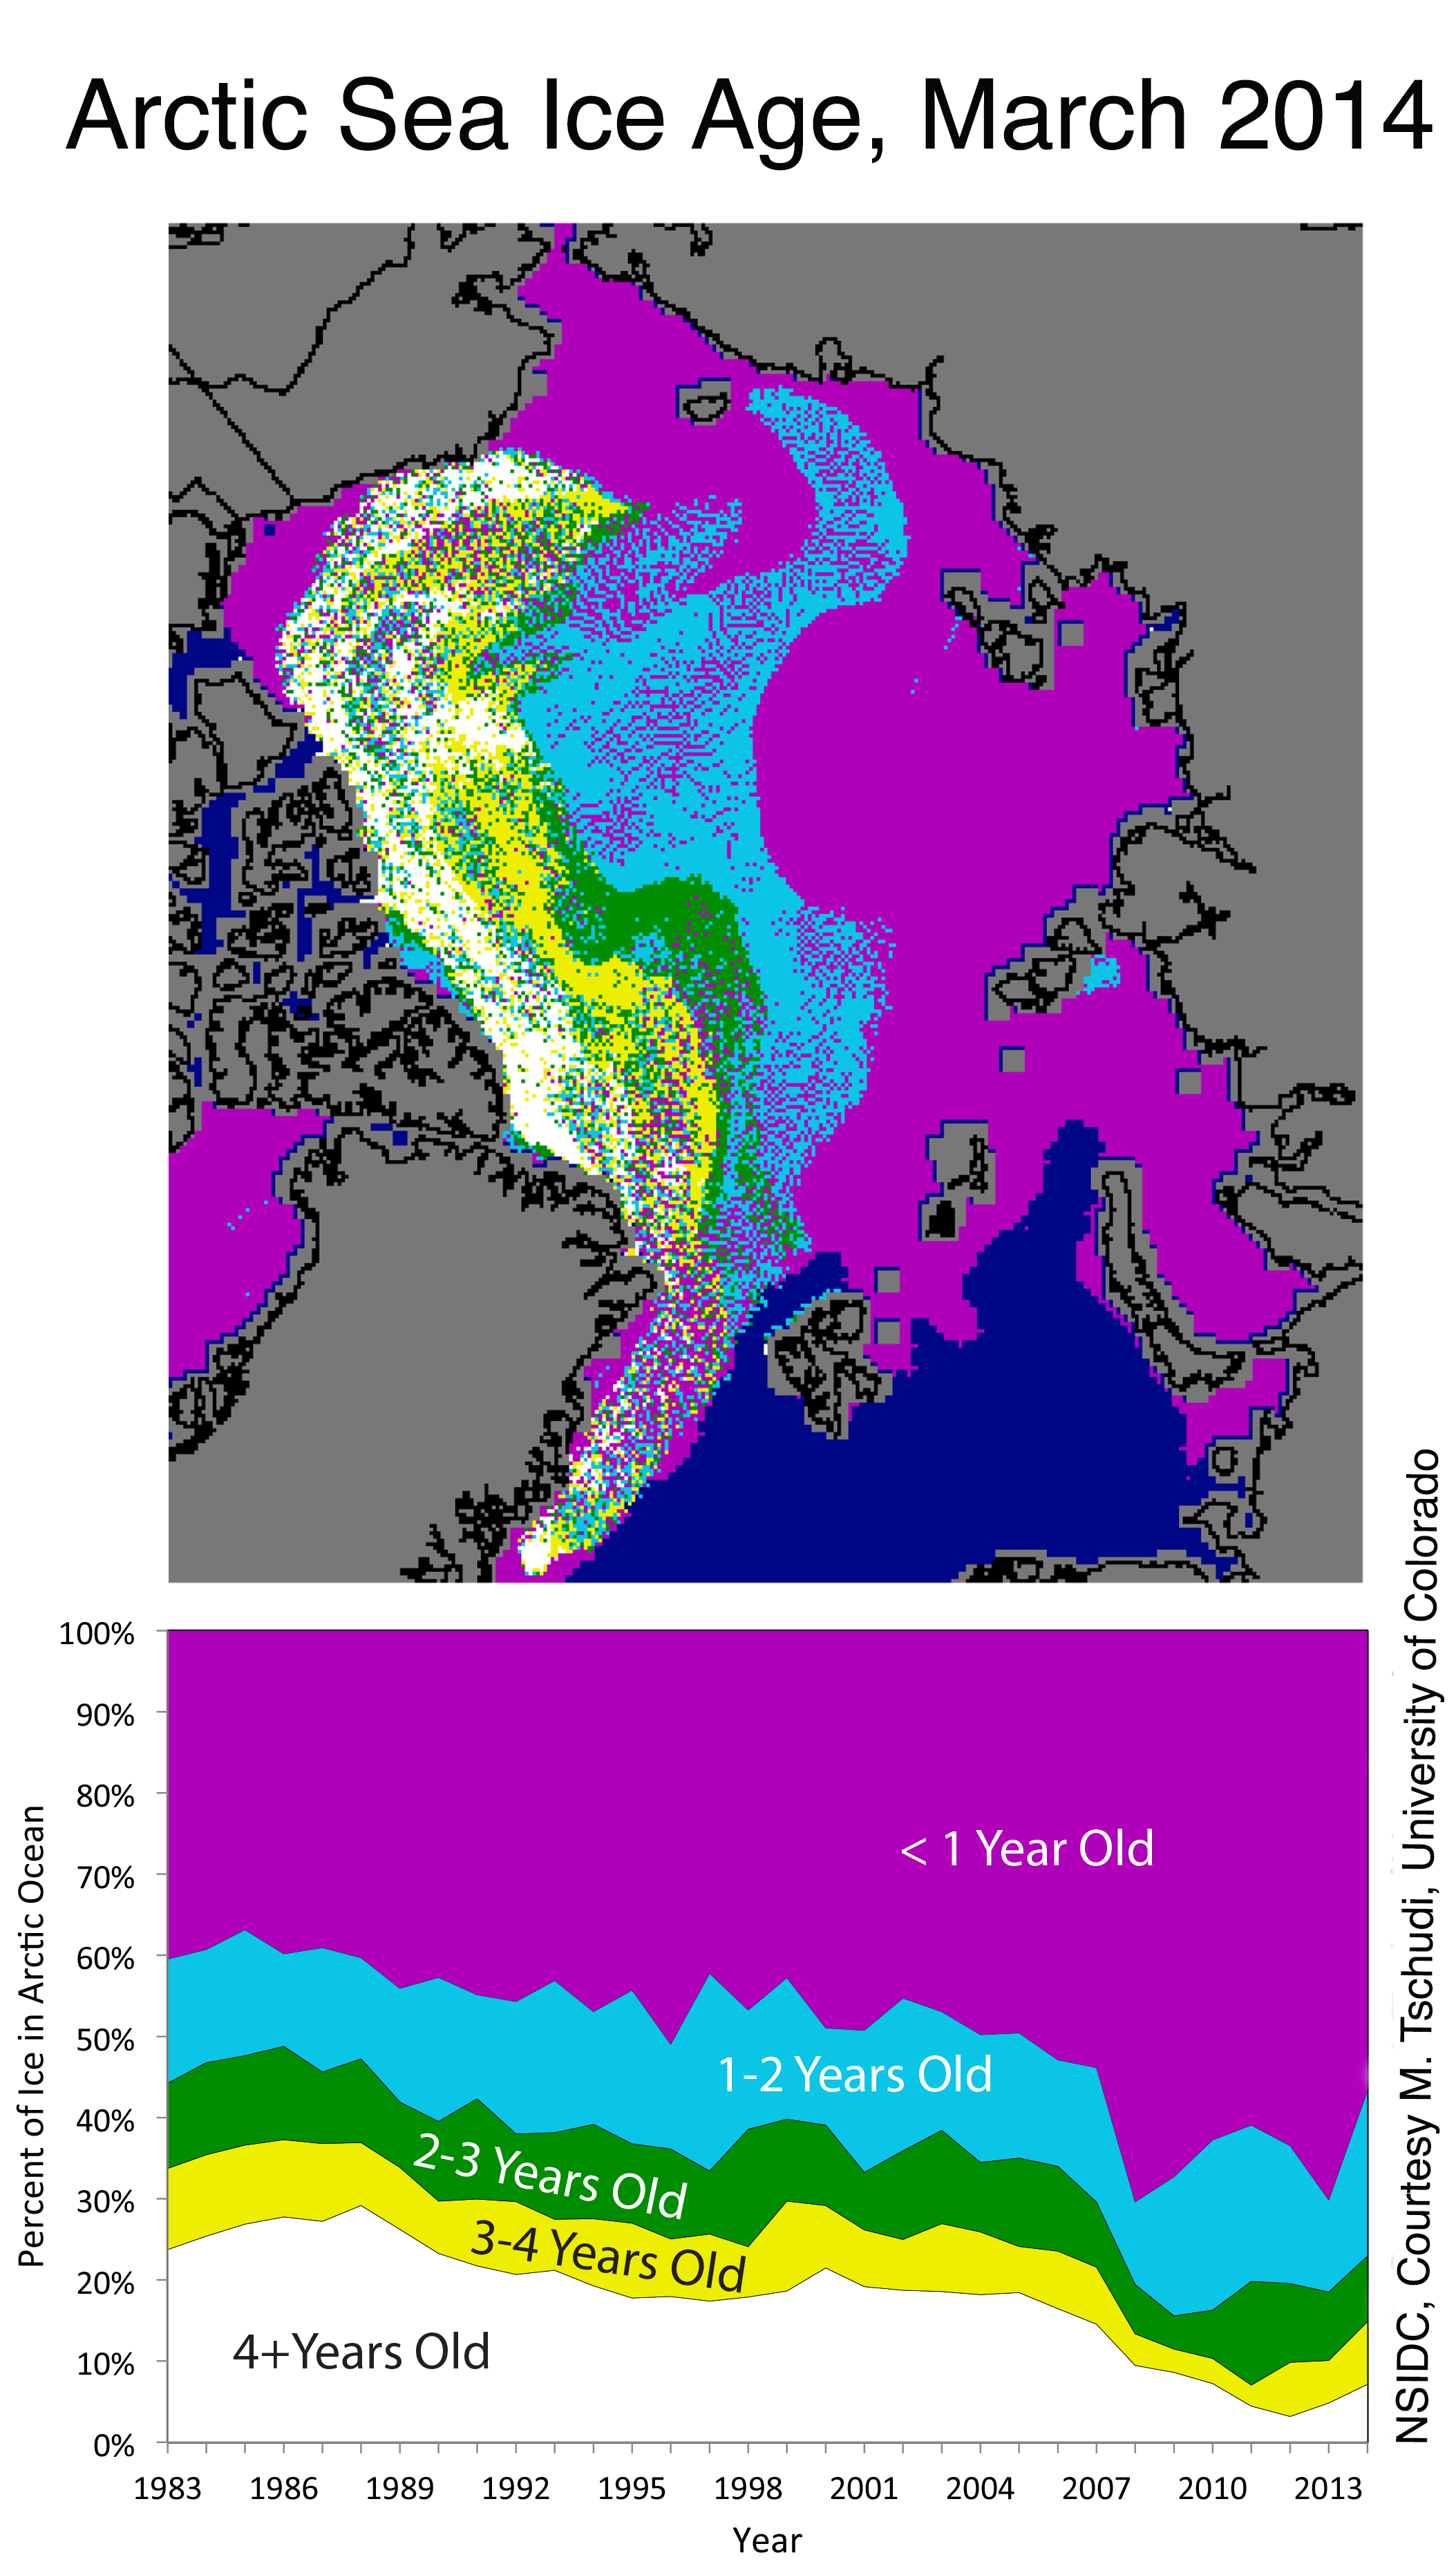
Figure 5. The map at top shows the ages of ice in the Arctic at the end of March 2014; the bottom graph shows how the percentage of ice in each age group has changed from 1983 to 2014.
Credit: NSIDC, Courtesy M. Tschudi, University of Colorado. High-resolution image
Satellite data on ice age reveal that multiyear ice within the Arctic basin increased from 2.25 to 3.17 million square kilometers (869,000 to 1,220,000 square miles) between the end of February in 2013 and 2014. This winter the multiyear ice makes up 43% of the icepack compared to only 30% in 2013. While this is a large increase, and may portend a more extensive September ice cover this year compared to last year, the fraction of the Arctic Ocean consisting of multiyear ice remains less than that at the beginning of the 2007 melt season (46%) when a large amount of the multiyear ice melted. The percentage of the Arctic Ocean consisting of ice at least five years or older remains at only 7%, half of what it was in February 2007. Moreover, a large area of the multiyear ice has drifted to the southern Beaufort Sea and East Siberian Sea (north of Alaska and the Lena River delta), where warm conditions are likely to exist later in the year.

Satellite Observations of Arctic Change

NSIDC now offers a new Web site, Satellite Observations of Arctic Change (SOAC)  with interactive maps of the Arctic based on NASA satellite and related data. The site allows you to explore how conditions in the Arctic have changed over time. Data sets include air temperature, water vapor, sea ice, snow cover, NDVI, soil freezing, and exposed snow and ice. Time periods vary by data set, but range from 1979 to 2013. You can animate a time series, zoom in or out, and view a bar graph of anomalies over time. Links to the source data and documentation are also included. Additional pages provide brief scientific discussion, and overviews of the scientific importance of these data. SOAC was developed with support from NASA Earth Sciences.

Reference

Stroeve, J., L. Hamilton, C. M. Bitz, and E. Blanchard-Wrigglesworth. 2014. Predicting September Sea Ice: Ensemble Skill of the SEARCH Sea Ice Outlook 2008–2013. Geophysical Research Letters, Accepted, doi: 10.1002/2014GL059388.

Tuesday, April 1, 2014

NASA: Arctic Melt Season Lengthening 5 days per decade

from NASA, April 1, 2014

A new study by researchers from the National Snow and Ice Data Center (NSIDC) and NASA shows that the length of the melt season for Arctic sea ice is growing by several days each decade. An earlier start to the melt season is allowing the Arctic Ocean to absorb enough additional solar radiation in some places to melt as much as four feet of the Arctic ice cap’s thickness.
"The Arctic is warming and this is causing the melt season to last longer," said Julienne Stroeve, a senior scientist at NSIDC, Boulder and lead author of the new study, which has been accepted for publication in Geophysical Research Letters. "The lengthening of the melt season is allowing for more of the sun’s energy to get stored in the ocean and increase ice melt during the summer, overall weakening the sea ice cover."
splash
A short video summarizes new findings about Arctic sea ice and warming oceans.  Play it!
Arctic sea ice has been in sharp decline during the last four decades. The sea ice cover is shrinking and thinning, making scientists think an ice-free Arctic Ocean during the summer might be reached this century. The seven lowest September sea ice extents in the satellite record have all occurred in the past seven years.
Auroras Underfoot (signup)
To study the evolution of sea ice melt onset and freeze-up dates from 1979 to the present day, Stroeve’s team used passive microwave data from NASA’s Nimbus-7 Scanning Multichannel Microwave Radiometer, and the Special Sensor Microwave/Imager and the Special Sensor Microwave Imager and Sounder carried onboard Defense Meteorological Satellite Program spacecraft. When ice and snow begin to melt, the presence of water causes spikes in the microwave radiation that the snow grains emit, which these sensors can detect.
Results show that although the melt season is lengthening at both ends, with an earlier melt onset in the spring and a later freeze-up in the fall, the predominant phenomenon extending the melting is the later start of the freeze season. Some areas, such as the Beaufort and Chukchi Seas, are freezing up between 6 and 11 days later per decade. Although melt onset variations are smaller, the timing of the beginning of the melt season has a larger impact on the amount of solar radiation absorbed by the ocean, because its timing coincides with when the sun is higher and brighter in the Arctic sky.
Despite large regional variations in the beginning and end of the melt season, the Arctic melt season has lengthened on average by 5 days per decade from 1979 to 2013.
Visit nasa.gov for more information about this research
Credits:
Production editor: Dr. Tony Phillips | Credit: Science@NASA

Thursday, September 20, 2012

Arctic Sea Ice Levels Hit Record Low, Scientists Say We're 'Running Out Of Time'

Arctic Sea Ice Melt
From left: Caroline Cannon, Inupiat leader and 2012 Goldman prize winner; K. Subramanya, chief executive officer at Tata BP Solar India Ltd.; Bryan Walsh, senior energy and environment writer for Time; Surendra Shrestha, regional director for Asia and the Pacific region of the UNEP; Bill McKibben, co-founder of 350.org, and Kumi Naidoo, executive director of Greenpeace International.

by Joanna Zelman and James Gerken, Huffington Post, September 19, 2012
As Arctic sea ice levels hit a new record low this month, scientists and activists gathered to discuss how to bridge the gap between scientific facts and the public's limited understanding that we are, in their words, "really running out of time."
The National Snow and Ice Data Center (NSIDC) released preliminary findings Wednesday suggesting that on Sept. 16, Arctic ice covered just 1.32 million square miles -- the lowest extent ever recorded. This minimum is 49 percent below the 1979 average, when satellite records began.
“The loss of summer sea ice has led to unusual warming of the Arctic atmosphere, that in turn impacts weather patterns in the Northern Hemisphere, that can result in persistent extreme weather such as droughts, heat waves and flooding,” NSIDC scientist Dr. Julienne Stroeve told Greenpeace in a press release.
Wednesday morning, a group of climate scientists and activists met at a Greenpeace International panel in New York to strategize on potential responses to the changing Arctic climate.
"There's a huge gap between what is understood by the scientific community and what is known by the public," NASA scientist James Hansen said, adding that he believed, "unfortunately, that gap is not being closed."
What the scientific community understands is that Arctic ice is melting at an accelerated rate -- and that humans play a role in these changes.
According to the panel, humans are "really running out of time" to prevent atmospheric carbon dioxide concentrations from reaching levels that would precipitate runaway climate change. Hansen warned that even maintaining current concentrations of approximately 390 parts per million for several centuries "guarantees disaster."
He attributed the rise in carbon dioxide concentrations largely to the burning of fossil fuels. "It's crystal clear. If we burn all the fossil fuels, we create certain disaster," he said.
Despite the fact that "we have a planetary emergency," Hansen explained, "It's hard for the public to realize, because they stick their head out the window and don't see much going on."
Having just witnessed climate change in action on an Arctic campaign, Greenpeace International head Kumi Naidoo professed, "I am shit scared." Despite the fact that the Arctic seems far away, Naidoo said, "What happens in the Arctic doesn't stay in the Arctic."
In order to appeal to the public, Naidoo said climate change language must become more relatable. For example, on a recent campaign, he changed a banner at the last minute from "Stop Arctic Destruction" to "Don't Destroy Our Children's Future."
Beyond altering language, 350.org founder Bill McKibben said engaging the younger generation is key. He explained the importance of limiting our fossil fuel "appetites" and pressuring the industry directly through student divestment campaigns and a fee and dividend mechanism.
"Because of [the fossil fuel industry's] wealth and political power, they've been able to remain the only industry on Earth that doesn't have to clean up after themselves. There's no price on carbon," McKibben later told HuffPost.
His proposal to increase the cost of carbon emissions -- one also advocated by Hansen -- would involve collecting a fee on all oil, gas and coal resources at the point of domestic extraction or their port of entry. A dividend would then be equally split among all legal residents, with none of the funds going to the government. McKibben and others argue that this market-based approach would promote innovation and awareness without increasing the size of government.
According to McKibben, the carbon fee must be high enough to keep 80% of known fossil fuel reserves in the ground.
Assessing the melting Arctic ice and other recent climate observations, McKibben noted, "The final irony is we're at the first moment in human history where we're able to see what's going on ... the question is whether we're going to do anything about it."

Arctic ice shrinks 18% against record, sounding climate change alarm bells


Scientists and environment groups say the fall is unprecedented and the clearest signal yet of global warming

by John Vidal, in Longyearbyen, Svalbard, The Guardian, September 19, 2012
Arctic melting ice : Icebergs, Disko Bay, Greenland
"Our response [so far] has not been alarm, or panic, or a sense of emergency. It has been: ‘Let’s go up there and drill for oil.’ There is no more perfect indictment of our failure to get to grips with the greatest problem we’ve ever faced," says author and environmental campaigner Bill McKibben. Photograph: Paul Souders/Corbis

Sea ice in the Arctic shrank a dramatic 18% this year on the previous record set in 2007 to a record low of 3.41 million sq. km, according to the official US monitoring organisation the National Snow and Ice Data Centre in Boulder, Colorado.
Scientists and environment groups last night said the fall was unprecedented and the clearest signal yet of climate change.
The data released showed the arctic sea beginning to refreeze again in the last few days after the most dramatic melt observed since satellite observations started in 1979.
This year's sea ice extent was 700,000 sq. km below the previous minimum of 4.17 million sq. km set in 2007.
"We are now in uncharted territory," said NSIDC director Mark Serreze. "While we've long known that as the planet warms up, changes would be seen first and be most pronounced in the Arctic, few of us were prepared for how rapidly the changes would actually occur."
Julienne Stroeve, an NSIDC ice research scientist who has been monitoring ice conditions aboard the Greenpeace vessel Arctic Sunrise, said the data suggested the Arctic sea ice cover was fundamentally changing and predicted more extreme weather.
"We can expect more summers like 2012 as the ice cover continues to thin. The loss of summer sea ice has led to unusual warming of the Arctic atmosphere, that in turn impacts weather patterns in the northern hemisphere, that can result in persistent extreme weather such as droughts, heatwaves and flooding," she said.
Arctic sea iceArctic sea ice extent for September 16, 2012 was 3.41m sq km. The orange line shows the 1979 to 2000 median extent for that day. The black cross indicates the geographic North Pole. Photograph: National Snow and Ice Data Center
Other leading ice scientists this week predicted the complete collapse of sea ice in the Arctic within four years. "The final collapse ... is now happening and will probably be complete by 2015/16," said Prof Peter Wadhams of Cambridge University.
Sea ice in the Arctic is seen as a key indicator of global climate change because of its sensitivity to warming and its role in amplifying climate change. According to the NSIDC, the warming of Arctic areas is now increasing at around 10% a decade.
Along with the extent of the sea ice, its thickness, or volume, has also significantly decreased in the last two decades. While this is harder to measure accurately, it is believed to have decreased around 40% since 1979.
The collapse of the ice cap was last night interpreted by environment groups as a signal of long-term climate warming caused by man.
"I hope that future generations will mark this day as a turning point, when a new spirit of global cooperation emerged to tackle the huge challenges we face. We must work together to protect the Arctic from the effects of climate change and unchecked corporate greed. This is now the defining environmental battle of our era," said Kumi Naidoo, director of Greenpeace International.
Other groups called on the UK government, and industries across the world to heed the warning signs from the Arctic and act "with urgency and ambition" to tackle climate change.
Rod Downie, polar expert at WWF-UK said: "With the speed of change we are now witnessing in the Arctic, the UK government must show national and global leadership in the urgent transition away from fossil fuels to a low carbon economy.
"This is further evidence that Shell's pursuit of hydrocarbons in the Arctic is reckless. It is completely irresponsible to drill for oil in such a fragile environment; there are simply too many unmanageable risks."
Author and environmental campaigner Bill McKibben said: "Our response [so far] has not been alarm, or panic, or a sense of emergency. It has been: 'Let's go up there and drill for oil'. There is no more perfect indictment of our failure to get to grips with the greatest problem we've ever faced."
Arctic sea ice follows an annual cycle of melting through the warm summer months and refreezing in the winter. It has shown a dramatic overall decline over the past 30 years.
Sea ice is known to play a critical role in regulating climate, acting as a giant mirror that reflects much of the sun's energy, helping to cool the Earth.
The UN Environment programme warned that the extra shipping and industry likely to result from the thawing of sea ice could further accelerate sea ice melting.
"There is an urgent need to calculate risks of local pollutants such as soot, or black carbon, in the Arctic. Soot darkens ice, making it soak up more of the sun's heat and quickening a melt," said UNEP spokesman Nick Nuttall in Nairobi.

Monday, September 17, 2012

neven: Arctic sea ice models are improving, but can they catch up?


Models are improving, but can they catch up?

IPCCAR4
by neven acropolis, Arctic Sea Ice Blog, September 17, 2012
"All models are wrong, but some are useful," as the saying goes. However, when looking at how Arctic sea ice decline is modeled, one might be tempted to say that all sayings are useful, but some are wrong. To be fair, I should be the last person taking a piss at climate models. Hundreds of brilliant scientists, engineers and IT specialists are giving their best every day to make supercomputers come up with scenarios that project future changes. Unfortunately, there is no Planet B to experiment on.
But we have come to a point where fake skeptics show up in television programmes (such as last week's BBC Newsnight) and use modeled predictions for Arctic sea ice in the 2007 IPCC Fourth Assessment Report as an argument not to be worried about the disappearance of Arctic sea ice, because "none of them shows it melting before the year 2070 on a regular basis in the summer" (quote from UK Conservative MP Peter Lilley).
As always, they're not telling the whole story:
Stroeve2
This image (taken from the Climate Crocks blog) comes from a GRL research paper by Stroeve et al. that was published in 2007, detailing how models that participated in the World Climate Research Programme Coupled Model Intercomparison Project Phase 3 (CMIP3) were doing compared to observations (red line). The 2011 dot was drawn in, based on NSIDC data on September 7th, last year. I took the liberty of drawing in the new 2012 record. This picture saves us the 1000 words needed to explain how off models are when it comes to matching observations, which essentially makes their projections worthless.
But as the Arctic sea ice cover has changed radically in just 6 years, so have new and improved models started a new round of simulations and projections for the Phase 5 project (CMIP5) for the next IPCC assessment report. And again, Dr. Julienne Stroeve and her colleagues from the NSIDC, NCAR and the Voeikov Main Geophysical Observatory in Russia, have taken a look at how these models are faring in a new GRL paper that was published three weeks ago in Geophysical Research LettersTrends in Arctic sea ice extent from CMIP5, CMIP3 and observations.
From the introduction:
The rapid retreat and thinning of the Arctic sea ice cover over the past several decades is one of the most striking manifestations of global climate change. Previous research revealed that the observed downward trend in September ice extent exceeded simulated trends from most models participating in the World Climate Research Programme Coupled Model Intercomparison Project Phase 3 (CMIP3). We show here that as a group, simulated trends from the models contributing to CMIP5 are more consistent with observations over the satellite era (1979–2011). Trends from most ensemble members and models nevertheless remain smaller than the observed value. Pointing to strong impacts of internal climate variability, 16% of the ensemble member trends over the satellite era are statistically indistinguishable from zero. Results from the CMIP5 models do not appear to have appreciably reduced uncertainty as to when a seasonally ice-free Arctic Ocean will be realized.
This is a very interesting paper that is easy to follow. Two metrics are used to evaluate the performance of CMIP5 climate models: (1) The distribution of simulated extents over the period of observations (19532011) is used to assess how well the models capture the observed state of the ice cover, and then (2) Trends in simulated ice extent are used as a measure of the ability of the models to capture the response of the ice cover to global climate change. Quote:
It is possible that a model can capture the historical state but not the trend. We compare results of these evaluations to those based on the CMIP3 simulations. The CMIP5 models will become the main source of climate projections assessed by the International Panel on Climate Change (IPCC) in its 5th Assessment Report.
Two scenarios are used for the 56 ensemble members from 20 climate models in the CMIP5 archive: The representative concentration pathway (RCP) 4.5 future emission scenario, that stabilizes radiative forcing at 4.5 W m-2 in the year 2100, resulting in approximately 550 ppm of CO2 by 2100. The other scenario is the same CMIP3 20th century and future “business as usual” (SRES A1B emission scenario) model output. A1B attains CO2 levels of 750 ppm by 2100 and is hence a more aggressive scenario than RCP4.5. Models with more than 75% of their distribution falling outside the observed range of 6.13 to 8.43 million km2 were rejected. Of the 20 CMIP5 models, 17 models were retained, resulting in a total of 38 ensemble members.
Here's how things look for modeled, observed and projected September mean sea ice extent in the 19002100 period:
Figure 2a
Figure 2. Time-series of modeled (colored lines) and observed (solid red line) September sea ice extent from 1900 to 2100. All 56 individual ensemble members from 20 CMIP5 models are included as dotted colored lines, with their individual model ensemble means in solid color lines. The multi-model ensemble mean is based on 38 ensemble members from 17 CMIP5 models (shown in black), with +/- 1 standard deviation shown as dotted black lines. Figure inset is based on the multi-model ensemble mean from CMIP5 and CMIP3, +/- 1 standard deviation.
I haven't drawn in this melting season's result, but it will obviously fall outside the 1 standard deviation of the CMIP5 multi-model ensemble. Some ensemble members are even lower, but that's because they started out much lower than the actual observations.
Results are described as follows in the paper:
Based on multi-model ensemble mean extents at the beginning of the 20th century, there is a 1.1 million km2 difference in the mean September extent between CMIP3 and CMIP5 (Figure inset, N.). During the period of satellite observations, the September CMIP5 multi-model ensemble mean tends to be slightly lower than the observed extent until 2007, after which it is higher. By contrast, the CMIP3 multi-model ensemble has a positive bias throughout the period of observations and especially during the most recent decade. Turning to the end of the 21st century, the CMIP5 multi-model ensemble mean never reaches ice-free conditions (defined here as less than 1.0 million km2), but the minus 1 standard deviation drops below the ice-free threshold around year 2045. Several CMIP5 models (CanESM2, GISS E2-R, GFDL-CM3, NCAR CESM, MIROC-ESM and ESM-CHEM) show essentially ice-free conditions by 2050, with the CanESM2 model having an ensemble member reaching nearly ice-free conditions as early as 2016 (0.54 million km2). By contrast, despite the more aggressive emission scenario (SRESA1B) driving the CMIP3 models, an overall more extensive sea ice cover is retained, with the minus 1 standard deviation reaching nearly ice-free conditions in 2075.
The same thing was done for March mean sea ice extent, with the following result:
The lower CMIP5 March extent compared to CMIP3 results in good overall agreement with the observations, though the observed values fall below the CMIP5 multi-model ensemble means in recent years.
Stroeve et al. also test whether the observed trend falls within the distribution of simulated trends at a specified level of statistical significance:
Turning to the modern satellite era, 19792011, more CMIP5 ensembles have a smaller rate of decline than observed, which at -0.84 million km2 per decade is nearly twice as large as the trend for 19532011. Forty-six of 56 ensemble members have trends outside of the 2 bound for the observations and 9 ensemble members have trends that are not statistically different from zero at the 90% confidence level. Although most model trends remain slower than observed, six ensemble members have rates of decline larger than observed. Overall, 64% of the ensemble member trends are statistically different from the observed trend at the 90% confidence level. In contrast, 85% of the CMIP3 ensemble members have trends that are statistically different from observed. The multi-model ensemble mean trend over the satellite period is -0.50 million km2 decade, which is 70% larger than the CMIP3 multi-model mean value of -0.35 million km2 decade.
It's clear that the CMIP5 models do a better job than the CMIP3 models used for the 2007 IPCC Fourth Assessment Report. But better is not the same as good. In this case 'less bad' would be a more accurate description. If Arctic sea ice continues melting at this rate, the question arises whether there is any sense in trying to optimize models. By the time they capture all the processes that are involved in melting, transporting and compacting the Arctic sea ice cover, it might already be gone. Maybe some of the money and human intelligence that go into models could be better spent on observational purposes (satellites, buoys, moorings) and the consequences that disappearing Arctic sea ice is already producing: changing weather patterns, methane release, permafrost melt and erosion.
As for the new IPCC report coming out next year: This time, a crazy melting season that shatters all previous records occurs just before the deadline and not after it. Will the seriousness and potential danger of an ice-free Arctic be reflected in the relevant chapters? Or will the IPCC again be too conservative (see this piece by Bryan Walker on the Hot Topic blog), hiding behind models that still haven't caught up with reality? The (lead) authors have their work cut out for them, but I'm sure they'll do a good job. We'll see what happens then.
Thanks goes out to Julienne Stroeve for allowing me to cover her important paper. Dr. Stroeve is currently in the middle of the ice pack to survey ice conditions and collect validation data (more on that later). To share her experiences she has started a blog: Ice Edge 2012

Saturday, September 15, 2012

The staggering decline of sea ice at the frontline of climate change

Scientists on board Greenpeace's vessel exploring the minimum extent of the ice cap are shocked at the speed of the melt

by John Vidal, 82.30 N, 25.80 E, The Guardian, September 14, 2012

John Vidal in Arctic : Scientist John Fletcher from Cambridge University Measuring Arctic Sea Ice
The scientist John Fletcher from Cambridge University measures the thickness of an ice floe in the Arctic. Photograph: Alex Yallop/Greenpeace


We are a few hundred miles from the North Pole. The air temperature is –3 degrees centigrade, the sea freezing. All around us in these foggy Arctic waters at the top of the world are floes – large and small chunks of sea ice that melt and freeze again with the seasons.
Arne Sorensen, our Danish ice pilot, is 60 feet up in the crow's nest of the Arctic Sunrise vessel. Visibility is just 200 yards, and he inches the 1,000-tonne Greenpeace ice breaker forward at two knots through narrow passages of clear water. The floes are piled up and compressed in fantastic shapes and shades of grey and blue; they crack, rumble and groan as we nudge them aside or climb over them. Two polar bears on our port side lift their heads but resume hunting.
Sorensen has sailed deep into ice at both poles for 30 years, but this voyage is different, he says. The edge of the Arctic ice cap is usually far south of where we are now at the very end of the melt season. More than 600,000 square kilometres (sq km) more ice has melted in 2012 than was ever recorded by satellites before. Now the minimum extent has been nearly reached and the sea is starting to refreeze.
"This is the new minimum extent of the ice cap," he says, "the 'frontline' of climate change.
"It is sad. I am not doubting this is related to emitting fossil fuels to a large extent. It's sad to observe that we are capable of changing the planet to such a degree."
The vast polar ice cap, which regulates the Earth's temperature and has been a permanent fixture in our understanding of how the world works, has this year retreated further and faster than anyone expected. The previous record, set in 2007was officially broken on 27 August when satellite images averaged over five days showed the ice then extended 4.11 million sq km, a reduction of nearly 50% compared to just 40 years ago.
But since 27 August, the ice just kept melting – at nearly 40,000 sq km a day until a few days ago. Satellite pictures this weekend showed the cap covering only 3.49 million sq km. This year, 11.7 m sq km of ice melted, 22% more than the long-term average of 9.18 m sq km. The record minimum extent is now likely to be formally called on Monday by the US National Snow and Ice Data Centre (NSIDC) in Colorado.
The record hasn't just been broken, it's been smashed to smithereens, adding weight to predictions that the Arctic may be ice-free in summer months within 20 years, say British, Italian and American-based scientists on board the Arctic Sunrise. They are shocked at the speed and extent of the ice loss.
The Cambridge University Sea ice researcher Nick Toberg, who has analysed underwater ice thickness data collected by British nuclear submarine HMS Tireless in 2004 and 2007, said: "This is staggering. It's disturbing, scary that we have physically changed the face of the planet. We have about 4 million square kilometres of sea ice. If that goes in the summer months that's about the same as adding 20 years of CO2 at current [human-caused] rates into the atmosphere. That's how vital the arctic sea ice is.
"In the 1970s we had 8 million square kilometres of sea ice. That has been halved. We need it in the summer. It has never decreased like this before."
"We knew the ice was getting thinner but I did not expect we'd lose this much this year. We broke the record by a lot," says the NSIDC scientist Julienne Stroeve.
"The acceleration of the loss of the extent of the ice is mostly because the ice has been so thin. This would explain why it has melted so much this year. By June the ice edge had pulled back to where it normally is in September," she says.
"The 2007 record was set when you had weather conditions which were perfect for melting. This year we didn't have those. It was mixed. So this suggests the ice has got to a point where it's so thin it doesn't matter what the weather is, it's going to melt in the summer. This could become the new normal," says Stroeve.
In the past Stroeve has shown that ice melt has been happening far faster than the models predicted. Her new research, published last month in the journal Geophysical Research Letters, shows humans may have been responsible for most of the ice loss in recent decades.
"It suggests 60% of the observed decline in ice extent in Septembers from 1953-2011 was due to human activity. The decline is linked to the increase in temperatures," she says.
"This year is significant. At the moment the [ice extent] is below what the next Intergovernmental Panel on Climate Change report will show in 2014. We are on the extreme edge of the models, suggesting that ice loss is happening much faster than the models suggested," says Stroeve.
All over the Arctic the effects of accelerating ice loss and a warming atmosphere are being seen. The ecology is changing rapidly as trees and plants move north, new beetles devastate whole forests in Canada, Siberia and Alaska, and snowfall increases. Inuit and other communities report more avalanches, the erosion of sea cliffs and melting of the permafrost affecting roads and buildings. Whole coastal communities may have to be moved to avoid sea erosion.
With the ice loss has come a rush by industry for Arctic resources. Oil, gas, mining and shipping companies are all expanding operations into areas that until only 20 years ago would have been physically impossible. They bring new opportunities for trade, but new threats to the environment. On Monday, a historic first drilling operation by Shell in the Chukchi Sea off Alaska was halted after sea ice was seen moving towards the oil company's drill ship.
Other new research suggests that the loss of ice could be could be affecting the path and speed of the jet streams, possibly explaining why extreme weather in the northern hemisphere is lasting longer.
"There is evidence of stronger and more intense north Atlantic storms and extreme weather," says Stroeve. "We are thinking we are entering a new climate state. Until we get the next push and reach a new equilibrium."
From now on until June, the Arctic sea ice will refreeze. First it will be glassy, thin "shuga," "grease" or "pancake" ice, unable to bind the floes together. But within weeks, the whole icecap will visibly reform, growing up to 100,000 sq km a day until the melt season begins again next year.
But, says Toberg, because of the massive melt this year, there will be less old, or multiyear, ice which is thicker and less prone to melting. The new ice formed this winter will be weaker and more vulnerable to melt, hastening the loss of ice next year. "It is preconditioned to melt," he says.
Now, "feedbacks" are thought to be hastening the ice retreat. In recent summers, say ice experts, Arctic sea surface temperatures have been well above normal, partly because there is less ice to reflect heat back into the atmosphere. The darker open waters now absorb more solar radiation, accelerating the melt.
"The ice is weak so it opens up water and allows more sunlight in which warms the water more which makes the ice break up more – so it accelerates the melt. There is hardly any old, multi-year ice left, so first year ice is now dominant. We are seeing less and less old thick ice," says Toberg.
The longer term implications of the great melt of 2012 are hard to call, say climate scientists who caution that more research is needed. Sea ice plays a critical role in regulating climate, acting as a giant mirror that reflects much of the sun's energy, helping to cool the Earth.
What is suspected is that the formation of the sea ice produces dense salt water which sinks, helping drive the deep ocean currents. Without the summer sea ice, many scientists fear this balance could be upset, potentially causing major climatic changes.
"The Arctic ice cover is a lid on the planet that regulates the temperature. By taking it off you are warming it. Temperatures [everywhere] depend on it," says Toberg.
Sea ice extent has varied naturally over the decades with some Russian data suggesting similar or even greater ice loss in some local areas in the 1930s. But the models are clear, says Stroeve. If you omit the observed records, keeping CO2 levels at pre-industrial levels, then none show a decline of ice cover. When you do put CO2 into the models, they all show a decline, she says.
"Just because there was possibly less ice in some areas at other times, that doesn't mean it's not human-induced now."
"We can expect the Arctic to be ice-free in summer within 20 years," she says. "The ice won't go away the whole year. It will still be cold enough in the Arctic to freeze in winter. But by 2030 I'd say we will have an ice-free summer Arctic. That does not mean that natural ice variability cannot bring it back again, but the trend, we think, will be downward."
"This is a defining moment in human history," said Kumi Naidoo, director of Greenpeace International in Amsterdam. "In just over 30 years we have altered the way our planet looks from space and soon the north pole may be completely ice-free in summer.
"Fossil fuel companies are still making profits despite the fact that climate change is so clearly upon us. Our politicians are putting corporate interests above scientific warnings and failing in their duties to the public."