Blog Archive

Showing posts with label Arctic amplification. Show all posts

Wednesday, January 22, 2020

Evidence that an ice-free Arctic Ocean allowed ancient CO2 and methane emissions


Speleothems like these form fastest when the permafrost has thawed. Image: By James St John, via Wikimedia Commons
As the world warms, more greenhouse gas will enter the atmosphere. Researchers now think an ice-free Arctic Ocean explains how and why.

by Tim Radford, Climate News Network, January 10, 2020

LONDON – Deep in a cave in Siberia, Israeli, Russian and British scientists have identified evidence of periodic losses of carbon from the permafrost. And the unexpected link is not simply with peak periods of bygone global warming, but with an ice-free Arctic Ocean. The escape into the atmosphere of prodigious volumes of methane and carbon dioxide from the thawing soils is in step not with average planetary temperature rise, but with long periods when the Arctic Ocean is free of ice every summer.

Fact one: about one quarter of land in the northern hemisphere is now, and has been for much of the last half million years, permanently frozen, and with it about twice as much atmospheric carbon – in the form of peat and preserved vegetation – as there exists freely in the planetary atmosphere.

Fact two: in the most recent decades, sea ice has been both thinning and dwindling rapidly, and the polar ocean could by 2050 become almost entirely ice-free in the summer months. “This discovery about the behaviour of the permafrost suggests that the expected loss of Arctic sea ice will accelerate melting of the permafrost presently found across much of Siberia” And this twist in the tale of a rapidly-warming Arctic is preserved in stalagmite formations in a cave deep beneath the rim of the Arctic Circle in Siberia.

The chronology of stalagmite and stalactite development can be established precisely by the pattern of uranium and lead isotope deposits in formations, built up imperceptibly by the steady drip of water from, and through, the soils far above. That is, the speleothems – a geologist’s catch-all word for both stalactite and stalagmite – form fastest when the permafrost has thawed. And unexpectedly, the periods of thaw did not match the peaks of interglacial warming during the last 1.35 million years. They did however coincide with periods when the Arctic was ice-free in the summer.

“This discovery about the behaviour of the permafrost suggests that the expected loss of Arctic sea ice in the future will accelerate melting of the permafrost presently found across much of Siberia,” said Gideon Henderson of the University of Oxford, and one of the authors of a new study in the journal Nature.

The argument goes like this: if there is no sea ice then more heat and moisture is delivered from the ocean to the atmosphere, with warmer air flowing over Siberia, and therefore more autumn snowfall. A blanket of snow insulates the soil beneath from the extreme winter cold, so ground temperatures go up, to unsettle the permafrost and start a thaw that leads to accelerated plant decay and ever-increasing escape of carbon dioxide and methane that would otherwise have been frozen into the permafrost. So the stalagmites endure as evidence of these warmer soils and survive as a direct link to periods of ice-free ocean.

“If these processes continue during modern climate change, future loss of summer Arctic sea ice will accelerate the thawing of Siberian permafrost,” the scientists say. 

https://climatenewsnetwork.net/ice-free-arctic-ocean-allowed-ancient-carbon-leaks/

Sunday, April 21, 2019

Greenhouse Gas Emissions from thawing Arctic permafrost may be 12 times higher than thought, scientists say

'This needs to be taken more seriously than it is right now,’ says author of new study

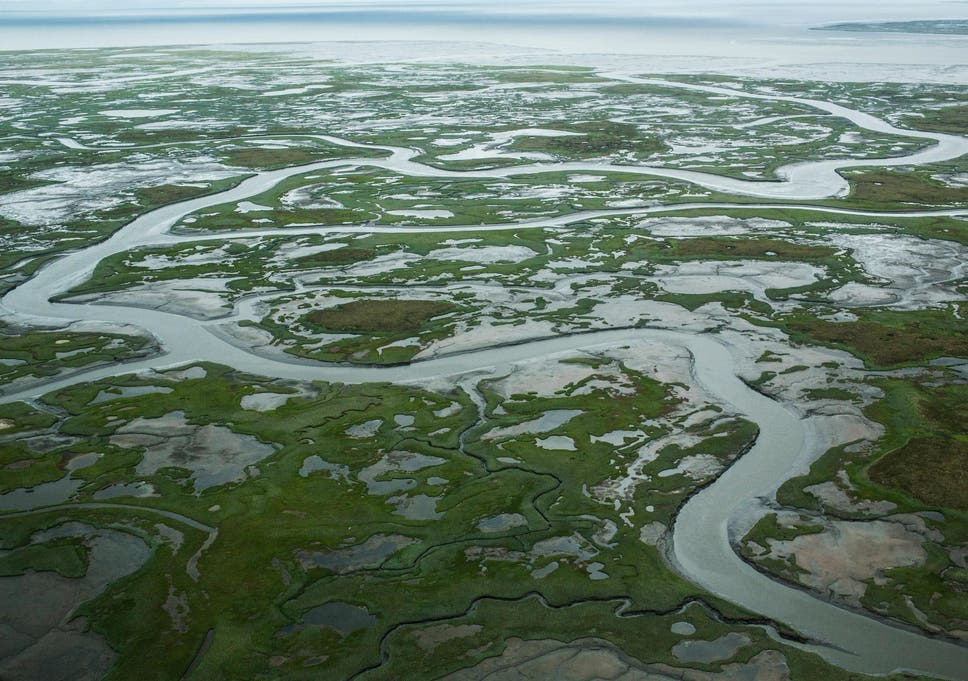
Melting permafrost in Alaska caused by rising global temperatures.
Melting permafrost in Alaska caused by rising global temperatures. (Andrew Burton/Getty Images )

by Chiara Giordano, The Independent, April 20, 2019

READERS: here is the Barrow, Alaska, measuring site for CO2:

https://www.esrl.noaa.gov/gmd/dv/iadv/graph.php?code=BRW&program=ccgg&type=fi

Emissions from thawing Arctic permafrost may be 12 times higher than previously thought, scientists have discovered.
Permafrost is a mix of soil, rock or sediment that has been frozen for at least two years which is mostly found in the uppermost areas where temperatures are rising more quickly than the rest of the world.
When it thaws because of global warming, it releases large quantities of carbon dioxide and methane into the atmosphere, causing temperatures to rise and creating a perpetual cycle where more permafrost melts.
Nitrous oxide, a third greenhouse gas nearly 300 times more potent than carbon dioxide, stays in the atmosphere for an average of 114 years, according to the Environmental Protection Agency (EPA).
It has “conventionally been assumed to have minimal emissions in permafrost regions,” according to a fresh study published in the Atmospheric Chemistry and Physics journal.
However the research team behind the study, led by Harvard University scientists, has found that nitrous oxide emissions are 12 times higher than previously thought and therefore more of a threat.
The group used a small plane with a probe on its nose to measure greenhouse gases over 120 square miles of thawing permafrost in the North Slope of Alaska.
They found that nitrous oxide emissions reached what was previously thought to be the expected yearly limit within just one month in August 2013.
Nitrous oxide also poses a second threat because “up in the stratosphere, sunlight and oxygen team up to convert the gas into nitrogen oxides, which eat at the ozone,” Harvard University said in a statement.
Jordan Wilkerson, one of the authors of the study, said: “Much smaller increases in nitrous oxide would entail the same kind of climate change that a large plume of CO2 would cause.”
“This is widespread, pretty high emissions.”
He called for further research on the greenhouse gases, especially nitrous oxide, adding: “This needs to be taken more seriously than it is right now.”
https://www.independent.co.uk/environment/global-warming-greenhouse-gases-emissions-arctic-alaska-a8874456.html

Wednesday, April 26, 2017

Arctic climate warming higher and faster than expected

Open water in Arctic Ocean affecting weather patterns around world

by Margo McDiarmid, CBC News,April 24, 2017
A polar bear sits on ice in Lancaster Sound. A new report by 90 scientists says Arctic temperatures are rising faster than in the rest of the world, and animals that rely on ice for survival are facing increased stress and disruption.
A polar bear sits on ice in Lancaster Sound. A new report by 90 scientists says Arctic temperatures are rising faster than in the rest of the world, and animals that rely on ice for survival are facing increased stress and disruption. (Jimmy Thomson/CBC)

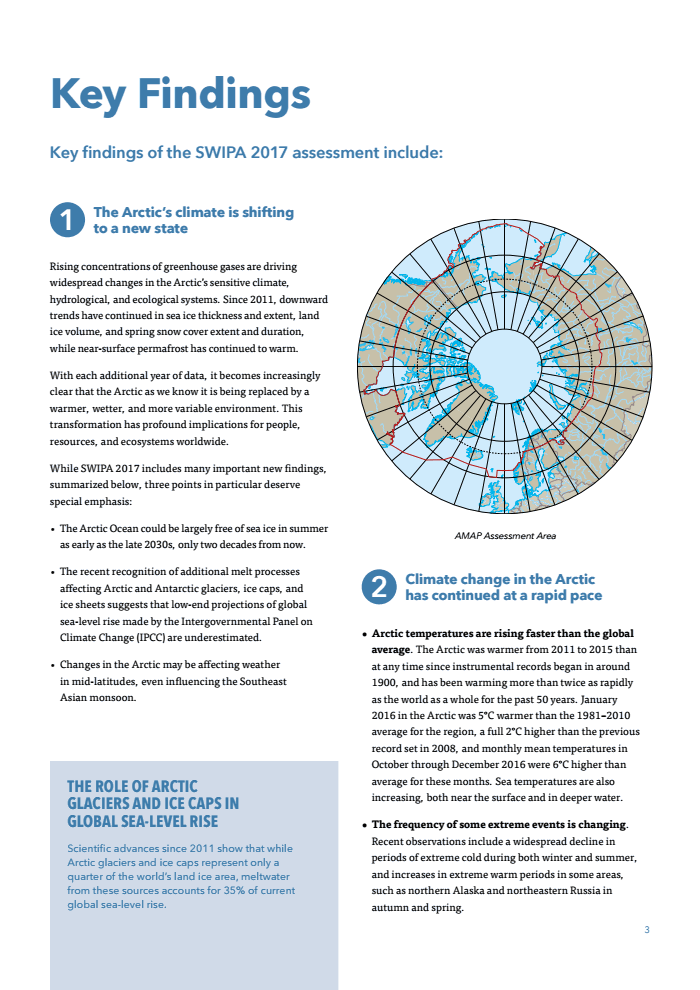
A new international report shows that Arctic temperatures are rising higher and faster than expected, and the effects are already being felt around the world.
"The Arctic's climate is shifting to a new state," warns the report.
"This transformation has profound implications for people, resources and ecosystems worldwide."
The Snow, Water, Ice and Permafrost in the Arctic assessment was written by more than 90 scientists from around the world who compiled the latest northern research on how climate change is affecting the Arctic ice and ecosystems.
It's part of the Arctic Monitoring and Assessment Program of the Arctic Council, which represents eight circumpolar countries.
Among the findings in this year's report:
  • The Arctic Ocean could be largely free of sea ice in the summer as early as 2030 or even before that.
  • Arctic temperatures are rising twice as fast as the temperatures in the rest of the world. In the fall of 2016 mean temperatures were 6 degrees higher than average.
  • Thawing permafrost that holds 50% of the world's carbon is already affecting northern infrastructure and could release significant amounts of methane into the atmosphere.
  • Polar bears, walruses and seals that rely on ice for survival are facing increased stress and disruption.
  • Changes in the Arctic may be affecting weather as far away as Southeast Asia.
"The Arctic is connected to the rest of the planet," said David Barber, who is a leading expert on Arctic ice at the University of Manitoba and one of the authors of the report.
"We are seeing the first and strongest signs of global warming in the Arctic. We knew this was coming, we knew 30 years ago that it was coming, and it is now here," said Barber in an interview with CBC News.

Open water during winter 

Barber said one of the most surprising results of the research is that there is now open water even during the winter in the Arctic Ocean. 
"We didn't think we would see that much open water in the winter," he said adding that it is occurring mostly on the Atlantic side.
"The Atlantic ocean water is penetrating further into the Arctic and it's upwelling towards the base of the sea ice, where it is melting the sea ice from underneath, this is one of the key findings."  
Last year saw a record low amount of winter sea ice.
Arctic Report Card
A fisherman drives a boat near the Arctic Circle in Ilulissat, Greenland, in 2016, during a visit to the area by then U.S. secretary of state John Kerry. The U.S. hosts the next Arctic Council meeting in Alaska next month, the first time the polar nations will meet to discuss climate change since Donald Trump was elected U.S. president. (Evan Vucci/Pool/Associated Press)
That open water may be affecting weather patterns. Increased heat from the open water is rising into the atmosphere, which in turn is causing the polar vortex, also known as the jet stream, to weaken in strength.
The jet stream is the line of powerful winds between the cold dry air of the North Pole and the warm moist air mass farther south. As it weakens, it disintegrates into a series of lobes dipping up and down, carrying cold air south and warm air north. 
Scientists believe that's the reason why we are seeing unseasonably frigid temperatures in places like Florida and unusually warm weather in the north.
"For example, last fall in November-December, the temperature at the North Pole was 32 degrees Fahrenheit higher than it should have been in November-December, because one of these lobes had extended all the way to the North Pole and was drawing up warm weather from California," said Barber. 
The report says the weakened jet stream is also causing extreme weather events like heavy rain in North America and heavy monsoons in Southeast  Asia. 
Amid the dire predictions, the report contains some hope. It says that while these changes in the Arctic will continue until 2050, they can be slowed down after that.
It predicts that if governments make substantial cuts to greenhouse gas emissions, like those contained in the Paris climate agreement, it can help to stabilize the warming trends in the Arctic and stop further loss of ice and snow by the end of the century.
This report is being released ahead of the Arctic Council meeting in Fairbanks, Alaska, on May 11, 2017. The U.S. is hosting the meeting, which will be the first time that Arctic nations including the U.S., Canada, Russia, Denmark, Finland, Iceland, Norway, and Sweden will gather to talk about climate change since Donald Trump was elected U.S. president. 
Trump has called climate change a Chinese hoax and his government is in the process of scrapping environmental measures designed to control carbon emissions linked to climate change. 

Snow, Water, Ice and Permafrost in the Arctic

DOCUMENT
Zoom
CBC is not responsible for 3rd party content

Sunday, April 9, 2017

Northern Hemisphere jet streams stumble as the world warms

The warming of the atmosphere by greenhouse gases is slowing the jet streams which drive the Northern Hemisphere's weather, scientists say. 
by Tim Radford, Climate News Network, April 9, 2017

LONDON
 – Researchers have once again linked a sequence of devastating climate events to global warming fuelled by prodigal human use of fossil fuels. And this time, they believe they have identified the agency
 behind the blazing summers that have claimed lives and destroyed livelihoods repeatedly during this century.
They argue in the journal Scientific Reports that human impact on the climate now reaches high into the stratosphere, to influence the behaviour patterns of the giant jet streams that carry heat and moisture around the Northern Hemisphere and keep the weather on the move.
Warming driven by carbon dioxide emissions from car exhausts and power stations, they argue, tends to make these giant oscillating waves stall in their journey around the hemisphere – to create enduring episodes of high and low pressure and lingering hazards of drought and flood.
“The unprecedented 2016 California drought, the 2011 US heatwave and 2010 Pakistan flood as well as the 2003 European hot spell all belong to a most worrying series of extremes,” says Michael Mann from Pennsylvania State University in the US.

“Human activity has been suspected of contributing to this pattern before, but now we uncover a clear fingerprint of human activity”

“The increased incidence of these events exceeds what we would expect from the direct effects of global warming alone, so there must be an additional climate change effect. In data from computer simulations as well as observations, we identify changes that favour unusually persistent, extreme meanders of the jet stream that support such extreme weather events.
“Human activity has been suspected of contributing to this pattern before, but now we uncover a clear fingerprint of human activity.”
Professor Mann has repeatedly confirmed the link between human action and climate change. His co-author Dim Coumou of the Potsdam Institute for Climate Impact Research in Germany and the VU University in Amsterdam in the Netherlands has separately linked storm tracks to surface temperature extremesmade a connection between torrential rains and planetary warming, and confirmed too that less stormy weather is not necessarily a good sign, because it could be the harbinger of heat waves.
And the researchers now have support for their their suspicions: the jet streams that sweep the hemisphere in huge atmospheric waves, plunging between Arctic and tropics, bring changes of weather.
If they should stall, one region may be committed to long drought, dangerous hot weather (as in Russia in 2010 and Texas in 2011) and even forest fires as in California in 2015) – or, in some cases, catastrophic and sustained rainfall of the kind that flooded Pakistan in 2010.

Questions remain

No single extreme event could ever be satisfactorily and conclusively linked to a long-term trend like global warming. But once scientists register an increasing frequency of such events, they can start to use climate simulations to see if such events become more likely in a warming world.
“The more frequent persistent and meandering jet stream state seems to be a relatively recent phenomenon, which makes it even more relevant," said Dr Coumou. “We certainly need to further investigate this – there is some good evidence, but also many open questions.”
And Professor Mann said: “The warming of the Arctic, the polar amplification of warming, plays a key role here. The surface and lower atmosphere are warming more in the Arctic than anywhere else on the globe.
“That pattern projects onto the very temperature gradient profile that we identify as supporting atmospheric waveguide conditions.”

Friday, August 12, 2016

Piecing together the Arctic’s sea ice history back to 1850

from the Carbon Brief, August 11, 2016
A guest article by Florence Fetterer, principal investigator at the National Snow and Ice Data Centre (NSIDC) in the US.
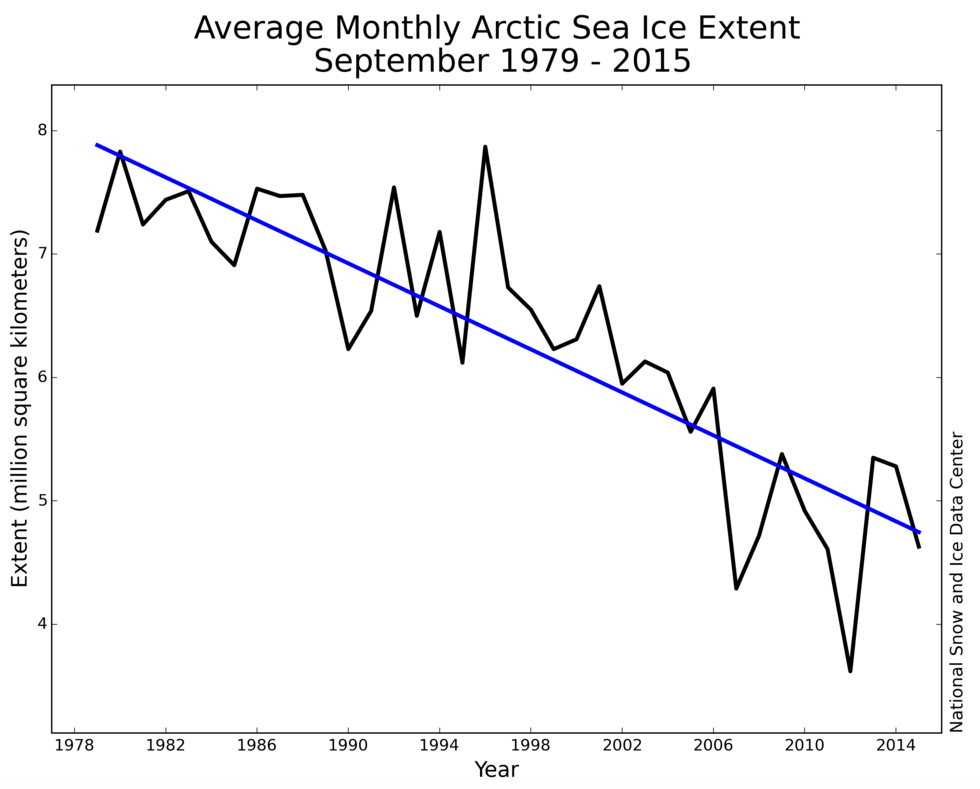
Sea ice cover in the Arctic has undergone a widely reported decline in recent decades. The decrease has been greatest during summer, with sea ice extent reducing by around 12% per decade since the satellite record began in 1979.
The main cause of this rapid decline is rising air temperatures. The Arctic is warming twice as quickly as the global average, a phenomenon known as Arctic amplification. Other factors, such as wind patterns and ocean warming, also play a role in the diminishing sea ice.
Average monthly Arctic sea ice extent in September between 1979 and 2015 (at a rate of 13.4% per decade). Credit: NSIDC


Average monthly Arctic sea ice extent in September between 1979 
and 2015 (at a rate of 13.4% per decade). Credit: NSIDC
Satellites provide a near-continuous record of Arctic sea ice cover, allowing scientists to monitor changes from one day to the next. But because this data spans only the most recent three and a half decades, we need to look elsewhere to gather information on variations over longer periods.
This data is necessary as there are some research questions that can’t be answered with only short-term records, such as:
  1. Has Arctic sea ice cover been this small since the start of the industrial revolution?
  2. Has sea ice ever declined this rapidly in the historical record?
  3. How is sea ice affected by natural fluctuations over multiple decades?
To tackle this problem we set about constructing a record of sea ice going back to 1850. And this meant gathering data from some rather unusual sources.

Digitising data

First, a little background. In the 1970s, the world’s community of sea ice researchers was a small one. Academics were mainly interested in the role sea ice played in regulating the surface energy balance of the Arctic. Sea ice insulates the cold atmosphere from the warmer ocean, reflects sunlight throughout the polar summer, and releases or stores heat through the process of melting or freezing.
At the time, the question of whether variability in Arctic sea ice extent was being affected by the climate was still an open one.
Nevertheless, scientists were still concerned about preserving existing data on sea ice, and gathering more, with the aim of producing an Arctic-wide view of sea ice conditions.
Observations of sea ice came from far and wide, including ship reports, aeroplane surveys, compilations by naval oceanographers, and analyses by national ice services and meteorological offices.
Prof John Walsh, now at the University of Alaska Fairbanks, and Dr Mick Kelly, from the University of East Anglia (now retired), were pioneers at retrieving data. They hand-digitised information from sources, such as aerial surveys, from the US Navy and UK Meteorological Office, and from the Danish Meteorological Institute’s yearbook maps (see examples from 1978 and 1979 – both pdfs).
Walsh, along with Prof William Chapman from the University of Illinois, used these various sources to make monthly grids in Arctic and Southern Ocean sea ice concentrations, covering the period 19011995. These grids proved to be very popular among researchers – possibly because there were few alternatives.
However, the early years of this record had significant gaps. Almost no ice information was collected during the second world war, for example.
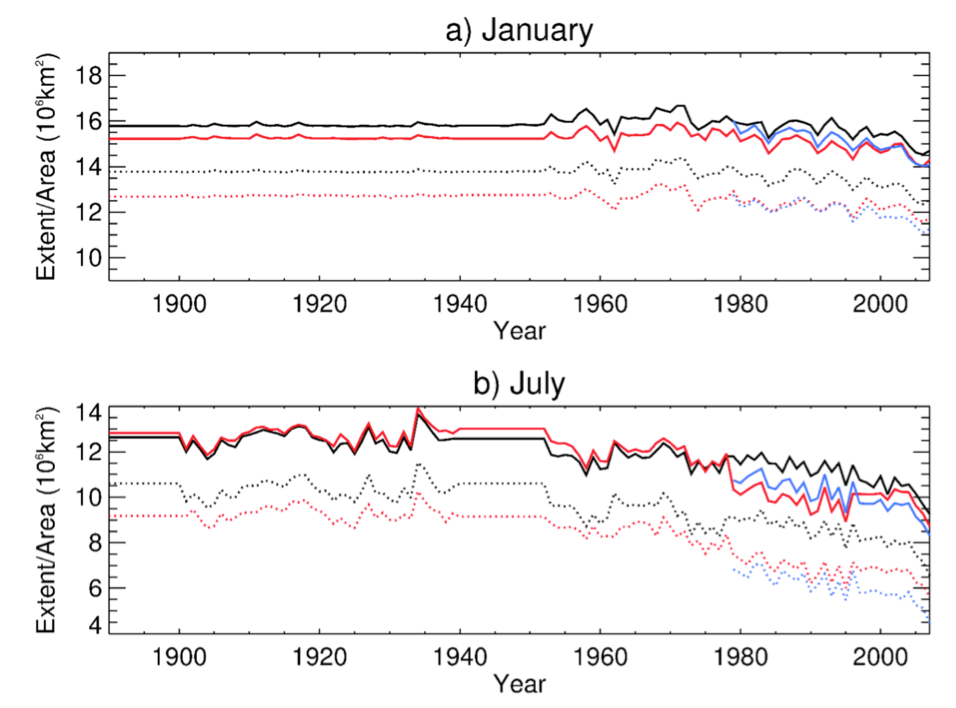
These gaps were filled by using the long-term averages for each month. This is illustrated in the charts below, which show monthly sea ice data from the Met Office Hadley Centre (red and black lines) and the recent NASA satellite record (blue line).
Time series of Northern Hemisphere sea ice extent (solid line) and area (dotted) for 1890-2007, for the Met Office Hadley Centre datasets HadISST.2.1.0.0 (black), HadISST1.1 (red), and the NASA Team dataset (blue). Monthly average values are shown for a) January and b) July.


Time series of Northern Hemisphere sea ice extent (solid line) and area 
(dotted) for 18902007, for the Met Office Hadley Centre datasets HadISST.2.1.0.0 (black), HadISST1.1 (red), and the NASA 
Team dataset (blue). Monthly average values are shown for a) January 
and b) July. Credit: Holly Titchner, UK Met Office.
While this data provides an indication of long-term sea ice changes, it doesn’t accurately reflect the ups and downs of natural variability. This presents a problem for climate modellers, who need data with realistic past sea ice fluctuations on which to base their projections for the future.
Fortunately, in the decade since those monthly grids were published, more historical data sources have become available.

New sources

We’ve used a range of new data sources to fill gaps and extend the Arctic sea ice record back to 1850. We’ve also updated the record with the latest satellite data.
These are some of the sources of information we used to create our sea ice dataset:
  • The sea ice edge positions in the North Atlantic, between 1850 and 1978, derived from various sources, including newspapers, ship observations, aircraft observations, diaries and more.
  • Sea ice concentration data from regular aerial surveys of ice in the eastern Arctic by the Arctic and Antarctic Research Institute, St. Petersburg, Russia, beginning in 1933.
  • Sea ice edge positions for Newfoundland and the Canadian Maritime Region from observations, for 1870 to 1962.
  • Detailed charts of ice in the waters around Alaska for 1954 to 1978, originally the property of a consulting firm (the Dehn collection).
  • Arctic-wide maps of ice cover from the Danish Meteorological Institute from 1901 to 1956.
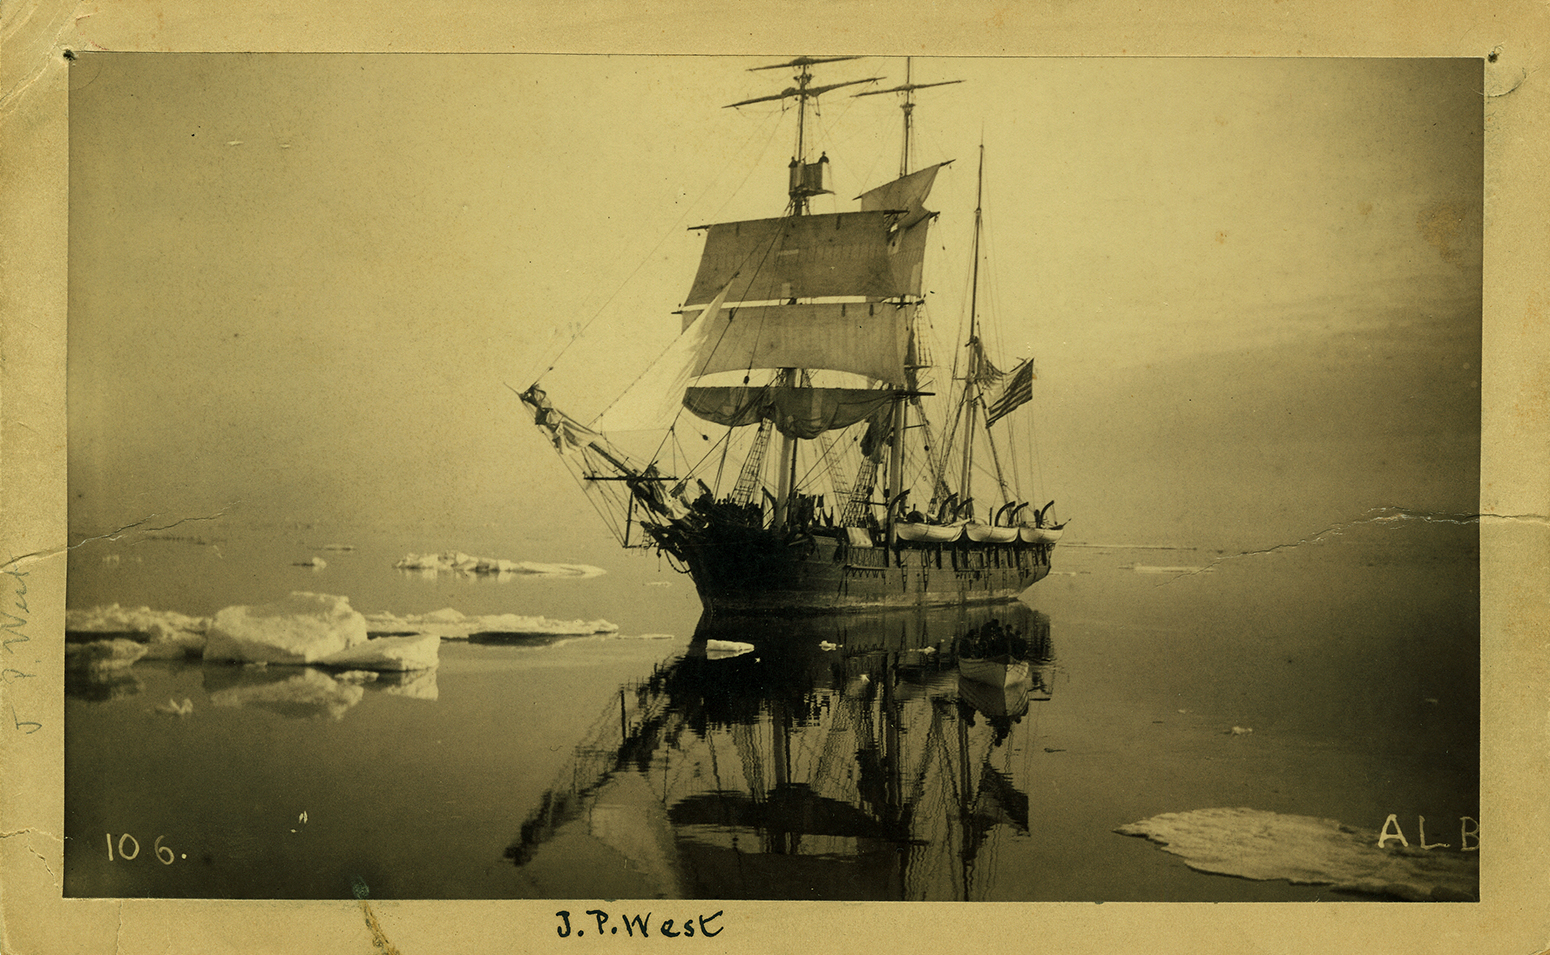
  • Whaling ship logbook entries that noted ship position along with an indication of whether the ship was in the presence of ice (see image of whaling ship below).
In the Crow's Nest, watching for a 'blow'. "Thar she blows". Photo courtesy of the New Bedford Whaling Museum.
In the Crow’s Nest, watching for a whale ‘blow.’ “Thar she blows.” 
Photo courtesy of the New Bedford Whaling Museum.

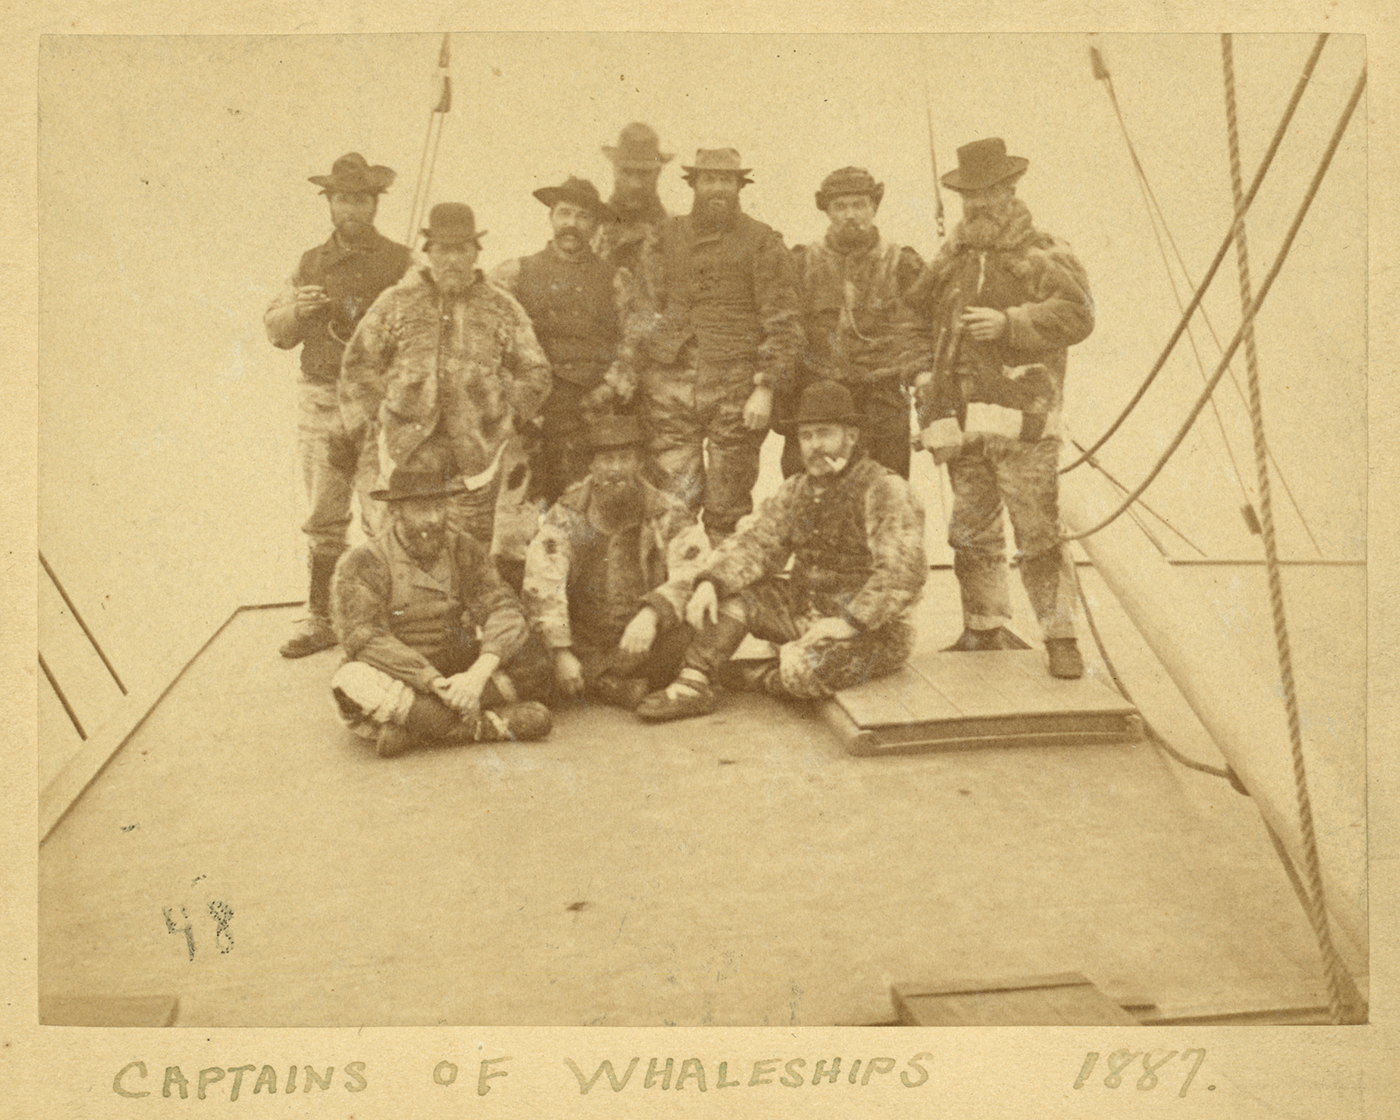
Sepia photo of whaling Captains of Whaleships in Arctic dress


Captains of whaleships in Arctic dress; (left to right) Captains Shockley, 
Owen, Tobey, Whiteside, Adams, Millard, Fisher, Ellis, Keenan, Baker. 
Photo courtesy of the New Bedford Whaling Museum.
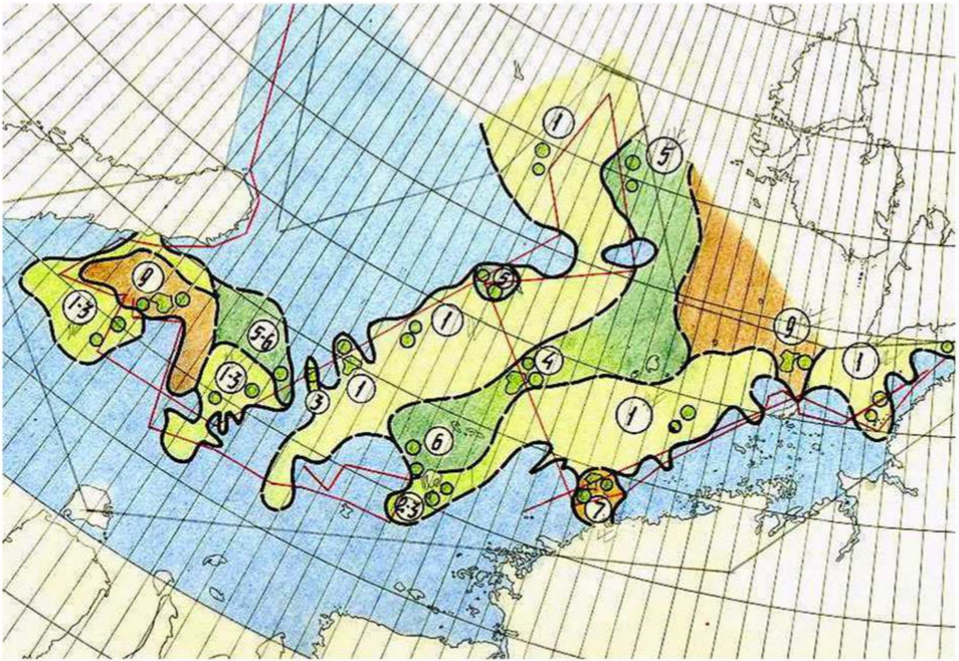
These new sources already existed as data compilations in one form or another before we got hold of them. But many needed digitisation and interpretation before the information could be incorporated into a long-term record. For example, below is one of the aerial survey maps from the Arctic and Antarctic Research Institute in Russia. The different colour shading indicates the coverage of sea ice.
Example of an early (August 1933) sea ice cover map compiled by the Arctic and Antarctic Research Institute (St. Petersburg, Russia). The shading colour indicates sea ice extent.


Example of an early (August 1933) sea ice cover map compiled by the 
Arctic and Antarctic Research Institute (St. Petersburg, Russia). The 
shading colour indicates sea ice extent. Credit: Walsh et al. (2016).
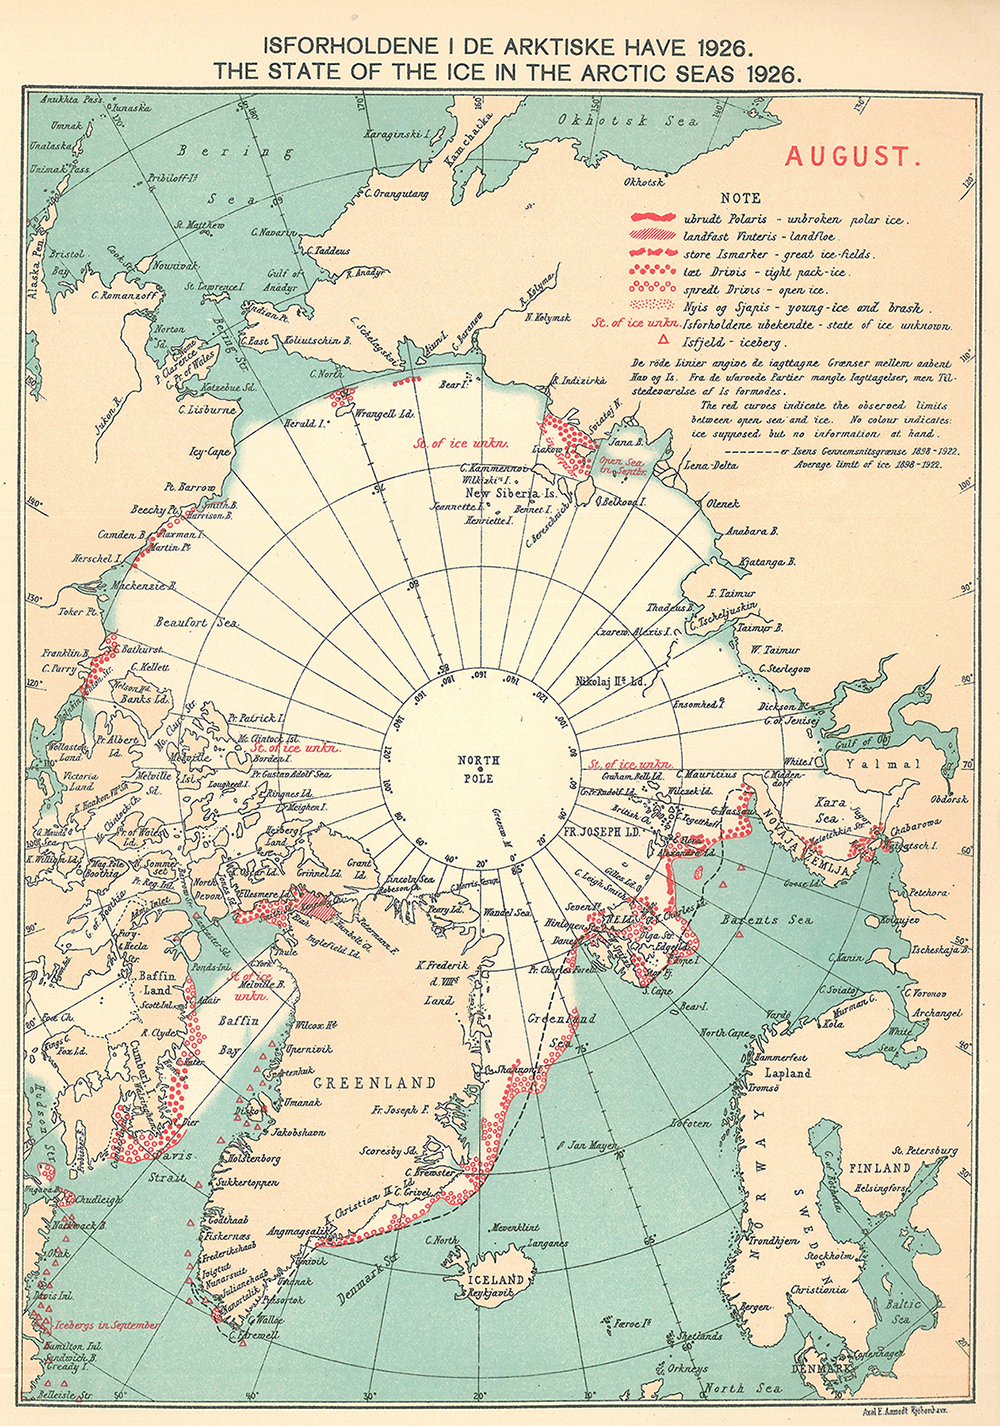
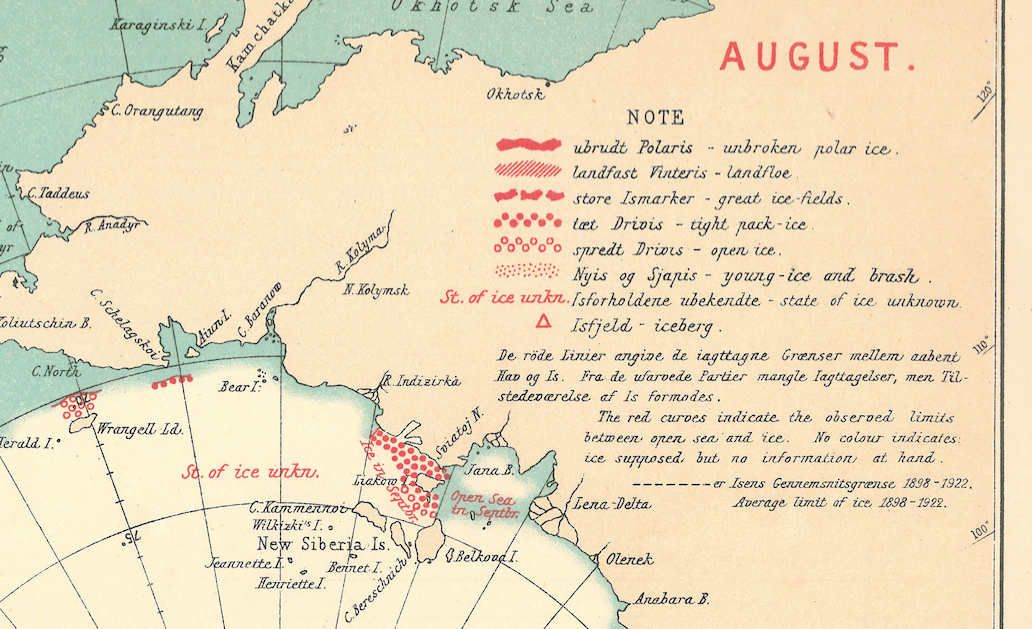
You can see another source of data below, this time one of the maps from the Danish Meteorological Institute. These are remarkable for their information value and because they represent a cooperative international effort to report ice conditions in a systematic way that was sustained over decades. The red symbols and terms in the legend (see close-up below the map) indicate the sea ice extent. “Tight pack-ice,” for example, indicates ice of 70% to 90% concentration of ice over the sea.
The state of the ice in the Arctic Seas in 1926


A Danish Meteorological Institute ice chart for August, 1926. 
The red symbols mark the location of observations recorded in 
ship logbooks. Source: Walsh et al. (2016).

Close-up view of the legend for the above sea ice chart


Close-up view of the legend for the above sea ice chart. Credit: Walsh et
al. (2016).
The result of all this work is our new dataset, “Gridded Monthly Sea Ice Extent and Concentration, 1850 Onwards.” This has a much more realistic representation of the year-to-year fluctuations in sea ice, as well as the long-term trend.
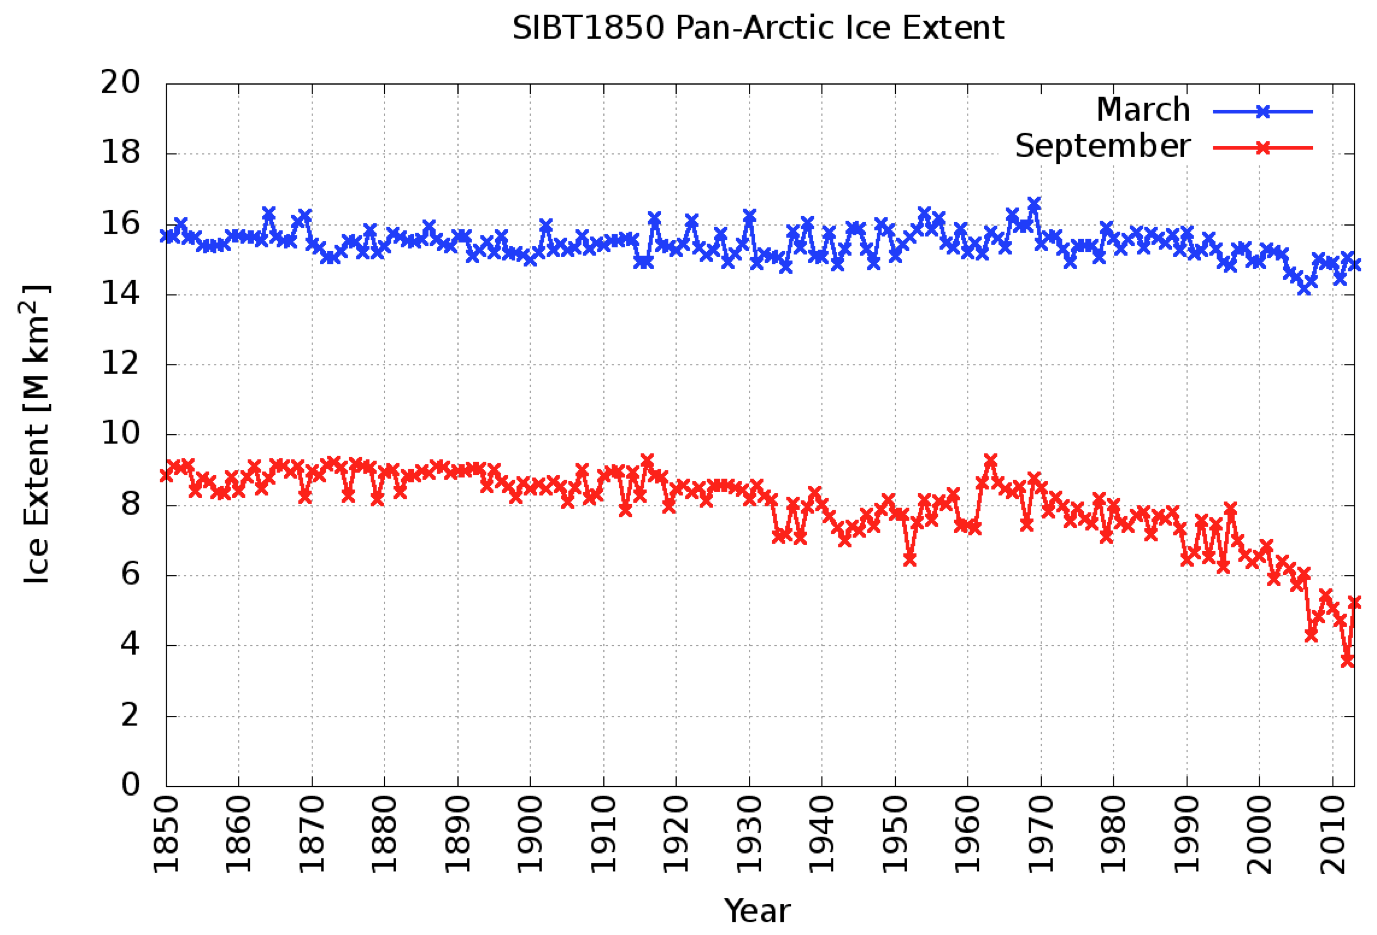
The charts below illustrate the new record. The blue line shows Arctic sea ice extent in March, at the end of the winter when the ice is at its annual maximum. The red line shows sea ice cover in September, at the end of the summer when ice extent shrinks to its yearly minimum.
Time series of Arctic sea ice extent, 1850-2013, for March (blue line) and September (red line).


Time series of Arctic sea ice extent, 1850-2013, for March (blue line) 
and September (red line). Credit: Walsh et al. (2016).
Most fundamentally of all, the new dataset allows us to answer the three questions we posed at the beginning of this article.
First, there is no point in the past 150 years where sea ice extent is as small as it has been in recent years. Second, the rate of sea ice retreat in recent years is also unprecedented in the historical record. And, third, the natural fluctuations in sea ice over multiple decades are generally smaller than the year-to-year variability.
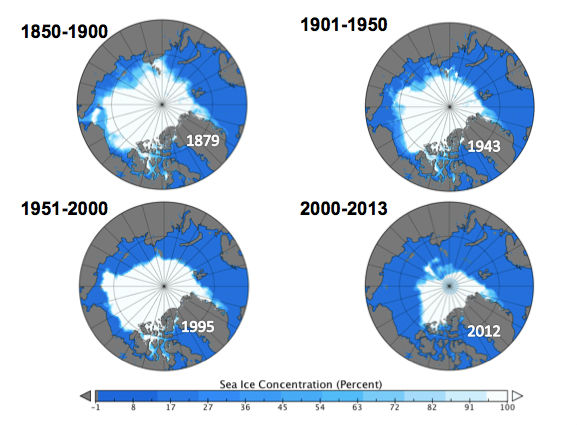
Sea ice cover maps for the annual minimum in September, for the periods 1850-1900, 1901-1950, 1951-2000, and 2001-2013. The maps show the sea ice extent in the lowest minimum during each period, which are: 1879, 1943, 1995, and 2012.
Sea ice cover maps for the annual minimum in September, for the periods 1850-1900, 1901-1950, 1951-2000, and 2001-2013. The maps show the sea ice extent in the lowest minimum during each period, which are in years: 1879, 1943, 1995, and 2012.
 
This guest article is based on the following journal paper: Walsh, J. E., Fetterer, F., Stewart, J. S. and Chapman, W. L. (2016) A database for depicting Arctic sea ice variations back to 1850. Geographical Review, doi:10.1111/j.1931-0846.2016.12195.x