Blog Archive

Showing posts with label Jason Box. Show all posts

Saturday, April 7, 2018

Algae, Impurities Darken Greenland Ice Sheet And Increases Melting

by Keith Cowing, SpaceRef, April 4, 2018


Impure Ice at Jakobshavn Isbrae on western Greenland. ©MODIS/NASA
The Dark Zone of Greenland ice sheet is a large continuous region on the western flank of the ice sheet; it is some 400 kilometers wide stretching about 100 kilometres up from the margin of the ice.
Some previous theories have attributed this darkening to water on top of the ice sheet - often seen as strikingly sapphire blue ponds, rivers and lakes. But a new study in Nature Communications provides a new hypothesis based on the character of the impurities on the ice surface itself.
"What we show is that the Dark Zone is covered in a finely distributed layer of dust, and black carbon, which provide nutrition for dark coloured algae. These are the main cause of the darkening," says professor Alun Hubbard, the co-author of the study and professor at CAGE (the Centre for Arctic Gas Hydrate, Environment and Climate at UiT, The Arctic University of Norway).
A dirt belt in the melt zone
The Dark Zone is literally a dirty belt of the melting area - the ablation zone - of the ice sheet. The darker this ablation zone is, the more of the sun's energy it absorbs, and the faster the ice melts.
Albedo is a measure of the reflectance of the ice sheet. It is the major factor governing how much incoming solar radiation is used to melt the ice and is the main positive feedback in Arctic climate change. Bright white surfaces, like snow or pure ice, reflect the sun's energy, but dark surfaces absorb it.
"The fact that a large portion of the western flank of the Greenland ice sheet has become dark means that the melt is up to five times as much as if it was a brilliant snow surface. " says Hubbard.
Algae - a major player
The ice algae seem to be one of the major players in this scheme - even the slight increase of the atmospheric temperature and liquid water production seems to promote algae colonization across the ice surface.
"The algae need nutrients and food, essentially dust, organic carbon, and water. In summer, these are plentiful and the algal bloom takes off. Because algae are dark in colour - they reinforce the dark zone. Thereby you get a positive feedback effect where the ice sheet absorbs even more solar radiation producing yet more melt."
Innovative drone study
The Dark Zone of the Greenland ice sheet is vast and previously observed by satellites such as MODIS. But for this study the scientists employed relatively modest drones - or unmanned aerial vehicles (UAV) - to survey the darkened ice belt in unprecedented detail.
While satellite data are great for the big picture of what's happening across the entire Greenland ice sheet, they only work at really coarse pixel resolutions.
"If we compare it to camera pixels, even the best satellites for the ice sheet imaging have resolution of tens of metres. They can't see the detail of what's happening on the ground. Our fixed-wing UAVs can take hundreds of images with pixel resolutions on the centimeter scale with an operating range of hundreds of kilometres," says Hubbard.
Scientists could see in real detail what the dark zone is made up of. In effect, this UAV survey across the ablation zone of the ice sheet perfectly bridges the gap between people on the ground studying what's under their feet in just one part of the ice sheet, and the satellite data that shows what's going on across the entire ice sheet.
"The UAV survey, with its amazing detail, allows us to identify and characterize all the different surface types and impurities across the entire dark zone, not just a small local little part of it."
The AUV images used in this study were collected by Johnny Ryan (Aberystwyth University, Brown University, University of California), Jason Box (GEUS) and Alun Hubbard (Aberystwyth University/CAGE) in the summer of 2014.
Please follow SpaceRef on Twitter and Like us on Facebook.

Friday, April 22, 2016

In honor of "Climate Babe" Katharine Hayhoe, we are initiating the "Climate Babe of the Month" with Dr Cara Augustenborg!

Since Climate Hunk of the Month laureate, Jason Box, has suggested that I recommence the Climate Hunk of the Month, and offered some nominees, it seemed to me long past time to include female scientists; thus, since Jason very kindly offered a selection, I am more than happy to begin with Cara Augustenborg!  Wow!  Check her out on YouTube!


And who better to name this award after than famous Climate Babe Katharine Hayhoe! [So named by the dastardly Rush Limbaugh, but we are going to own it and take back the narrative!]


When it comes to climate change communication who kicks denier behinds better than she does!

Here is more on April 2016's Climate Babe of the Month:


And, I must admit, I picked her name at random from the "seleção" (for non-Brazilians, non-Portuguese, and non-Italians, this word represents the national football -- oops! "soccer" for Yanks -- team members selected to play in the World Cup games), but she is perfect!

Check out her TEDx Talk!


Katharine, I'm seein' a soul sistah here for you!

Title1–16Cited byYear
Biochar and earthworm effects on soil nitrous oxide and carbon dioxide emissions
CA Augustenborg, S Hepp, C Kammann, D Hagan, O Schmidt, C Müller
Journal of environmental quality 41 (4), 1203-1209
292012
Farmers' perspectives for the development of a bioenergy industry in Ireland
CA Augustenborg, J Finnan, L McBennett, V Connolly, U Priegnitz, ...
GCB Bioenergy 4 (5), 597-610
172012
Requirements for an evolving model of supply chain finance: A technology and service providers perspective
MR Fellenz, C Augustenborg, M Brady, J Greene
Communications of the IBIMA 10, 227-235
152009
Carbon dioxide emissions from spring ploughing of grassland in Ireland
AB Willems, CA Augustenborg, S Hepp, G Lanigan, T Hochstrasser, ...
Agriculture, ecosystems & environment 144 (1), 347-351
132011
Response of silage yield to land application of out-wintering pad effluent in Ireland
CA Augustenborg, OT Carton, RPO Schulte, IH Suffet
Agricultural water management 95 (4), 367-374
62008
Effectiveness of self-identified and self-reported environmental regulations for industry: The case of stormwater runoff in the US
L Donald Duke, CA Augustenborg
Journal of Environmental Planning and Management 49 (3), 385-411
52006
Effectiveness Assessment of NPDES Regulations for Storm Water Discharges
CA Augustenborg, LD Duke
Proc. ASCE EWRI Conf.-Bridging the Gap: Meeting the World’s Water and ...
42001
Degradation of forestry timber residue over one growing season following application to grassland in Ireland
CA Augustenborg, OT Carton, RPO Schulte, IH Suffet
Journal of Sustainable Agriculture 31 (4), 171-183
32008
Silage Dry‐Matter Yield and Nitrogen Response following Land Application of Spent Timber Residue from Out‐Wintering Pads to Irish Grassland
CA Augustenborg, OT Carton, RPO Schulte, IH Suffet
Communications in soil science and plant analysis 39 (7-8), 1122-1137
22008
State and development of bioenergy in the Republic of Ireland
B Dieterich, J Finnan, T Hochstrasser, S Hepp, C Augustenborg, C Müller, ...
Aspects of Applied Biology 90, 27-34
22008
Impacts of soil moisture on trace gas emissions from grassland: a case study on grassland in Northern Ireland
S HeppA, C AugustenborgA, B DieterichA, T HochstrasserA, C MuellerA
19th World Congress of Soil Science, Soil Solutions for a Changing World, 1-6
12010
A systematic map protocol: What evidence exists to link agricultural practices with ecological impacts for Irish waterbodies?
DG Doody, CA Augustenborg, PJA Withers, S Crosse
Environmental Evidence 4 (1), 1
2015
Thanks to Our 2013 Reviewers
T Abichou, A Adeloye, P Adler, A Adviento-Borbe, ...
J. Environ. Qual 43, 1093-1100
2014
Nitrogen recycling for the sustainability of Irish agriculture
CA Augustenborg
Dissertation Abstracts International 68 (07)
2007
Polychlorinated biphenyls in surface runoff from agricultural fields in southern California.
IH Suffet, CA Augustenborg, JA Pedersen
ABSTRACTS OF PAPERS OF THE AMERICAN CHEMICAL SOCIETY 228, U548-U548
2004
Loadings of dissolved and particle-associated legacy and current-use organochlorine insecticides in surface runoff from agricultural fields in southern California.
IH Suffet, CA Augustenborg, JA Pedersen
ABSTRACTS OF PAPERS OF THE AMERICAN CHEMICAL SOCIETY 228, U604-U604


Sunday, April 3, 2016

"The implication of nonradiative energy fluxes dominating Greenland ice sheet exceptional ablation area surface melt in 2012," by Robert Fausto et al., GRL 43 (2016); doi: 10.1002/2016GL067720

Geophysical Research Letters, 43 (March 2016), DOI: 10.1002/2016GL067720

The implication of nonradiative energy fluxes dominating Greenland ice sheet exceptional ablation area surface melt in 2012

Robert Fausto, Dirk van As, Jason E. Box and Ruth Mottram

Abstract

During two exceptionally large, July 2012, multi-day, Greenland ice sheet, melt episodes, non-radiative energy fluxes (sensible, latent, rain, and subsurface collectively) dominated the ablation area surface energy budget of the southern and western ice sheet. On average, the non-radiative energy fluxes contributed up to 76% of daily melt energy at nine automatic weather station sites in Greenland. Comprising 6% of the ablation period, these powerful melt episodes resulted in 12–15% of the south and west Greenland automatic weather station annual ablation totals. Analysis of high resolution (~5 km) HIRHAM5 regional climate model output indicates widespread dominance of non-radiative energy fluxes across the western ablation area during these episodes. Yet HIRHAM5 still underestimates melt by up to 56% during these episodes due to a systematic underestimation of turbulent energy fluxes typical of regional climate models. This has implications for underestimating future melt, when exceptional melt episodes are expected to occur more frequently.

Introduction 

Understanding the Greenland ice sheet surface climate response is crucial for reducing uncertainties in future predictions of both magnitude and rate of global sea level change [Dutton et al., 2015] and freshwater flux [Lenaerts et al., 2015]. The rate of Greenland ice sheet mass loss has accelerated over the past decades [Tedesco et al., 2013; Khan et al., 2015], and in recent years, the surface components of the ice sheet’s mass budget have become the dominant source of ice loss, outpacing the ice dynamic component [Enderlin et al., 2014; Andersen et al., 2015]. Partly due to two exceptional melt episodes in July 2012, new records for ice sheet surface melt area and ice mass loss were set [Tedesco et al., 2013]. Satellite observations revealed more than 98% of the ice sheet surface was melting on 12 July 2012, which was unprecedented in the 1978 to present satellite record [Nghiem et al., 2012]. This widespread melt in the accumulation area was enhanced by low-level liquid clouds [Bennartz et al., 2013] promoted by the advection of anomalously warm and moist air over Greenland [Neff et al., 2014], which decreased the firn’s ability to retain meltwater [Machguth et al., 2016]. Deposition of wildfire black carbon further promoted melt through enhanced sunlight absorption [Keegan et al., 2014]. Projections suggest that such melt episodes will become increasingly frequent in coming decades [Collins et al., 2013; McGrath et al., 2013].

Friday, February 12, 2016

Peter Sinclair video: Paris Climate Agreement - A Good Start

by Peter Sinclair, Yale Climate Communications, February 10, 2016


I was at the American Geophysical Union Fall Meeting in San Francisco when news of the Paris agreement came through, so had the chance to collect fresh reactions from some of the best climate experts on the planet.

Generally, hopeful reactions, mixed with a warning.  And, Jeff Goodell of Rolling Stone on the difference between “should” and “shall.”

Link:  http://climatecrocks.com/2016/02/10/new-vid-scientists-on-the-paris-agreement/

Sunday, January 17, 2016

Mauri Pelto: What is Up in Disko-Uummannaq Bay, Greenland, January 9-16, 2016?

by Mauri Pelto, "From A Glacier's Perspective," January 17, 2016

@TenneyNaumer contacted Alun Hubbard, Jason Box and me with an astute observation last evening: “But what I am getting at is that in general the temperature anomalies over the region of Jakobshavn have been high in the last few days, and I spotted weird temperatures off the coast via Climate Reanalyzer (which is seriously low resolution).  I just checked with the manati satellite (also seriously low resolution), and it seems some sort of event has taken place.”
Following up on what are typically good observations from Tenney, I looked at the Radarsat-2 and Sentinel-1 imagery posted by the Danish Meteorological Institute.  Weather records from automatic weather stations in the region from PROMICE and the surface mass balance model results for the week from Polar Portal.
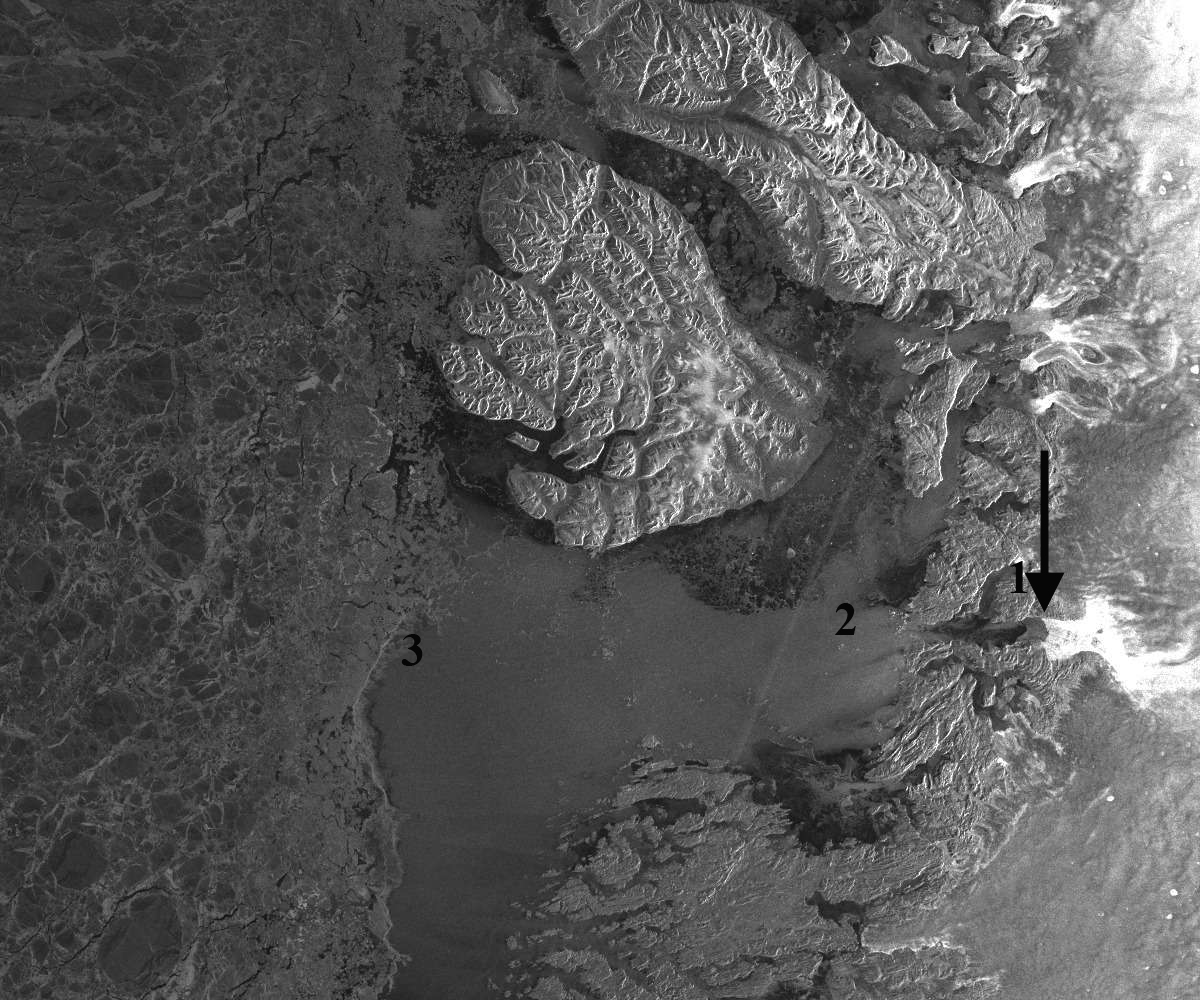
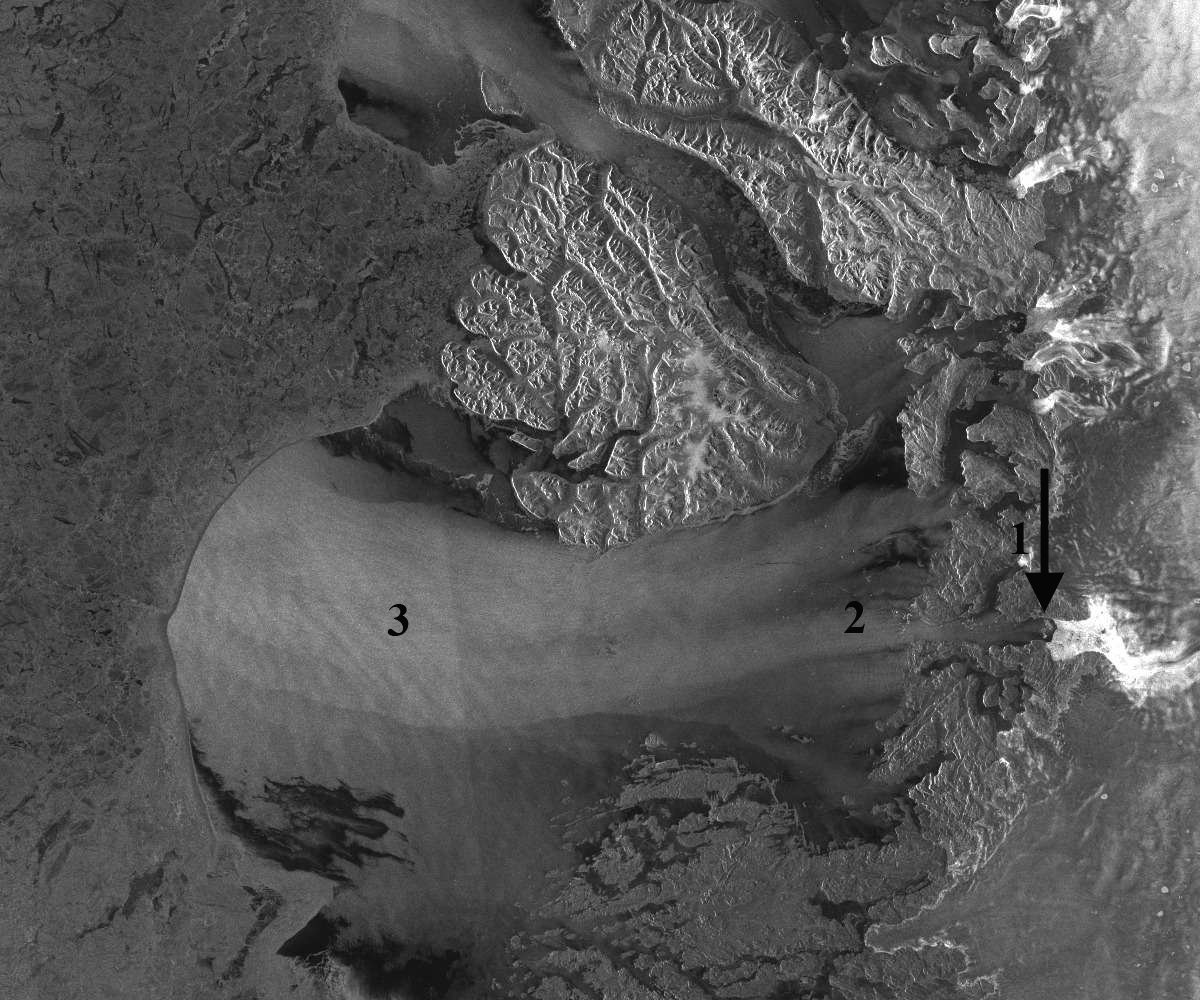
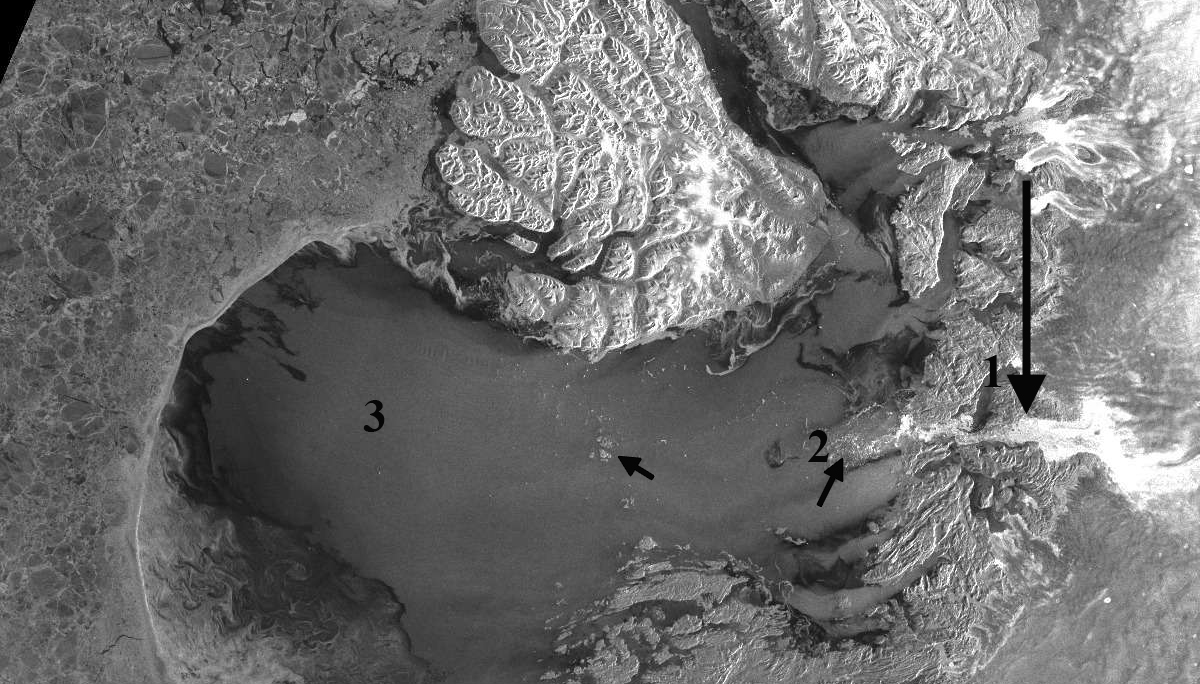
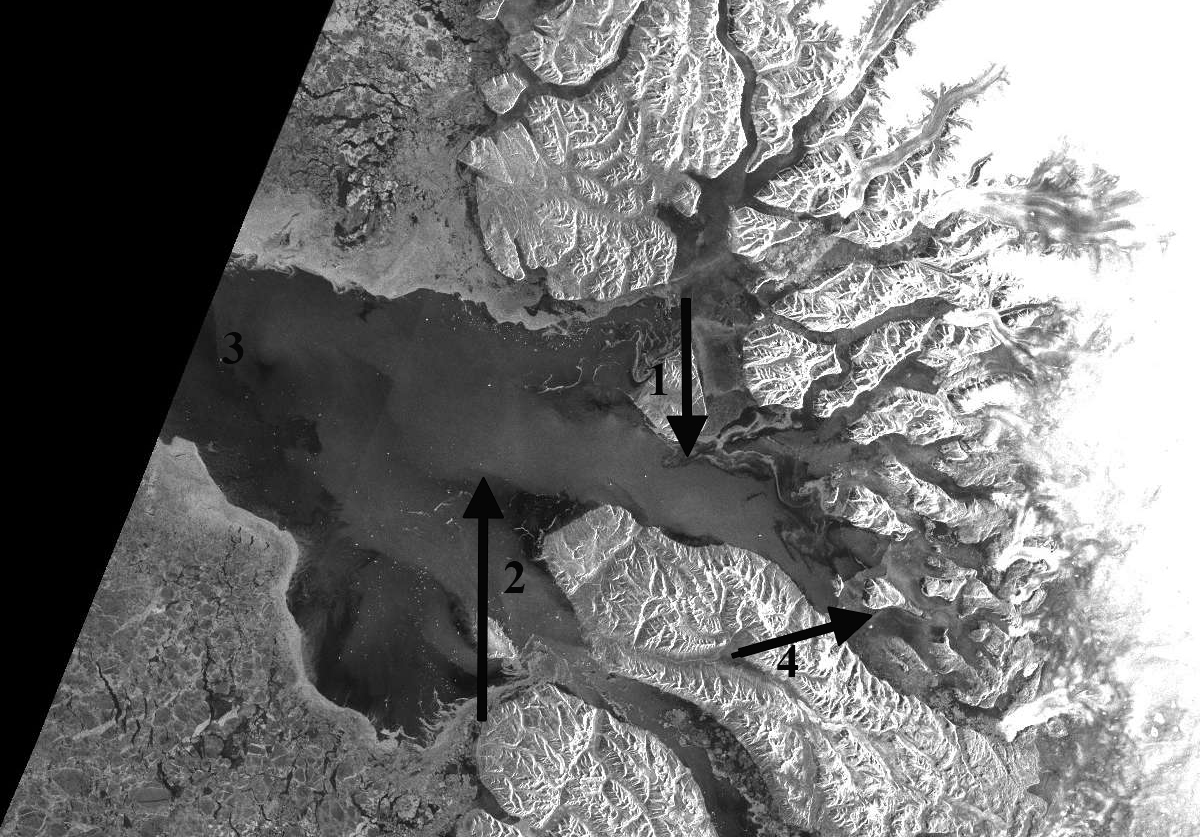
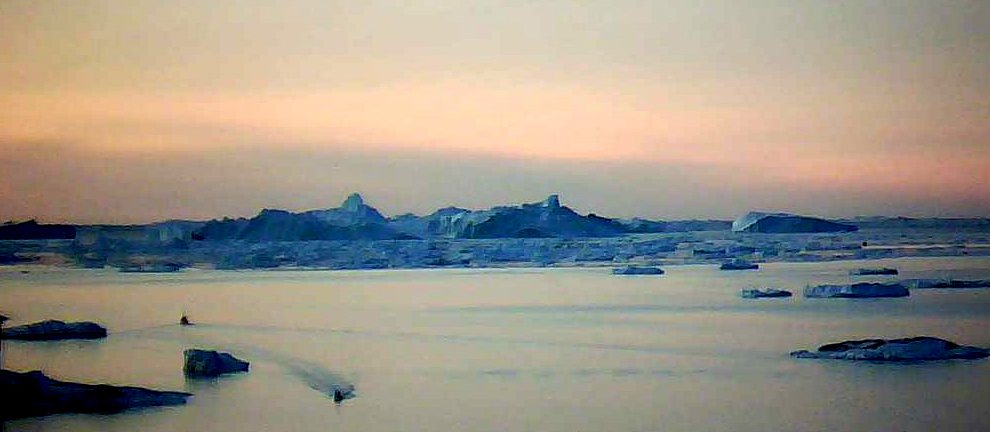
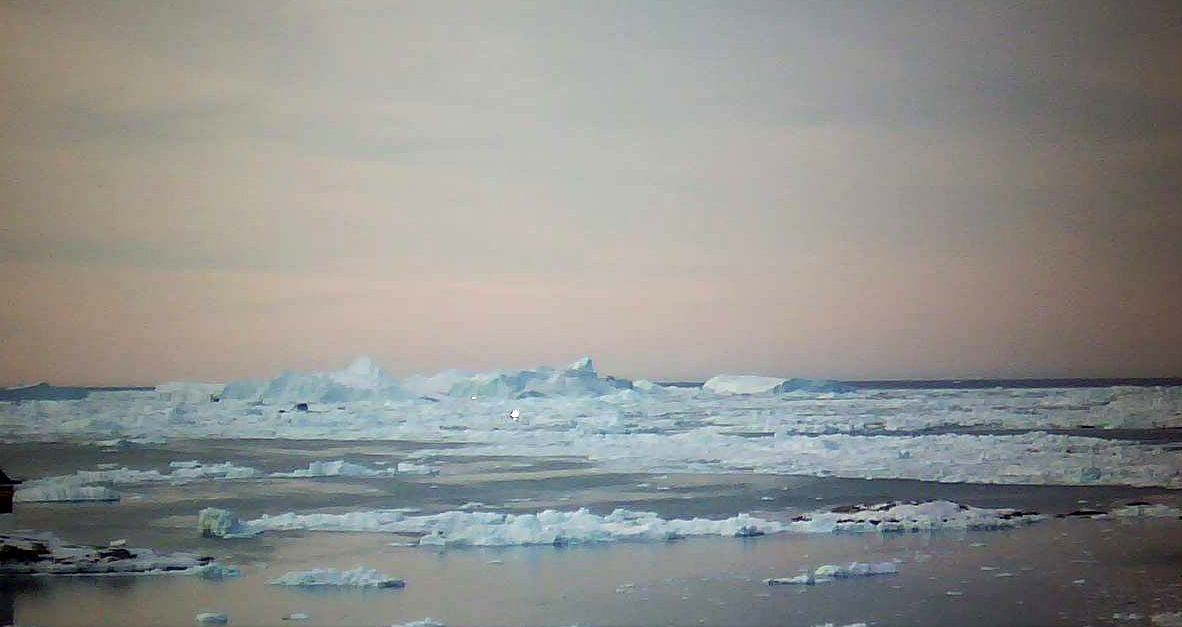
The arrow at location 1# is an area of sea ice across the fjord in front of Jakobshavn Glacier on January 9 that disappears by January 13. Location #2 is at the fjord mouth, and location #3 is at the sea front south of Disko Island on January 9.  There is no real cloud cover evident in any of images.  Maybe low-level fog in places. By January 11th, a plume is sweeping from Point 2 towards Point 3. Notice the sea ice in the fjord disappears by January 13th, and the ice front is pushed back in a concave fashion at Point #3. This indicates a clear push of water driving sea ice offshore. (The Ilulissat Fjord mouth lack of ice is also evident in Webcam images from 01/1/16 and 01/17/16 at the Hotel Arctic, with the last images, below, showing two boats plying the open water on the 16th and icebergs clogging the fjord mouth on the 17th.)  
The Sentinel-1 image from January 16th shows a significant flushing of icebergs from Ilulissat Fjord, pointed out by black arrows.  This image has better clarity and, with the icebergs scattered through the plume, indicate more clearly the plume is a water source change event, even if wind driven. The iceberg plume in the fjord has a brighter aspect due to the varied surface aspect-reflectance and has expanded down fjord.  The event must be due to or enhanced by strong offshore winds and @ruth_mottram indicates there was at least one foehn event [Readers, best to read what these are: https://en.wikipedia.org/wiki/Foehn_wind]. The plume indicates the ice melange in front of Jakobshavn has largely been removed.
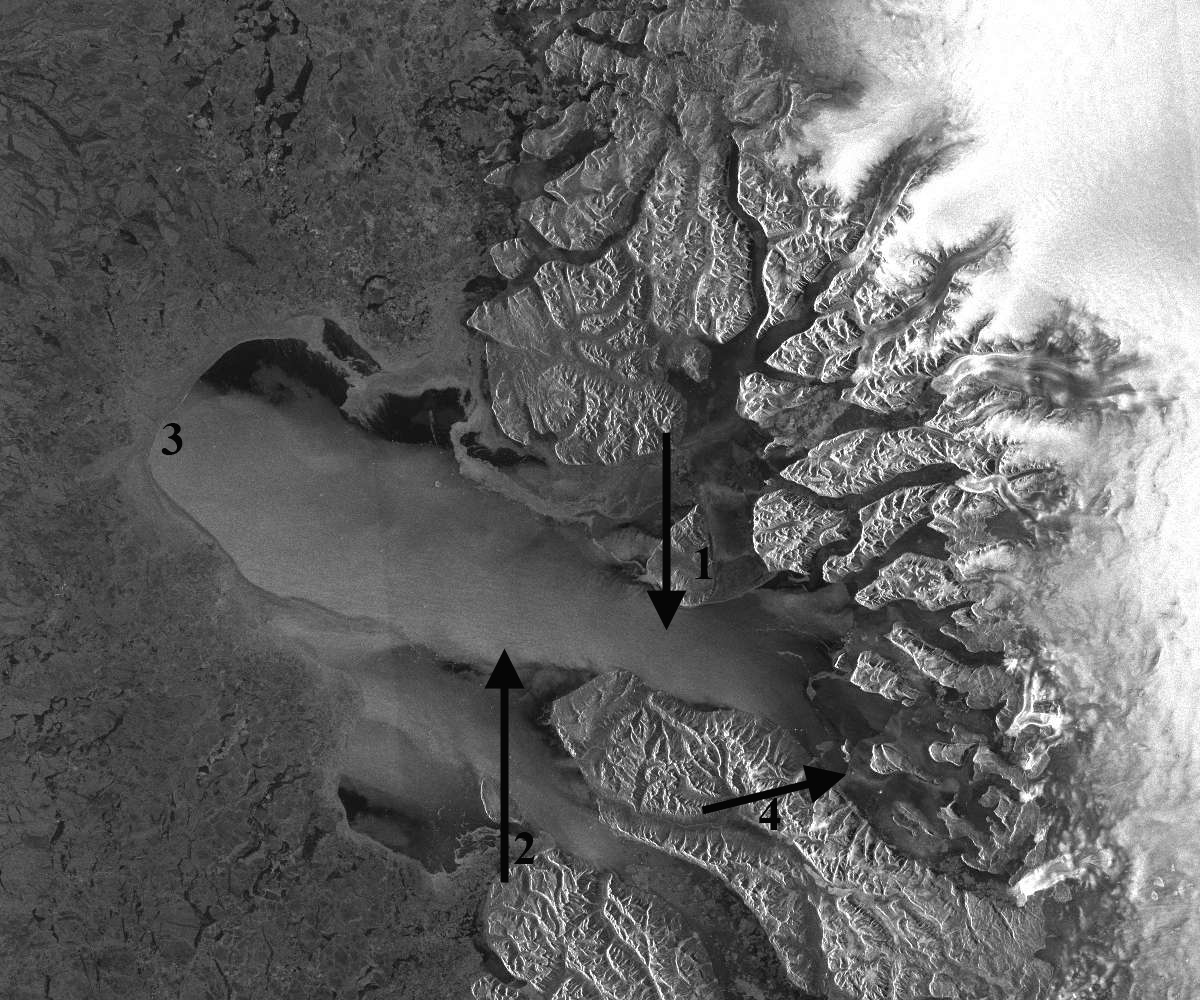
In Uummannaq Bay, a very similar sequence plays out; note on January 9 the sea ice connecting islands near #4.  By January 13th, the ice at location #4 is gone.  The ice front is now at location #3, which on January 9th was well into the ice pack.  Again, we have a clear push of water leading to a concave sea ice front that is pushed well offshore. Icebergs can be seen amidst plume on January 16th; the plume opacity and size has diminished since January 13th.
In both of the January 13th images, there is a plume leading to the concave sea ice front, the question being is this sediment-laden water, with the resultant higher reflectivity, or is it a combination of a surface water change from wind or a combination? Jason Box suggests it is aeration of the surface water from the strong offshore winds. The ice must in part be driven back by a surface water push. You can see icebergs in sections of the plumes closer to shore suggesting this is a surface near surface phenomenon. This is a short-term event.  However, it could have broader implications; Moon et al. (2015) indicate the importance of a rigid ice melange at the front of tidewater outlet glaciers in Greenland.  In this case, the ice melange in front of Jakobshavn has been removed, and probably from in front of other glaciers. I look forward to further insights from the community.
20160109s01disko
RADARSAT-2 image of Disko Bay, 01/09/2016.

20160111rs02disko
RADARSAT-2 image of Disko Bay, 01/11/2016.

20160113rs02disko
RADARSAT-2 image of Disko Bay, 01/13/2016.

20160116disko
Sentinel-1 imagery of Disko Bay, 01/16/16. Notice expanded brightness area in the fjord by #1.

20160109s01uummann
 Sentinel 1 imagery of Uummannaq Bay, 01/09/2016.

20160113rs02umman
RADARSAT-2 image of Uummannaq Bay MODIS, 01/13/2016.

20160116s01uumann
Sentinel 1 imagery of Uummannaq Bay, 01/13/2016, with plume size and opacity diminishing. 

illusiat webcam 1-16-2016
Ilulissat Fjord mouth webcam view, 01/16/16.

ilulissat webcam11-17-16
Ilulissat Fjord mouth webcam view, 01/17/16.


x

Sunday, November 22, 2015

Extraordinary runoff from the Greenland Ice Sheet in 2012 amplified by hypsometry and depleted firn-retention by A. B. Mikkelson et al., The Cryosphere Discuss., 9 (2015) 4625-4660; doi: 10.5194/tcd-9-4625-2015

The Cryosphere Discuss., 9 (2015) 4625-4660; doi: 10.5194/tcd-9-4625-2015

Extraordinary runoff from the Greenland Ice Sheet in 2012 amplified by hypsometry and depleted firn-retention

A. B. Mikkelsen1,2, A. Hubbard3,4, M. MacFerrin5, J. Box6, S. Doyle4, A. Fitzpatrick4, B. Hasholt1, and H. Bailey4
1Department of Geosciences and Natural Resource Management, University of Copenhagen, Copenhagen, Denmark
2Centre for Permafrost (CENPERM), University of Copenhagen, Øster Voldgade 10, Copenhagen, 1350, Denmark
3Centre for Arctic Gas Hydrate, Environment and Climate, Department of Geology, University of Tromsø, Dramsveien 201, 9037, Norway
4Department of Geography and Earth Sciences, Aberystwyth University, Aberystwyth, SY23 3DB, UK
5Cooperative Institute for Research in Environmental Sciences (CIRES), University of Colorado, Boulder, CO, USA
6Department of Marine Geology and Glaciology, Geological Survey of Denmark and Greenland, Copenhagen, Denmark

Abstract


It has been argued that the infiltration and retention of meltwater within firn across the percolation zone of the Greenland ice sheet has the potential to buffer up to ~3.6 mm of global sea level rise (Harper et al., 2012). Despite evidence confirming active refreezing processes above the equilibrium line, their impact on runoff and proglacial discharge has yet to be assessed. Here we compare meteorological, melt, firn-stratigraphy and discharge data from the extreme 2010 and 2012 summers to determine the relationship between atmospheric forcing and runoff across the Kangerlussuaq catchment of the Greenland ice sheet, which drains into Watson River. The bulk discharge in 2012 of 6.8 km3 exceeded that of 2010 of 5.3 km3 by 28%, despite only a 3% difference in net energy available for melt between the two summers. This large disparity in discharge response can be explained by a 24% contribution of runoff originating from above the long-term equilibrium line in 2012, triggered by diminished firn retention that culminated in three days of record discharge from 11 July of 3,100 m3 s−1 (0.27 km3 d−1) that washed-out the Kangerlussuaq bridge. 


Throughout the 2010 melt-season, there was a steady increase in the residual difference between integrated melt over the catchment and cumulative proglacial discharge that by mid-September equated to 21% (~1.1 km3) of the total melt generated being retained within the catchment. In 2012, a similar pattern is observed until 11 July, after which the residual fell by 50% and further diminished so that less than 0.4 km3 (~5 %) of the total melt was retained by the end of the summer. Cumulative energy receipts versus bulk discharge further indicate a marked contrast between the two melt seasons, such that in 2012 there was a notably higher discharge response per unit energy forcing after the 11 July. 


Density profiles from cores and pits within the accumulation area acquired in April 2012 reveal an extensive, dense, ice-layer between 0.9 to 1.4 m snow depth that extended from the equilibrium line to at least 1,840 m elevation. This perched superimposed ice layer can be attributed to melt refreezing during previous summers and we hypothesize that in July 2012, it provided a barrier to further infiltration rendering the underlying pore space inaccessible thereby forcing extensive runoff from the accumulation zone. Discharge was further amplified by catchment hypsometry, leading to a disproportionate increase in the area contributing to runoff as the melt-level rose above the ice sheet plateau in July 2012. Satellite imagery and oblique aerial photographs confirm an active network of supraglacial rivers extending 140 km from the ice margin providing strong support for the hypothesis. 


Our findings substantiate active infiltration processes across the percolation zone of the Greenland ice sheet, though the resulting patterns of refreezing are complex and can lead to spatially extensive, perched, superimposed layers within the firn. In 2012, such layers extended to 1,840 m, providing a low-permeable obstruction to further meltwater storage, thereby promoting runoff into the hydrological system that contributed directly to sea-level rise.


Citation: Mikkelsen, A. B., Hubbard, A., MacFerrin, M., Box, J., Doyle, S., Fitzpatrick, A., Hasholt, B., and Bailey, H.: Extraordinary runoff from the Greenland Ice Sheet in 2012 amplified by hypsometry and depleted firn-retention, The Cryosphere Discuss., 9 (2015) 4625-4660; doi:10.5194/tcd-9-4625-2015.

http://www.the-cryosphere-discuss.net/9/4625/2015/tcd-9-4625-2015.html

Wednesday, September 9, 2015

Jason Box: Earth's Ice Is Melting Much Faster Than Forecast. Here's Why That's Worrying

GREENLAND GLACIER

by Jason Box, Professor of Glaciology, Geological Survey of Denmark and Greenland, Huffington Post, September 4, 2015

COPENHAGEN -- For me it was only after 8 years of studying Greenland -- installing and maintaining a network of on-ice climate stations and examining how much snow evaporates from the island -- that I suddenly realized glaciology textbooks needed a major revision. This was in 2002. Prior to the epiphany, conventional knowledge held that the ice sheet was frozen at its bed, and so the reaction time of the ice sheet to climate warming was measured in tens of thousands of years. A heck of a long time.
Climate warming had just infiltrated Greenland glaciology in earnest. Summer melt water, it turned out, drains down quickly to the bed, lubricating the glacier's flow. Suddenly we realized an expanding melt season meant the ice sheet would be sliding faster, longer. It was not to be the only time our philosophy got hit with a major surprise that connected the ice sheet with climate change and the threat of abrupt sea level rise.
The next one came in 2006.
Somehow all marine-terminating glaciers across the southern half of Greenland doubled in speed simultaneously between 2000 and 2005. [Readers, this news is what caused me to begin this blog -- I had the one and only epiphany in my life when I read about this.] We didn't yet know why.
In the meantime, scientists tried defining a plausible upper limit for the contribution to sea level rise from Greenland's ice. That was at a time when surging glacier speeds -- ice flow -- was thought to be the dominant conveyer of ice loss, and would be for the foreseeable future. Well, surprise! It became clear that for six years in a row, starting in 2007, ice loss from surface meltwater runoff took over the lead position in the competition for biggest loser.  [This was something I thought privately at the time -- that this must occur eventually, but I did not imagine that it would occur so soon. I never bought into the idea that the topography was a limit on glacial outflow and thus would restrain Greenland's contribution to sea level rise.] From 2007 to 2012, nearly each summer set higher and higher melt records, owing to persistent and unforeseen weather that by 2012 would become a signature of climate change.
The competition between how much ice is lost through glacier flows into fjords versus meltwater runoff is intimately synergistic with meltwater interacting with ice flow all along the way. Increasing melt sends more water down through the ice sheet, softening the ice so it flows faster. Once at the bed the water lubricates flow. Squirting out the front of glaciers into the sea, the meltwater drives a heat exchange that undercuts glaciers, promoting calving, loss of flow resistance and faster flow. Put it this way: in Washington, DC, to know what's happening, you follow the money; in Greenland you follow the meltwater.
Put it this way: in Washington, DC, to know what's happening, you follow the money; in Greenland you follow the meltwater.
Glaciologists became oceanographers when they realized, in 2008, the trigger effect for galloping glaciers was warm pulses of subtropical waters that undermine glaciers at great depth in the sea, at the grounding lines where this warm water can invade.
Indeed, ocean warming is arguably the climate change story. The planetary energy imbalance due to the enhanced greenhouse effect is loading far more heat into the oceans than the atmosphere or land. The world is 70% ocean-covered. after all. While there were signs of a warming hiatus in air temperatures from 1998 to 2012, the ocean continued to heat up, an equivalent of four Hiroshima bombs, per second, all day, every day. The increase is continuing as we load the atmosphere with CO2.
The fundamental climate heating issue is a problem of too much of a good thing. The natural greenhouse effect -- a good thing -- keeps temperatures tolerable at night. But it has been enhanced by more than a century of people externalizing the environmental costs of stupendous economic growth, loading the atmosphere now with 42% more carbon dioxide, 240% more methane, 20% more nitrous oxide, 42% more tropospheric ozone, etc. We have far too much gaseous carbon compounds now in our atmosphere, people. The carbon pollution is, by the way, making our oceans too acidic, threatening the base of the marine food chain. Would someone step forward and deny the changing ocean chemistry? Do I digress?
We have far too much gaseous carbon compounds now in our atmosphere, people.
The key question, as I see it, is how to project what the sea level will soon be due to ice sheet melting. But this is confounded by us not really knowing what to expect. We keep being surprised by nature being more sensitive and complex. As the science develops, we see more interconnection, where multiplying feedbacks produce surprisingly fast responses.
Will there be some saving self-regulation of human-induced climate warming and its melting land ice consequences? The enormous increase of heat in our oceans, from past decades of enhanced greenhouse effect, negates any hope that negative feedbacks or even solar output will prevent a much warmer world. The few negative feedbacks we have found for ice -- like more snow as a result of a warming climate, more reflective frost, more efficient sub-glacial water transmission -- are clearly being outdone. And at the global scale, despite some negative feedbacks like more clouds, clearly we are not seeing net cooling. Feedbacks, whether positive or negative, only do their thing after the initial effect. Negative feedbacks don't reverse the perturbation.
Seemingly the biggest issue with abrupt sea level rise comes from the now-unstoppable loss of key sectors of West Antarctic ice and the discovery of more marine instability than we thought elsewhere. Like glaciers thinning rapidly in East Antarctica. Or in Greenland, where improved bedrock maps reveal a marine connection an average of 40 kilometers further inland than previously thought. Or like how new fjord underwater mapping reveals greater fjord depths, increasing the odds that deep warm ocean water can communicate with more Greenland glaciers than previously thought. Surprise, surprise, surprise.
I'd say we are in for more surprises.
If the past decade of scientific inquiry is any indication, I'd say we are in for more surprises. That notion is further supported by the fact that the climate models used for projecting future temperatures lack key processes that likely reinforce warming or the effects of warming, not regulate it.
Despite decades of progress by many clever scientists engaged with climate modeling, climate models used to inform policymakers don't yet encode key pieces of physics that have ice melting so fast. They don't incorporate thermal collapse -- ice softening due to increasing meltwater infiltration.
Climate models also don't yet incorporate increasing forced ocean convection at the ocean fronts of glaciers that forces a heat exchange between warming water and ice at the grounding lines.
Climate models don't yet include ice algae growth that darkens the bare ice surface.
Climate models don't yet prescribe background dark bare ice from outcropping dust on Greenland from the dusty last ice age.
Climate models don't include increasing wildfire delivering more light-trapping dark particles to bright snow-covered areas, yielding earlier melt onset and more intense summer melting.
As a result of some of these factors and probably some as yet unknown others, climate models have under-predicted the loss rate of snow on land by a factor of four and the loss of sea ice by a factor of two.
Climate models also don't yet sufficiently resolve extended periods of lazy north-south extended jet streams that produce the kind of sunny summers over Greenland (2007-2012 and 2015) that resulted in melting that our models didn't foresee happening until 2100.
While individual climate models come close to observations on this or that piece of the complex big picture, what ends up in global assessment reports intended to help guide policy decisions and national discussions of climate change are very conservative averages of dozens of models that don't include the latest, higher sensitivity physics.
So, alas, when it comes to ice, how fast it can go and how fast the sea will rise, if I were a betting man, I'd put my money on it going faster than forecast.