Blog Archive

Showing posts with label Abrupt Climate Change -- ACC. Show all posts

Saturday, February 16, 2019

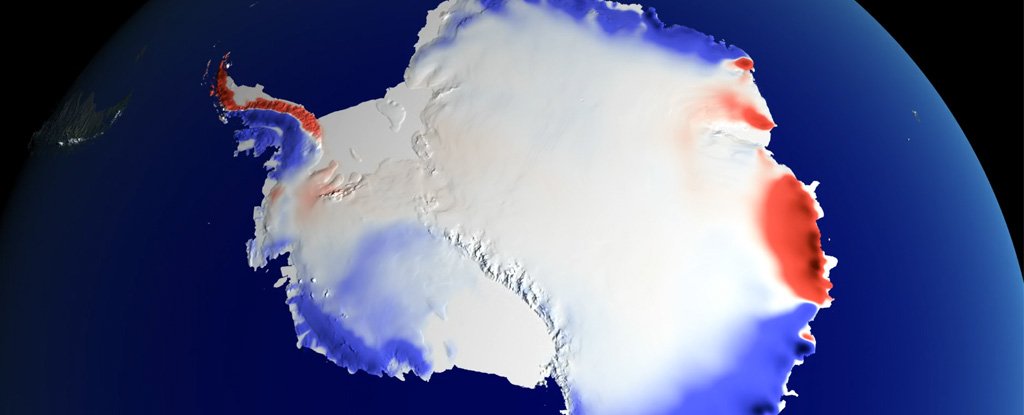
Chris Mooney, WaPo: Earth Is 'Missing' at Least 20 Ft of Sea Level Rise. Antarctica Could Be The Time Bomb

main article image

by Chris Mooney, The Washington Post, February 12, 2019

Some 115,000 years ago, Homo sapiens were still living in bands of hunter gatherers, largely confined to Africa. We still shared the globe with the Neanderthals, although it's not clear we had met them yet.

And though these various hominids didn't know it, the Earth was coming to the end of a major warm period. It was one that's quite close to our current climate, but with one major discrepancy - seas at the time were 20 to 30 feet (6 to 9 metres) higher.
During this ancient period, sometimes called the Eemian, the oceans were about as warm as they are today.
And last month, intriguing new research emerged suggesting that Northern Hemisphere glaciers have already retreated just as far as they did in the Eemian, driven by dramatic warming in Arctic regions.
The finding arose when a team of researchers working on Baffin Island, in northeastern Canada, sampled the remains of ancient plants that had emerged from beneath fast-retreating mountain glaciers.
And they found that the plants were very old indeed, and had probably last grown in these spots some 115,000 years ago.
That's the last time the areas were actually not covered by ice, the scientists believe.
"It's very hard to come up with any other explanation, except that at least in that one area where we're working ... the last century is as warm as any century in the last 115,000 years," said Gifford Miller, a geologist at the University of Colorado in Boulder who led the research on Baffin Island.
But if Miller is right, there's a big problem. We have geological records of sea levels from the Eemian. And the oceans, scientists believe, were 20 to 30 feet (6 to 9 metres) higher.
Some extra water likely came from Greenland, whose ice currently contains over 20 feet (6 metres) of potential sea level rise. But it couldn't have been just Greenland, because that entire ice sheet did not melt at the time.
That's why researchers also suspect a collapse of the most vulnerable part of Antarctica, the West Antarctic ice sheet. This region could easily supply another 10 feet (3 metres) of sea level rise, or more.
"There's no way to get tens of meters of sea level rise without getting tens of meters of sea level rise from Antarctica," said Rob DeConto, an Antarctic expert at the University of Massachusetts.
Trying to understand how Antarctica will fall
Scientists are now intensely debating precisely which processes could have played out then — and how soon they'll play out again. After all, West Antarctica has already been shown, once again, to be beginning a retreat.
Some researchers, including DeConto, think they have found a key process - called marine ice cliff collapse - that can release a lot of sea level rise from West Antarctica in a hurry.
But they're being challenged by another group, whose members suspect the changes in the past were slow - and will be again.
To understand the dispute, consider the vulnerable setting of West Antarctica itself.
Essentially, it's an enormous block of ice mostly submerged in very cold water. Its glaciers sit up against the ocean in all directions, and toward the center of the ice sheet, the seafloor slopes rapidly downward, even as the surface of the ice sheet itself grows much thicker, as much as two miles thick in total.
As much as a mile and a half of that ice rests below the sea level, but there is still plenty of ice above it, too.
So if the gateway glaciers start to move backward - particularly a glacier named Thwaites, by far the largest of them - the ocean would quickly have access to much thicker ice.
The idea is that during the Eemian, this whole area was not a block of ice at all, but an unnamed sea. Somehow, the ocean got in, toppling the outer glacial defenses, and gradually setting all of West Antarctica afloat and on course to melting.
DeConto, with his colleague David Pollard, built a model that looked to the Eemian, and another ancient warm period called the Pliocene, to try to understand how this could happen.
In particular, they included two processes that can remove glaciers. One, dubbed 'marine ice sheet instability,' describes a situation in which a partially submerged glacier gets deeper and thicker as you move toward its center.
In this configuration, warm water can cause a glacier to move backward and downhill, exposing ever thicker ice to the ocean - and thicker ice flows outward faster.
So the loss feeds upon itself.
Marine ice sheet instability is probably underway already in West Antarctica, but in the model, it wasn't enough. DeConto and Pollard also added another process that they say is currently playing out in Greenland, at a large glacier called Jakobshavn.
Jakobshavn is moving backward down an undersea hill slope, just in the way that it is feared the much larger Thwaites will drift. But Jakobshavn is also doing something else. It is constantly breaking off thick pieces at its front, almost like a loaf of bread, dropping slice after slice.
That's because Jakobshavn no longer has an ice shelf, a floating extension that used to grow out over the ocean at the front of the glacier and stabilize it. The shelf collapsed as Greenland warmed in the past two decades.
As a result, Jakobshavn now presents a steep vertical front to the sea. Most of the glacier's ice is under the water, but more than 100 meters (330 feet) extend above it - and for DeConto and Pollard, that's the problem. That's too much to be sustained.
Ice is not steel. It breaks. And breaks. And breaks.
This additional process, called 'marine ice cliff collapse,' causes an utter disaster if you apply it to Thwaites. If Thwaites someday loses its own ice shelf and exposes a vertical front to the ocean, you would have ice cliffs hundreds of meters above the surface of the water.
DeConto and Pollard say that such cliffs would continually fall into the sea. And when they added this computation, it not only recreated Eemian sea level rise, it greatly increased their projection of how much ice Antarctica could yield in this century - more than three feet.
Since there are other drivers of sea level rise, like Greenland, this meant that we could see as much as six feet in total in this century, roughly double prior projections. And in the next century, the ice loss would get even worse.
"What we pointed out was, if the kind of calving that we see in Greenland today were to start turning on in analogous settings in Antarctica, then Antarctica has way thicker ice, it's a way bigger ice sheet, the consequences would be potentially really monumental for sea level rise," DeConto said.
Moreover, the process, he argues, is essential to understanding the past - and thus how we could replicate it.
"We cannot recreate six meters of sea level rise early in the Eemian without accounting for some brittle fracture in the ice sheet model," said DeConto.
A massive debate over marine ice cliffs
Tamsin Edwards is not convinced. A glaciologist at Kings College London, she is lead author - with a number of other Antarctic experts - of a study published Wednesday in Nature (the same journal that published DeConto and Pollard in 2016) that disputes their model, in great detail.
Using a statistical technique to examine the results, Edwards and her collaborators find that the toppling of ice cliffs is not necessary to reproduce past warm periods after all.
They also present lower sea level rise possibilities from Antarctica in this century. If they're right, the worst case is back down to about 40 centimeters, or a little over a foot, rather than three to four feet.
"Things may not be as absolutely terrible as that last study predicted," Edwards said. "But they're still bad."
It is a new science, she said, and without more modeling it's unclear how ice cliffs will ultimately affect sea level rise.
But then what happened in the Eemian? Edwards thinks it just took a long time to lose West Antarctica. That it wasn't fast. After all, the entire geologic period was thousands of years long.
"We're an impatient lot, humans, and the ice sheets don't respond in a decade, they're slow beasts," she said.
DeConto says he's learned something from the critique.
"The Edwards study does illustrate the need for more in-depth statistics than we originally applied to our 2016 model output, but the models are evolving rapidly and they have already changed considerably since 2016," he said in a written statement.
But he's not backing down on marine ice cliffs. The new critique, DeConto said, implies that "these processes aren't important for future sea level rise. And I think to me, that's kind of a dangerous message."
He certainly has his allies. Richard Alley, a well known glaciologist at Penn State University who has published with DeConto and Pollard, wrote in an email that "cliff retreat is not some strange and unexpected physical process; it is happening now in some places, has happened in the past, and is expected wherever sufficiently high temperatures occur in ocean or air around ice flowing into the ocean."
The Eemian - but worse?
There's one important thing to consider - the Eemian occurred without humans emitting lots of greenhouse gases.
Atmospheric carbon dioxide was far lower than it is today. The event was instead driven by changes in the Earth's orbit around the sun, leading to more sunlight falling on the northern hemisphere.
The big difference, this time around, is that humans are heating things up far faster than what is believed to have happened in the geologic past.
And that makes a key difference, said Ted Scambos, an Antarctic researcher who is leading the US side of an international multimillion dollar mission to study Thwaites Glacier, and who is a senior researcher at the National Snow and Ice Data Center in Colorado.
"The current pace of climate change is very fast," Scambos said, and the rate of warming might cause glaciers to behave differently than they did in the past.
Accordingly, Scambos says he sees the current debate as fruitful - "it's the discussion that needs to happen" - but that it doesn't lessen his worry about the fate of Thwaites Glacier if it retreats far enough.
"There's no model that says the glacier won't accelerate if it gets into those conditions," said Scambos. "It just has to."
Humans were nowhere near the Antarctic in the Eemian - and we have never, in the modern period, seen a glacier as big as Thwaites retreat. It's possible something is going to happen that we don't have any precedent or predictions for.
Just last week, for instance, scientists reported a large cavity opening beneath one part of the glacier - something they said models could not have predicted.
There is a massive stake involved now in at least trying to figure out what could happen - before it actually does. It will help determine whether humans, now organized and industrialized and masters of fossil fuels, are poised to drive a repeat of our own geological history.
2019 © The Washington Post

Friday, December 16, 2016

Huge 20-Year Build up of Arctic Fresh Water May Flood North Atlantic & Stall Gulf Stream

by FishOutOfWater, DailyKos, December 13, 2016

http://www.whoi.edu/cms/images/Figure-3-for-BG-FWC-results_432873.jpg

"Figure 3 Time series of freshwater content in different layers of the Beaufort Gyre region. Blue bars depict total liquid freshwater content. Black bars show freshwater content in sea ice. Yellow bars – freshwater content in the mixed layer, red bars – in the Pacific and green bars – in the Atlantic water layer. Freshwater content is shown in thousand cubic kilometers. Upper left bars shows total annual freshwater flux into the Arctic Ocean from all rivers; green and black small bars show errors in liquid and sea ice freshwater content estimates. All freshwater contents are calculated relative to 34.8 reference water salinity." The build up in volume from 2002 to 2015 is about the volume of Lake Michigan which stores 4,918 cubic km of water.

Huge volumes of fresh water have been building up over the past 20 years in the Arctic waters north of Alaska. A volume the size of Lake Michigan built up from 2003 through the end of 2015. Before the 1990s, there were regular cycles of fresh water build up and release within decades as periods of high pressure north of Alaska were followed by periods of stormy weather. Scientists suspect that over the past 20 years large amounts of melt water from Greenland’s glaciers have changed the dynamics of the North Atlantic ocean and the Arctic atmosphere. Since the 1990s, a dome of high pressure has persisted in the Beaufort sea and the anticyclonic winds have pumped fresh water towards the high’s center building up a mound of relatively fresh water over a huge area north of Alaska. The primary source of the fresh water is rivers that flow into the Arctic. Over the past several decades, sea ice melting has added about 20%  to the increase of fresh water in the Beaufort sea.
The freshwater content of the Beaufort gyre  increased by a volume the size of lake Michigan from the 1970s to 2008.
The freshwater content of the Beaufort gyre  increased by a volume the size of lake Michigan from the 1970s to 2008.
A major 2008 report by a team of scientists led by Wood’s Hole oceanographer Andrey Proshutinsky found an increase of 5000 km3 of fresh water from the 1970s to 2008. www.whoi.edu/…
From 2008 to 2015 an additional 2000 km3 was added so the total increase in fresh water is 7,000km3. The total volume of the world’s second largest lake by volume, Lake Michigan, is just under 5,000km3.
Preliminary data from the BGOS 2008 cruise indicate that the FWCL in the BG continued to rise in 2008 and reached 21,000 km3– a historical maximum from all available years of observations. Compared to 1970s climatology (the pre-90s decade with the most extensive data coverage, (Figure 1) there has been a FWCL increase in the BG of approximately 5,000 km3. This is comparable with the volume of fresh water annually delivered to the Arctic Ocean by rivers and through Bering Strait (5700 km3 per year, Serreze et al., [2006]).
The freshwater layer in the Beaufort sea deepened by 3 meters - about 10 feet from 2003 to 2007. Because the Beaufort gyre covers a large area, this is a huge volume of fresh water. Persistent high pressure in 2007 caused Siberian and North American river water and water from a massive melt of sea ice to flow into this Arctic sea north of Alaska.
The freshwater layer in the Beaufort sea deepened by 3 meters - about 10 feet from 2003 to 2007. Because the Beaufort gyre covers a large area, this is a huge volume of fresh water. Anticyclonic winds associated with persistent high pressure in 2007 caused Siberian and North American river water and water from a record melt of sea ice in 2007 to flow into this Arctic sea north of Alaska.
The persistent anticyclonic Beaufort high pressure builds up a mound of water under it because the direction of a mass of water moves to the right of the wind  direction in the northern hemisphere because  the rotation of the earth gives the water spin. See this post at Neven’s sea ice blog by an Arctic oceanographer for details. neven1.typepad.com/...
On the other hand, cyclonic rotation associated with low pressure areas causes water to well up from below the center of the low. Thus  years of high pressure followed by  years of storminess cause moderate periodic surges of fresh water from the Arctic to the north Atlantic ocean. It was like the Arctic breathed in fresh water then breathed it out in a period of a decade or less. The largest observed freshwater surge called the “Great Salinity Anomaly” happened in the early 1970’s.
The Great Salinity anomaly was one of the likely causes of the brutal American winters of the 1970s. Fresh water tends to float over denser warm salty Gulf Stream water in sub-Arctic seas of the north Atlantic. This keeps the warm salty water from releasing its heat to the atmosphere and sinking thousands of feet into the deep Atlantic. This disruption of the thermohaline circulation is popularly called slowing down the Gulf Stream. The deep overturning circulation brings Gulf Stream water to the subarctic seas, warming Europe and north America. When deep water formation slows brutal winters tend to follow.  This effect, combined with the reflective effects of growing levels of sulfuric acid pollution over the north Atlantic in the 1960s and 1970s caused cold north American and European winters  in those decades. This cool period that broke up the trend of greenhouse gas caused global warming that has been ongoing since the turn of the twentieth century has been intentionally misinterpreted by climate change deniers to confuse politicians and the public about climate change.
Winters were miserably cold in Minnesota and the central and eastern U.S. in the 1970s.
Last spring, following the extremely abrupt collapse of the winter polar vortex in a sudden stratospheric warming a very intense Beaufort high developed driving more fresh water into the gyre. The strong high pressure in the sunny spring months melted out the ice early. Midwinter high pressure under dark skies is favorable for ice growth but under the bright long sunny days of May the ice melted and the water took up enormous amounts of heat. That warm water then opened up the ice plugged channels between the islands of northernmost Canada. If high pressure breaks down now the thick plugs of multi-year ice that used to block the channels won’t be there to impede the fresh water from draining out to the north Atlantic. The largest channels have a thin ice cover.
Arctic scientists fear that a large volume of the stored fresh water could be rapidly released, drastically impacting the northern hemisphere’s weather. earthobservatory.nasa.gov/...
As I said back in my first blog entry, one of the key objectives of the expedition was to produce an up-to-date assessment of the freshwater content of the Beaufort Gyre. Based on a preliminary analysis of the data collected on this cruise, my colleagues reckon the total freshwater content of the Gyre could be at a record high. A chemical analysis of the ocean surface suggests that sea ice melt contributed around 20 percent of the fresh water mixed up within the surface waters, compared to around 80 percent from Canadian and Russian rivers flowing into the Arctic. The sea ice contribution was thought to be neutral a few decades ago, but the ice is now melting more than it’s growing, as we clearly witnessed, causing an imbalance. The wind circulation is also important in driving the ocean circulation that sucks in fresher surface waters into the Gyre (see an earlier blog of mine for more details).
Why does this all matter? Well, some scientists posited that the Beaufort Gyre oscillates between periods of spinning up and sucking in freshwater, and spinning down and releasing fresh water. A kind of breathing, if you like. The Gyre has been spinning up and sucking in fresh water for a few decades now (2008 saw a big increase) and we keep waiting, with similarly bated breath, for this trend to reverse. If the Gyre does reverse (breathe out), the Arctic Ocean will likely dump a load of fresh water into the Atlantic Ocean (as we think it did in the 1970s), which could cause some big impacts on weather patterns across the Northern Hemisphere. We’re not expecting a scene out of The Day After Tomorrow, but we’re not entirely sure what could happen either.
This dark half of the Arctic year has been by far the warmest to date on record and storms have repeatedly slammed the sea ice to record lows while pulling in heat from both the Atlantic and Pacific oceans. If this stormy weather continues, the fresh water dome will break down and the fresh water rapidly drain towards the north Atlantic through the channels of the Canadian archipelago and through the Fram strait east of northern Greenland.
The weather forecast for the next 10 days by the European model is insane. Deep lows will pull massive amounts of heat into the Arctic, which will keep sea ice extent and volume at record low levels for the date and will work to spin down the currents that keep the dome fresh water in the Beaufort sea.
5 day ECMWF weather forecast shows storms entering the Arctic from both the Atlantic and Pacific. The winds will bring enormous amounts of  atmospheric heat, taken from the Atlantic and Pacific oceans into the Arctic.
5 day ECMWF weather forecast shows storms entering the Arctic from both the Atlantic and Pacific. The winds will bring enormous amounts of atmospheric heat, taken from the Atlantic and Pacific oceans, into the Arctic.
The weather pattern developing in the Arctic is the pattern that has drained the fresh water form the Beaufort gyre in the past. Extremely deep lows are moving from the Atlantic into the Arctic. Low pressure is dominating the region from the Atlantic’s subarctic seas to the Arctic ocean. If this pattern continues through this winter, a volume of fresh water greater than lake Michigan could be set in motion towards the north Atlantic and the overturning circulation could stall when the light fresh water caps the Labrador sea. This could cause the Gulf Stream itself to slow while heat would build up in tropical oceans.
Extreme low pressure is forecast by the ECMWF model to cover the Arctic and north Atlantic in 7 days.
Scientists and Arctic observers are shocked by this year’s extraordinarily warm Arctic weather but the sudden release of fresh water to the Atlantic could cause a sudden shift to much colder winter weather towards the end of the decade. This is a very unpredictable situation, but Greenland ice cores show that rapid, extreme climate oscillations may be triggered by north Atlantic salinity cycles. www.atmosp.physics.utoronto.ca/…
We may be entering a period of extreme climate chaos.

Sunday, November 29, 2015

Study finds evidence for a climate-change regime shift in the 1980s

Climate study finds evidence of global shift in the 1980s

Anthropogenic warming, volcanic eruption sparked biggest change in 1,000 years


from ScienceDaily, November 24, 2015

Summary:  Planet Earth experienced a global climate shift in the late 1980s on an unprecedented scale, fueled by anthropogenic warming and a volcanic eruption, according to new research. Scientists say that a major step change, or 'regime shift,' in Earth's biophysical systems, from the upper atmosphere to the depths of the ocean and from the Arctic to Antarctica, was centered around 1987, and was sparked by the El Chichón volcanic eruption in Mexico five years earlier.
Volcano (stock image). Human-made warming and volcanic eruption in the 1980s fuelled the biggest change in 1,000 years, say scientists.
Credit: © beppulos / Fotolia
Planet Earth experienced a global climate shift in the late 1980s on an unprecedented scale, fuelled by anthropogenic warming and a volcanic eruption, according to new research published this week.
Scientists say that a major step change, or 'regime shift,' in Earth's biophysical systems, from the upper atmosphere to the depths of the ocean and from the Arctic to Antarctica, was centred around 1987, and was sparked by the El Chichón volcanic eruption in Mexico five years earlier.
Their study, published in Global Change Biology, documents a range of associated events caused by the shift, from a 60% increase in winter river flow into the Baltic Sea to a 400% increase in the average duration of wildfires in the Western United States. It also suggests that climate change is not a gradual process, but one subject to sudden increases, with the 1980s' shift representing the largest in an estimated 1,000 years.
Philip C. Reid, Professor of Oceanography at Plymouth University's Marine Institute, and Senior Research Fellow at the Sir Alister Hardy Foundation for Ocean Science (SAHFOS), is the lead author of the report, Global impacts of the 1980s' regime shift.
"We demonstrate, based on 72 long time-series, that a major change took place in the world, centred on 1987, that involved a step change and move to a new regime in a wide range of Earth systems," said Professor Reid.
"Our work contradicts the perceived view that major volcanic eruptions just lead to a cooling of the world. In the case of the regime shift it looks as if global warming has reached a tipping point where the cooling that follows such eruptions rebounds with a rapid rise in temperature in a very short time. The speed of this change has had a pronounced effect on many biological, physical and chemical systems throughout the world, but is especially evident in the Northern temperate zone and Arctic."
Over the course of three years, the scientists -- drawing upon a range of climate models, using data from nearly 6,500 meteorological stations, and consulting innumerable scientists and their studies round the world -- found evidence of the shift across a wide range of biophysical indicators, such as the temperature and salinity of the oceans, the pH level of rivers, the timing of land events, including the behaviour of plants and birds, the amount of ice and snow in the cryosphere (the frozen world), and wind speed changes.
They detected a marked decline in the growth rate of CO2 in the atmosphere after the regime shift, coinciding with a sudden growth in land and ocean carbon sinks -- such as new vegetation spreading into polar areas previously under ice and snow. And they found that the annual timing of the regime shift appeared to have moved regionally around the world from west to east, starting with South America in 1984, North America (1985), North Atlantic (1986), Europe (1987), and Asia (1988).
These dates coincide with significant shifts to an earlier flowering date for cherry trees around Earth in Washington, DC, Switzerland, and Japan and coincided with the first evidence of the extinction of amphibians linked to global warming, such as the harlequin frog and golden toad in Central and South America.
Second author Renata E. Hari, Eawag, Dübendorf, Switzerland, said: "The 1980s regime shift may be the beginning of the acceleration of the warming shown by the IPCC. It is an example of the unforeseen compounding effects that may occur if unavoidable natural events like major volcanic eruptions interact with anthropogenic warming."

Story Source:
The above post is reprinted from materials provided by University of Plymouth. The original item was written by Andrew Merrington. Note: Materials may be edited for content and length.

Journal Reference:
  1. Philip C. Reid, Renata E. Hari, Grégory Beaugrand, David M. Livingstone, Christoph Marty, Dietmar Straile, Jonathan Barichivich, Eric Goberville, Rita Adrian, Yasuyuki Aono, Ross Brown, James Foster, Pavel Groisman, Pierre Hélaouët, Huang-Hsiung Hsu, Richard Kirby, Jeff Knight, Alexandra Kraberg, Jianping Li, Tzu-Ting Lo, Ranga B. Myneni, Ryan P. North, J. Alan Pounds, Tim Sparks, René Stübi, Yongjun Tian, Karen H. Wiltshire, Dong Xiao, Zaichun Zhu. Global impacts of the 1980s regime shiftGlobal Change Biology, 2015; DOI: 10.1111/gcb.13106

Saturday, November 14, 2015

"COP-21 is ignoring huge danger": Press Release by the Arctic Methane Emergency Group

PRESS RELEASE by the Arctic Methane Emergency Group, AMEG
November 2015

Transforming to a safer world

COP-21 is ignoring huge danger

COP-21 will not save humanity from catastrophic climate change and metres of sea level rise, if they continue to rely on IPCC assessments.

The world expects IPCC to ensure the safety of future generations, by producing realistic assessments of the dangers from climate change and by giving good advice to governments on how to deal with these dangers and prevent catastrophe.  But IPCC has absolutely failed in their obligation, under UNFCCC Article 2, to give adequate warning of the planetary emergency resulting from past and continued anthropogenic interference on two counts: excess CO2 in the atmosphere; and an Arctic soon to become seasonally free of sea ice.

Removing excess CO2

IPCC have consistently understated the dangers from global warming and ocean acidification arising from excess CO2 in the atmosphere.  A safe, sustainable target level for CO2 concentration has not been established, as required by UNFCCC Article 2; and other constraints, such as a limit on ocean acidification, rate of sea level rise and Arctic warming, have not been established either.

It is cogently argued by leading climate expert, Professor James Hansen, that the limit for CO2 should be set at 350 ppm or below.  It will require a massive effort in carbon dioxide removal to achieve this level within a few decades.  A similar limit on CO2 is required to avoid excessive ocean acidification, which, in combination with global warming, is already causing coral reefs to die.  By ignoring the dangers of ocean acidification, the whole marine food chain has been put at risk. 

IPCC has set a carbon budget of around 1000 gigatons of carbon for total allowed CO2 emissions, of which they say about half has been spent, leaving a remaining budget of less than 500 gigatons to achieve the 2 degrees target.  But other greenhouse gases together add 75% to the climate forcing from CO2.  This means that the CO2eq level is around 490 ppm.  If allowance is also made for climate forcing from black carbon and albedo loss, then it appears that the budget has already been used up.  The IPCC has failed to do the necessary calculations to establish the real position on carbon budget and what has to be achieved to have a good chance of preventing dangerous interference with the climate system, as UNFCCC require IPCC to establish.

Emissions reduction by itself will not remove CO2 from the atmosphere. While focussing on emissions reduction IPCC have been ignoring the urgency and immensity of the task to remove excess CO2 from the atmosphere, which will require a revolution in agriculture, forestry and marine management to put carbon in the ground and improve food production at the same time.  Any delay in getting started on these revolutions will increase the risk of disaster in decades to come.

It is proposed that the funding of the CO2 removal initiative should come from a carbon levy on fossil fuel producers.  This would provide justice, in that the people who benefit from taking carbon out of the ground would be paying for the carbon to be returned to the ground.  The levy would be ramped up until the CO2 level starts to fall towards the target 350 ppm.

Preventing the Arctic Ocean becoming seasonally free of sea ice

But, more serious still than the problem of excess CO2, IPCC has failed to acknowledge the dangers arising from rapid Arctic warming and the rapid decline of Arctic sea ice.  The Arctic Ocean could become seasonally free of sea ice within a few years.  This rapid decline is the real “elephant in the room”.  The sea ice has provided a reflective surface to keep the Arctic cool, maintain permafrost and stabilise our planet’s temperature, sea level and climate.  Now the sea ice is declining to a much lower level, and IPCC is ignoring the implications.

Because of this glaring omission from IPCC reports, it may soon be too late to prevent the Arctic getting locked into a state of low sea ice and rapid warming, from which there will be no escape.  Continued rapid warming will inevitably lead to several absolute catastrophes for the world:

  • accelerated meltdown of the Greenland Ice Sheet to give metres of sea level rise within decades;
  • accelerated meltdown of permafrost, releasing vast quantities of the potent greenhouse gas, methane, which both accelerates the Arctic warming in a positive feedback loop and counters attempts to limit global warming to a safe level;
  • destabilisation of the planet’s climate system, giving ever worse weather extremes compounded by global warming and El Niño events.
Conclusion

In brief, humanity faces a planetary emergency from precipitous decline of Arctic sea ice as well as from an excess of CO2 in the atmosphere.  COP-21 must now prepare to take the necessary interventions. 

Our condemnation of IPCC assessment reports is not idle speculation or doom-mongering but based on the best available scientific evidence.  There now has to be a strenuous, focussed and determined effort to find solutions to these problems and make the necessary interventions.  Of particular urgency, the Arctic has to be cooled such as to prevent further decline of sea ice.   This is a significant engineering challenge.  Any delay risks the passing of a point of no return, whereby the challenge becomes impossible.

By facing up to the truth of the situation, means can surely be found to avoid catastrophe, using mankind’s collective intelligence, technology and vast resources. 

All nations must now work together to stave off the huge threats facing our civilisation. 

Submitted on behalf of the Arctic Methane Emergency Group, 5 November 2015
By John Nissen, chair AMEG (www.ameg.me)

Email: johnnissen2003@gmail.com

More at AMEG's website at:  http://ameg.me/

Tuesday, October 27, 2015

SHOW THIS TO EVERYONE: NYT's INCREDIBLE ARTICLE ON THE DISINTEGRATION OF GREENLAND'S ICE SHEET

Dear Readers,

I don't know if the link will open for you if you are not a subscriber, but I suspect it will.

As shocking and dramatic as this report on Greenland's rapidly melting and disintegrating ice sheet is, everyone should see it and show it to all their friends and contacts.

I have never seen anything that shows what is going on in Greenland like this report.

At the very end, there is another video.  Near the end, you can see in the lower right hand corner where the surface has even collapsed due to a sub surface channel.  I had already heard of some much larger collapses due to the draining of subsurface lakes within the ice.

Link: http://www.nytimes.com/interactive/2015/10/27/world/greenland-is-melting-away.html?_r=0

Saturday, April 18, 2015

Sea levels along the Northeast rose 4-5 inches in just 2 years

NEW YORK SHORE

by James Gerken, Huffington Post, February 27, 2015

Sea levels across the Northeast coast of the United States rose nearly 3.9 inches between 2009 and 2010, according to a new study from researchers at the University of Arizona and the National Oceanic and Atmospheric Administration. The waters near Portland, Maine, saw an even greater rise -- 5 inches -- over the two-year period.
While scientists have been observing higher sea levels across the globe in recent decades, the study found a much more extreme rise than previous averages. Such an event is "unprecedented" in the history of the tide gauge record, according to the researchers, and represents a 1-in-850 year event.
"Unlike storm surge, this event caused persistent and widespread coastal flooding even without apparent weather processes," the study's authors wrote. "In terms of beach erosion, the impact of the 2009-2010 [sea level rise] event is almost as significant as some hurricane events."
The analysis relied on data from dozens of tide gauges along the eastern seaboard. The nearly 4-inch rise for the Northeast represents the average of 14 tide gauges located between New York and Canada. Tide gauges farther south in the Mid-Atlantic and Southeast indicated a sea level rise far less extreme in 2009 and closer to average in some areas. The jump occurred most quickly between April 2009 and March 2010.
The study found that the increase in the Northeast was caused by a 30% slowdown in a major ocean current system known as the Atlantic meridional overturning circulation (AMOC) and a fluctuation in atmospheric pressure at sea level. The Gulf Steam is one component of the AMOC, which moves warm water northward in the upper levels of the Atlantic.
2014 study of the AMOC over that period found the slowdown also contributed to severe winter conditions in northwestern Europe and the intensity of the 2010 Atlantic hurricane season, which was the third-most active on record.
The U.N.'s Intergovernmental Panel on Climate wrote in its latest report that AMOC currents are "very likely" to weaken in the 21st century. Models project that unusual rises in sea level, like that observed in the study, will be bigger and more frequent along the Northeastern seaboard this century, study coauthor Jianjun Yin told The Huffington Post.
And events like the one observed in the study, combined with ongoing global sea level rise, "will pose an even higher coastal flooding risk," Yin told Mashable.
A 2012 study determined that sea levels between North Carolina and Boston are rising at a rate three to four times faster than the global average. Yet this only represents a rise of 2-3.7 mm/yr year since 1980, far less than the 100 millimeters observed in the Northeast between 2009 and 2010.
This week's study, published in Nature Communications, follows a new report from the New York City Panel on Climate Change that warns of significant sea level rise and coastal flooding threats for the city in coming decades. Sea levels in New York City have already risen more than a foot since 1900, and the trend is very likely to accelerate: If greenhouse gas emissions from human activities are not curtailed, the panel projects seas to rise by an additional 11-21 inches by the middle of the century, by 18-39 inches by the 2080s, and by as much as 6 feet by the end of the century.

Wednesday, October 1, 2014

Why Greenland is likely to melt much more quickly

Scientists who have examined the role of the bedrock on which the Greenland ice sheet rests think it shows the huge island is more vulnerable than realised to global warming

by Tim Radford, Climate News Network, October 1, 2014

LONDON - Climate scientists have thought a little more deeply about the state of the Greenland ice sheet and their conclusions are ominous.

They think that the northern hemisphere’s largest assembly of ice and compacted snow is more vulnerable to climate change than anybody had previously thought.

Marion Bougamont of the Scott Polar Research Institute in Cambridge, UK, and colleagues report in Nature Communications that they factored in not just a mathematical model of the melting ice from Greenland, but also the role of the soft, yielding and absorbent mud and rock beneath.

The Greenland ice sheet is the planet’s second largest body of terrestrial ice. It covers 1.7 million square kilometres and if it were all to melt, the world’s sea levels would rise by more than seven metres.

Right now, about 200 gigatonnes of Greenland ice a year turn to water and run into the sea. This alone raises sea levels at the rate of 0.6 millimetres a year. In fact the increase in sea levels from all causes – glacier retreat worldwide, ice cap melting and ocean thermal expansion -  is now 3 mm a year.

Researchers have repeatedly found evidence of an acceleration of melting, in some cases by looking at what is happening within the ice or on the surface, or by taking a new look at satellite data.

Less stable

But the latest calculation goes even deeper: into the mud below the ice. According to the new model, and to evidence from surveys, melting will be complicated by the conditions deep under the ice.

The ice sheets are moving, naturally and at different speeds, causing the ice to shear or flow, and the assumption has always been that the ice is flowing over hard and impermeable rock. A closer look suggests a different process.

Lakes of summer meltwater tend to form on the ice sheet surface: if the ice below fractures, these lakes can drain in a matter of hours. The meltwater flows down within the ice, and into the sediment below it.

“The soft sediment gets weaker as it tries to soak up more water, making it less resistant, so that the ice above moves faster. The Greenland ice sheet is not nearly as stable as we think,” said Poul Christofferson, a co-author.

And Dr Bougamont said: “There are two sources of net ice loss: melting on the surface and increased flow of the ice itself, and there is a connection between these mechanisms that isn’t taken into account by standard ice sheet models.”

Rapid change

At present, the annual flow of ice meltwater is more or less stable. In warmer years, the ice sheet becomes more vulnerable because more meltwater gets to the muddy absorbent bedrock. Because there is a limit to how much the sediment below can hold, the ice sheet becomes more vulnerable during extreme events such as heat waves.

And, of course, if under such a scenario it is vulnerable, it continues to become more vulnerable as average temperatures rise and extreme events become more frequent, and more extreme. And a closer look at recent geological history shows just how fast change can happen.

In a separate study in Nature Communications, Katharine Grant of the Australian National University and colleagues report that they examined evidence of the melting process at the close of each of the last five ice ages.

They looked at data from wind-blown dust in sediment cores from the Red Sea, and matched these with records from Chinese stalagmites to confirm a picture of pronounced climate change at the end of each ice age, and calculated that sea levels rose at the rate of 5.5 metres per century.

These however were exceptional events, and there were more than 100 smaller sea level events in between the big five.

“Time periods with less than twice the modern global ice volume show almost no indications of sea level rise faster than about 2 metres per century,” said Dr Grant. “Those with close to the modern amount of ice on Earth show rates of up to one to 1.5 metres per century.” 

Thursday, July 24, 2014

"Synchronization of North Pacific and Greenland climates preceded abrupt deglacial warming," by S.K. Praetorius & A.C. Mix, Science 345 (2014); doi: 10.1126/science.1252000

Science, 345(6195) (25 July 2014) 444-448; doi: 10.1126/science.1252000

Synchronization of North Pacific and Greenland climates preceded abrupt deglacial warming  

Summer K. Praetorius* and Alan C. Mix

College of Earth, Ocean, and Atmospheric Sciences, Oregon State University, Corvallis, OR 97331, U.S.A.

Abstract

Some proposed mechanisms for transmission of major climate change events between the North Pacific and North Atlantic predict opposing patterns of variations; others suggest synchronization. Resolving this conflict has implications for regulation of poleward heat transport and global climate change. New multidecadal-resolution foraminiferal oxygen isotope records from the Gulf of Alaska (GOA) reveal sudden shifts between intervals of synchroneity and asynchroneity with the North Greenland Ice Core Project (NGRIP) δ18O record over the past 18,000 years. Synchronization of these regions occurred 15,500 to 11,000 years ago, just prior to and throughout the most abrupt climate transitions of the last 20,000 years, suggesting that dynamic coupling of North Pacific and North Atlantic climates may lead to critical transitions in Earth’s climate system.

*Correspondence: spraetor@coas.oregonstate.edu

http://www.sciencemag.org/content/345/6195/444.abstract

Wednesday, March 19, 2014

Michael Mann, SciAm: Earth Will Cross the Climate Danger Threshold by 2036

The rate of global land-surface temperature rise may have hit a plateau, but a climate crisis still looms in the near future


If the Northern Hemisphere's surface temperatures rise more than two degrees Celsius above preindustrial levels (baseline), human civilization will suffer dangerous harm, scientists say. When will that occur if the world keeps burning fossil fuels at current rates? The answer comes from entering estimates for equilibrium climate sensitivity (ECS)—how sensitive the atmosphere is to the heating effect of greenhouse gases (five solid curves)—into a so-called energy balance model of climate. The estimate that best agrees with recorded data reflecting the sensitivity of the earth's climate (white) indicates that the world will cross the two degrees C threshold in 2036, only 22 years from now (orange). If the reported recent slowdown in the rate of temperature rise, sometimes inappropriately called “the pause,” proves to be part of a more persistent pattern, then a different estimate (gold) best fits the past 15 years or so, and it gives the world until 2046 to cross the danger line.

Credit: Pitch Interactive; SOURCE: MICHAEL E. MANN

In Brief

  • The rate at which the earth's temperature has been rising eased slightly in the past decade, but temperature is still increasing; calling the slowdown a “pause” is false.
  • New calculations by the author indicate that if the world continues to burn fossil fuels at the current rate, global warming will rise to two degrees Celsius by 2036, crossing a threshold that will harm human civilization.
  • To avoid the threshold, nations will have to keep carbon dioxide levels below 405 parts per million.

More In This Article

“Temperatures have been flat for 15 years—nobody can properly explain it,” the Wall Street Journal says. “Global warming ‘pause’ may last for 20 more years, and Arctic sea ice has already started to recover,” the Daily Mail says. Such reassuring claims about climate abound in the popular media, but they are misleading at best. Global warming continues unabated, and it remains an urgent problem.
The misunderstanding stems from data showing that during the past decade there was a slowing in the rate at which the earth's average surface temperature had been increasing. The event is commonly referred to as “the pause,” but that is a misnomer: temperatures still rose, just not as fast as during the prior decade. The important question is, What does the short-term slowdown portend for how the world may warm in the future?
The Intergovernmental Panel on Climate Change (IPCC) is charged with answering such questions. In response to the data, the IPCC in its September 2013 report lowered one aspect of its prediction for future warming. Its forecasts, released every five to seven years, drive climate policy worldwide, so even the small change raised debate over how fast the planet is warming and how much time we have to stop it. The IPCC has not yet weighed in on the impacts of the warming or how to mitigate it, which it will do in reports that were due this March and April. Yet I have done some calculations that I think can answer those questions now: If the world keeps burning fossil fuels at the current rate, it will cross a threshold into environmental ruin by 2036. The “faux pause” could buy the planet a few extra years beyond that date to reduce greenhouse gas emissions and avoid the crossover—but only a few.


A Sensitive Debate
The dramatic nature of global warming captured world attention in 2001, when the IPCC published a graph that my co-authors and I devised, which became known as the “hockey stick.” The shaft of the stick, horizontal and sloping gently downward from left to right, indicated only modest changes in Northern Hemisphere temperature for almost 1,000 years—as far back as our data went. The upturned blade of the stick, at the right, indicated an abrupt and unprecedented rise since the mid-1800s. The graph became a lightning rod in the climate change debate, and I, as a result, reluctantly became a public figure. In its September 2013 report, the IPCC extended the stick back in time, concluding that the recent warming was likely unprecedented for at least 1,400 years.
Although the earth has experienced exceptional warming over the past century, to estimate how much more will occur we need to know how temperature will respond to the ongoing human-caused rise in atmospheric greenhouse gases, primarily carbon dioxide. Scientists call this responsiveness “equilibrium climate sensitivity” (ECS). ECS is a common measure of the heating effect of greenhouse gases. It represents the warming at the earth's surface that is expected after the concentration of CO2 in the atmosphere doubles and the climate subsequently stabilizes (reaches equilibrium).
The preindustrial level of CO2 was about 280 parts per million (ppm), so double is roughly 560 ppm. Scientists expect this doubling to occur later this century if nations continue to burn fossil fuels as they do now—the “business as usual” scenario—instead of curtailing fossil-fuel use. The more sensitive the atmosphere is to a rise in CO2, the higher the ECS, and the faster the temperature will rise. ECS is shorthand for the amount of warming expected, given a particular fossil-fuel emissions scenario.
It is difficult to determine an exact value of ECS because warming is affected by feedback mechanisms, including clouds, ice and other factors. Different modeling groups come to different conclusions on what the precise effects of these feedbacks may be. Clouds could be the most significant. They can have both a cooling effect, by blocking out incoming sunlight, and a warming effect, by absorbing some of the heat energy that the earth sends out toward space. Which of these effects dominates depends on the type, distribution and altitude of the clouds—difficult for climate models to predict. Other feedback factors relate to how much water vapor there will be in a warmer atmosphere and how fast sea ice and continental ice sheets will melt.
Because the nature of these feedback factors is uncertain, the IPCC provides a range for ECS, rather than a single number. In the September report—the IPCC's fifth major assessment—the panel settled on a range of 1.5 to 4.5 degrees Celsius (roughly three to eight degrees Fahrenheit). The IPCC had lowered the bottom end of the range, down from the two degrees C it had set in its Fourth Assessment Report, issued in 2007. The IPCC based the lowered bound on one narrow line of evidence: the slowing of surface warming during the past decade—yes, the faux pause.
Many climate scientists—myself included—think that a single decade is too brief to accurately measure global warming and that the IPCC was unduly influenced by this one, short-term number. Furthermore, other explanations for the speed bump do not contradict the preponderance of evidence that suggests that temperatures will continue to rise. For example, the accumulated effect of volcanic eruptions during the past decade, including the Icelandic volcano with the impossible name, Eyjafjallajökull, may have had a greater cooling effect on the earth's surface than has been accounted for in most climate model simulations. There was also a slight but measurable decrease in the sun's output that was not taken into account in the IPCC's simulations.
Natural variability in the amount of heat the oceans absorb may have played a role. In the latter half of the decade, La Niña conditions persisted in the eastern and central tropical Pacific, keeping global surface temperatures about 0.1 degree C colder than average—a small effect compared with long-term global warming but a substantial one over a decade. Finally, one recent study suggests that incomplete sampling of Arctic temperatures led to underestimation of how much the globe actually warmed.
None of these plausible explanations would imply that climate is less sensitive to greenhouse gases. Other measurements also do not support the IPCC's revised lower bound of 1.5 degrees C. When all the forms of evidence are combined, they point to a most likely value for ECS that is close to three degrees C. And as it turns out, the climate models the IPCC actually used in its Fifth Assessment Report imply an even higher value of 3.2 degrees C. The IPCC's lower bound for ECS, in other words, probably does not have much significance for future world climate—and neither does the faux pause.
For argument's sake, however, let us take the pause at face value. What would it mean if the actual ECS were half a degree lower than previously thought? Would it change the risks presented by business-as-usual fossil-fuel burning? How quickly would the earth cross the critical threshold?
A Date with Destiny: 2036
Most scientists concur that two degrees C of warming above the temperature during preindustrial time would harm all sectors of civilization—food, water, health, land, national security, energy and economic prosperity. ECS is a guide to when that will happen if we continue emitting CO2 at our business-as-usual pace.
I recently calculated hypothetical future temperatures by plugging different ECS values into a so-called energy balance model, which scientists use to investigate possible climate scenarios. The computer model determines how the average surface temperature responds to changing natural factors, such as volcanoes and the sun, and human factors—greenhouse gases, aerosol pollutants, and so on. (Although climate models have critics, they reflect our best ability to describe how the climate system works, based on physics, chemistry and biology. And they have a proved track record: for example, the actual warming in recent years was accurately predicted by the models decades ago.)
I then instructed the model to project forward under the assumption of business-as-usual greenhouse gas emissions. I ran the model again and again, for ECS values ranging from the IPCC's lower bound (1.5 degrees C) to its upper bound (4.5 degrees C). The curves for an ECS of 2.5 degrees and three degrees C fit the instrument readings most closely. The curves for a substantially lower (1.5 degrees C) and higher (4.5 degrees C) ECS did not fit the recent instrumental record at all, reinforcing the notion that they are not realistic.
To my wonder, I found that for an ECS of three degrees C, our planet would cross the dangerous warming threshold of two degrees C in 2036, only 22 years from now. When I considered the lower ECS value of 2.5 degrees C, the world would cross the threshold in 2046, just 10 years later [see graph on pages 78 and 79].
So even if we accept a lower ECS value, it hardly signals the end of global warming or even a pause. Instead it simply buys us a little bit of time—potentially valuable time—to prevent our planet from crossing the threshold.
Cautious Optimism
These findings have implications for what we all must do to prevent disaster. An ECS of three degrees C means that if we are to limit global warming to below two degrees C forever, we need to keep CO2 concentrations far below twice preindustrial levels, closer to 450 ppm. Ironically, if the world burns significantly less coal, that would lessen CO2 emissions but also reduce aerosols in the atmosphere that block the sun (such as sulfate particulates), so we would have to limit CO2 to below roughly 405 ppm.
We are well on our way to surpassing these limits. In 2013 atmospheric CO2 briefly reached 400 ppm for the first time in recorded history—and perhaps for the first time in millions of years, according to geologic evidence. To avoid breaching the 405-ppm threshold, fossil-fuel burning would essentially have to cease immediately. To avoid the 450-ppm threshold, global carbon emissions could rise only for a few more years and then would have to ramp down by several percent a year. That is a tall task. If the ECS is indeed 2.5 degrees C, it will make that goal a bit easier.
Even so, there is considerable reason for concern. The conclusion that limiting CO2below 450 ppm will prevent warming beyond two degrees C is based on a conservative definition of climate sensitivity that considers only the so-called fast feedbacks in the climate system, such as changes in clouds, water vapor and melting sea ice. Some climate scientists, including James E. Hansen, former head of the nasa Goddard Institute for Space Studies, say we must also consider slower feedbacks such as changes in the continental ice sheets. When these are taken into account, Hansen and others maintain, we need to get back down to the lower level of CO2 that existed during the mid-20th century—about 350 ppm. That would require widespread deployment of expensive “air capture” technology that actively removes CO2 from the atmosphere.
Furthermore, the notion that two degrees C of warming is a “safe” limit is subjective. It is based on when most of the globe will be exposed to potentially irreversible climate changes. Yet destructive change has already arrived in some regions. In the Arctic, loss of sea ice and thawing permafrost are wreaking havoc on indigenous peoples and ecosystems. In low-lying island nations, land and freshwater are disappearing because of rising sea levels and erosion. For these regions, current warming, and the further warming (at least 0.5 degree C) guaranteed by CO2 already emitted, constitutes damaging climate change today.
Let us hope that a lower climate sensitivity of 2.5 degrees C turns out to be correct. If so, it offers cautious optimism. It provides encouragement that we can avert irreparable harm to our planet. That is, if—and only if—we accept the urgency of making a transition away from our reliance on fossil fuels for energy.

