Blog Archive

Showing posts with label 2015 temperatures. Show all posts

Thursday, March 31, 2016

Rep. Lamar Smith (R-TX) Still Completely Wrong About Global Warming ‘Halt’ and Continues to Spread Falsehoods about the Science of Climate Change

by Vanessa Schipani, FactCheck.org, March 30, 2016 

Rep. Lamar Smith (R-TX) at a recent hearing claimed a new study published in the journal Nature Climate Change “confirms the halt in global warming.” It doesn’t. In fact, the authors of the paper write, “We do not believe that warming has ceased.”
Smith, chairman of the House Committee on Science, Space, and Technology and longtime climate change skeptic, used the Nature study as ammunition against the National Oceanic and Atmospheric Administration in an ongoing battle over the validity of a paper that NOAA researchers published in the journal Science last June.
While the Nature study, published online in late February, claims there was a “slowdown” in the rate of global warming in the early 21st century, the Science paper argues there was not. But the studies compared different time periods. Both studies agree that there was no complete halt in global warming and the long-term warming trend remains unabated.
At the March 16, 2016, House hearing, Smith also continued to criticize the Science paper. He said the paper was “prematurely published,” but the editor-in-chief of Science told us Smith’s claim is “baseless and without merit.” Smith also said that the NOAA researchers used “controversial methods” in their study, but the authors of the Nature paper cited by Smith said this wasn’t the case. In fact, they cite the Science paper as having “high scientific value.”
Overall, each study asked different scientific questions, the answers to which can both remain valid and correct, according to the Nature authors themselves.

Smith vs. NOAA

This is not the first time Smith, a Republican from Texas, has made false statements about climate science and the so-called “Karl study,” named after Thomas R. Karl, director of NOAA’s National Centers for Environmental Information and the Science paper’s lead author.

SciCHECKinsertAs we’ve written before, Smith claimed in October 2015 that “climate data has clearly showed no warming for the past two decades” and that NOAA scientists “altered the data” to get the results they presented in the Science study.
Motivated to quell what he considers the NOAA and Obama administration’s “extreme climate change agenda,” Smith used the House science committee’s subpoena power on Oct. 13, 2015, to obtain internal communications at NOAA regarding the Karl study. NOAA has provided the committee with some documents and emails, though Smith continues to request more information.
In the battle’s latest episode, NOAA Administrator Kathryn Sullivan testified before the House science committee on March 16 on NOAA’s 2017 budget. Again, Smith brought up the Karl study, claiming it was “prematurely published” and used “controversial new methods,” among other things.
During the hearing, Sullivan countered by stating that the final timing of any publication is “at the discretion of the publication itself.” She also said Science “scrubbed this paper with extra diligence” due to the “interest in this matter.”
According to Marcia McNutt, editor-in-chief at Science, Smith is wrong and Sullivan is right. In fact, McNutt told us by email, “Any suggestion that the review of this paper was ‘rushed’ is baseless and without merit.”
McNutt added that “knowing that this report’s results disputed the existence of a 21st century global warming slowdown described in previous studies, Science took extra care to assure even more rigorous review and evaluation than normal.”
When asked to provide evidence that NOAA had prematurely published the Karl study, a committee aide for Smith pointed us to a Nov. 23, 2015, Washington Post article. In that article, Thomas Peterson, an author of the Science study and retired NOAA climate scientist, describes “internal tensions” between NOAA scientists and engineers over delays related to the programs used to process the climate data. But in the same piece, Peterson is quoted as stating that the research was not rushed. “Indeed just the opposite is true,” he told the Post.
Smith made a few new claims during the March 16 budget hearing as well. He said, “A new peer-reviewed study, published in the journal Nature, confirms the halt in global warming. According to one of the study’s lead authors, it ‘essentially refutes’ NOAA’s study.” Smith also repeatedly asked Sullivan to side with either the Science or the Nature study’s findings because he claimed both can’t be “correct” or “valid.”
First off, the two papers’ disagreement was on whether the rate of warming has slowed in the first 15 years of the 21st century, not whether warming has halted, as Smith claimed.
Second, John Fyfe, lead author of the Nature paper, told us in an email that Smith took his comment during an interview with the website Climate Central out of context. “It would be incorrect to interpret [the ‘essentially refutes’] quote as indicating that Fyfe et al. refuted the Karl et al. study in its entirety.” He said, “As we said in our Commentary we view the Karl et al. study as being of ‘high scientific value.’ ”
Third, according to McNutt and the Nature authors, both papers could, in fact, remain valid and correct. For example, Gerald Meehl, an author on the Nature paper and climate scientist at the National Center for Atmospheric Research, pointed us to a segment of an article with Environment & Energy Publishing, which states “both comparisons are valid … and provide answers to different questions.”
In the following section we’ll explain the similarities and differences between the two papers’ methods and results and why both can remain valid.

 Science vs. Nature

Both the Science and the Nature papers begin by mentioning the Intergovernmental Panel on Climate Change’s description of a surface warming slowdown between 1998 and 2012 in its Fifth Assessment Report. Both papers also note that researchers use “hiatus” to describe this slowdown in the scientific literature — a point Smith’s committee aide made to us. But technically the rate of global warming never completely halted during this period, as both papers state.
For this reason, the authors of the Nature paper write that it’s “unfortunate” that the 21st century warming trend has been framed as having “stalled,” “stopped,” “paused” or “entered a ‘hiatus.’ ” While “[j]ust exactly how such changes should be referred to is open to debate,” the authors suggest “reduced rate of warming,” “decadal fluctuation” and “temporary slowdown” as some possibilities.
Both papers diverge when it comes to the specific questions the researchers asked, and, accordingly, how they quantified the slowdown.
The authors of the Science paper compared the rate of warming during the period between 2000 and 2014 with that of 1951 to 1999, though they also investigated trends in warming dating back to 1880.
The Nature authors, alternatively, compared the warming rate of 2001 to 2014 with a shorter period — 1972 to 2001.
The rationale for using different time periods is tied, at least in part, to the ultimate aim of each study.
The Science study was designed to determine if the global warming trend for “the first 15 years of the 21st century is at least as great as the last half of the 20th century.” It found there was no “slowdown” in global warming compared with this 50-year period.
The Nature study, on the other hand, strove to figure out whether the rates of global warming fluctuate every few decades, so the authors compared the first 15 years of the 21st century with a shorter time period. They reported that the rate had slowed down from 1950 to 1972, then sped up from 1972 to 2001, and then slowed again from 2001 to 2014. “A warming slowdown is thus clear in observations; it is also clear that it has been a ‘slowdown,’ not a ‘stop,’ ” the study concluded.
Meehl told us by email that it was mainly the Karl study’s “interpretation of different trend lengths [discussed above] that we took issue with.”
However, Meehl said he did not find the Karl study’s methods to be “controversial.” The adjustments the NOAA scientists made to their data, which Smith has criticized, “were fairly minor,” added Meehl, and involved calibrating different sets of data to each other.
For example, data on sea surface temperatures alone can come from buoys, ship engine-intake systems and buckets dropped off the side of a ship. As the Science study states, “ship data are systematically warmer than the buoy data,” so adjustments need to be made to calibrate them to each other.
The same inconsistencies occur when data are collected from different land stations. In fact, the Nature paper describes the Karl study’s identification and correction of these data “errors and inhomogeneities” as “of high scientific value.”
Michael Mann, a climate scientist at Penn State University and an author on the Nature paper, wrote Smith an open letter on March 3, which directly addressed the chairman’s false claims.
In his letter, which was posted on Facebook, Mann wrote: “Please don’t misrepresent our recent Nature Climate Change commentary. Our study does NOT support the notion of a ‘pause’ in global warming, only a *temporary slowdown*, which was due to natural factors, and has now ended.”
In sum, based on their different questions and correspondingly different time period comparisons, the Science and Nature studies came to different, though equally valid, conclusions about the warming rate in the early 21st century. Regardless, neither paper supported a halt in global warming, as Smith claimed.
Editor’s Note: SciCheck is made possible by a grant from the Stanton Foundation.

Friday, March 18, 2016

Joe Romm: Hottest Winter On Record By Far Drives Devastating Weather Disasters Globally


by Joe Romm, Climate Progress, March 17, 2016

December 2015 through February 2016 was the hottest meteorological winter ever by far, topping the previous record by a jaw-dropping half a degree Fahrenheit. The National Oceanic and Atmospheric Administration (NOAA) reports that this winter was a remarkable 2.03 °F above the 20th century average.
This extreme warmth — caused primarily by the accelerating human-caused global warming trend (with a boost from El Niño) — is a key reason a number of countries have already “set records for the all-time most expensive weather-related disaster in their nations’ history” this year, as meteorologist Jeff Masters has explained.
We already knew from NASA surface temperature data and from the satellite data that this was the hottest February on record by far. Indeed, every database confirms that February was the most extreme deviation from “normal” temperatures ever recorded for any month!
NOAA’s latest monthly “State of the Climate” report reveals just how hot temperatures over land were, as recorded by the Global Historical Climatology Network (GHCN), an “integrated database of climate summaries from land surface stations across the globe.” NOAA reports that “a total of 115 individual GHCN stations from 38 countries across all inhabited continents and several island nations set new February high temperature records.”
LandTempsFeb16NOAA
CREDIT: NOAA
The Earth’s landmasses were so hot in February that NOAA reports these stunning facts:
The February globally-averaged land surface temperature was 4.16 °F (2.31 °C) above the 20th century average. This was the highest for February in the 1880–2016 record, surpassing the previous records set in 1998 and 2015 by 1.13 °F (0.63 °C).
Yes, last month beat the all time record for hottest February over land by a staggering 1.13 °F.
Because of such scorching heat in February and indeed all winter, it’s no surprise that a number of countries saw record-setting weather-related natural disasters.
“According to the February 2016 Catastrophe Report from insurance broker Aon Benfield, three nations suffered extreme weather disasters in February 2016 that cost at least 4% of their GDP — roughly the equivalent of what in the U.S. would be five simultaneous Hurricane Katrinas,” Jeff Masters and and Bob Henson explain at Weather Underground:
The three unlucky nations that suffered their most expensive weather-related natural disasters ever are Vietnam, Zimbabwe, and Fiji:
  • “Vietnam has suffered $6.7 billion in damage from its 2016 drought, which has hit farmers especially hard in the crucial southern Mekong Delta. This cost is approximately 4% of Vietnam’s GDP, and beats the $785 million cost (2009 USD) of Typhoon Ketsana of September 28, 2009, for most expensive disaster in their history.”
  • “Zimbabwe has suffered $1.6 billion in damage from its 2016 drought [with more than a quarter of the population facing food shortages]. This is approximately 12% of their GDP, and beats the $200 million cost (2003 USD) of a February 2003 flood for most expensive disaster in their history.”
  • “Fiji suffered $470 million in damage from Category 5 Cyclone Winston’s impact in February [peak strength 185 mph winds]. This is approximately 10% of their GDP. The previous costliest disaster in Fiji was Tropical Cyclone Kina in January 1993, at $182 million (2016 USD) in damage.”
Given that this month looks to be headed toward the hottest March on record by far — and given that it would surprise no one if this were the hottest spring on record by far — much more such extreme weather disasters are yet to come.
It’s worth remembering, though, that however bad it gets this year, if we don’t continue to sharply reverse global emissions trends, then our current extreme weather will simply be the norm by mid-century — and it will be considered mild by century’s end.

http://thinkprogress.org/climate/2016/03/17/3761359/hottest-winter-weather-disasters/

Tuesday, December 29, 2015

“Most Terrifying” Weather Ends a Hot 2015 by Peter Sinclair and Eric Holthaus

by Peter Sinclair, This Is Not Cool, December 29, 2015

decstorm2small

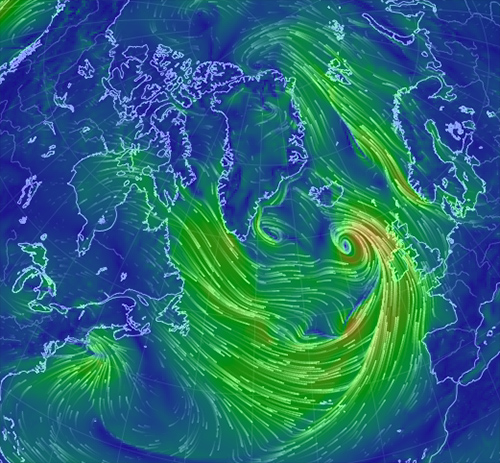
The storm that rampaged thru Texas and wreaked havoc across the south and midwest is winding up to deliver a hot blow to a suddenly vulnerable-even-in-December  Arctic.

As it departs North America this week, the storm will rapidly intensify over the northern reaches of the Gulf Stream and draw tremendous amounts of warm air northward from Spain and the Mediterranean Sea toward the Arctic. As the storm approaches Iceland, it will have strengthened to the equivalent of some of the strongest hurricanes ever recorded in terms of atmospheric pressure. Intensely high pressure over western Russia, perhaps boosted by melting sea ice, will aid in setting up the tropics-to-pole atmospheric superhighway. 
Unlike other recent episodes of extreme weather around the planet, this storm is probably not related to El Niño, which has limited influence in Europe. The storm will be strengthening over the exact spot that North Atlantic temperatures have been cooling over recent years, an effect that scientists have linked to a slowdown of the basin’s circulation triggered in part by melting sea ice—the same scenario that was highly dramatized in the movie The Day After Tomorrow. This year, there’s been a notable increase in the sharp contrast between this cold patch and record warm ocean temperatures in the tropical Atlantic, an effect that leads to stronger ocean storms—like this one. 
decstorm1 
The remarkable storm will briefly boost temperatures in the Arctic basin to nearly 10 degrees Fahrenheit warmer than normal—and the North Pole itself will be pushed above the freezing point, with temperatures perhaps as warm as 40 degrees. That’s absolutely terrifying and incredibly rare. Keep in mind: It’s late December and dark 24 hours a day at the North Pole right now. The typical average high temperature this time of year at the North Pole is about minus 15 to minus 20 degrees. To create temperatures warm enough to melt ice to exist in the dead of winter—some 50 or 60 degrees warmer than normal—is unthinkable. 
For some perspective, I contacted a team of climate scientists at the University of Washington who maintain a fleet of weather monitoring equipment near the North Pole. James Morison, the principal investigator of the North Pole Environmental Observatory, said he’s “never heard of” temperatures above freezing in the wintertime there. Looking closer at the weather data, it appears this event is in fact unprecedented during the time period from late December through late April. 
On Wednesday, the North Pole will be warmer than Western Texas, Southern California, and parts of the Sahara.
http://climatecrocks.com/2015/12/29/most-terrifying-weather-ends-a-hot-2015/

Sunday, November 29, 2015

John Abraham: Study drives a sixth nail into the global warming ‘pause’ myth

Numerous climate records and denial myths have fallen in 2015

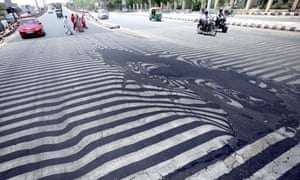
Road markings appear distorted during a heatwave, in New Delhi, India, 27 May 2015.

Road markings appear distorted during a heatwave, in New Delhi, India, 27 May 2015. Photograph: Harish Tyagi/EPA

by John Abraham, "Climate Consensus - The 97%," The Guardian, November 24, 2015

Despite the organization and funding behind groups which try to cast doubt about the causes and implications of climate change, the facts have spoken. The world continues to warm and their favorite myths have died.
We know that human-emitted heat-trapping gases warm the planet. In fact, this has been known for well over a century. With modern instruments (like ocean thermometers and satellites among others), we are now measuring the change. With advanced climate models, we can predict the changes. The measurements and the predictions are in excellent agreement, despite what cable news and second-rate skeptical scientists say.
And this year, the data are in. Using measurements to date, and long-term weather forecasting to predict the last 40 days of the year (while it may seem a bit early) we now know. As my colleague Dana Nuccitelli recently noted, 2015 is the hottest year on record. When the final numbers come out in January, the NOAA 2015 global averaged surface temperature anomaly over both land and ocean will be 1.6 °F above the long-term average. For the NASA GISTEMP dataset, it will be 1.5 °F above the long-term average. This comes on the heels of last year’s record and recent record ocean heat content. So, the bad news is we continue to break records.
The good news is that the favorite myths from climate-change skeptics [deniers] have taken a beating this year. Perhaps the best-known myth is the so-called “pause” or “hiatus” in global warming. This year, six individual studies have looked into this and found it incorrect. I have co-authored one of the studies, and I’ve written about some of the others here and here.
Well just today, another paper was published by Stephan Lewandowsky, James Risbey, and Naomi Oreskes that comes to the same conclusion. The paper is titled, “On the definition and identifiability of the alleged 'hiatus' in global warming.” The authors assess the magnitude and significance of all possible warming trends during the past 30 years. They found that looking back in time, the current definition of a “pause” in warming, as it is used in the literature, would have been used for more than one-third of the time, even though temperatures during the past 30 years increased by 1.1 °F (0.6 °C). 
The authors included 40 peer-reviewed studies that reported on the so-called hiatus or pause, and found no consistent definition among those studies. Then, the authors used these same 40 papers and asked whether the so-called “hiatus” was unusual in the time records. They found it wasn’t. 
The study also found that when the sample size is small (such as a short time period with very few years), a so-called “hiatus” will always appear. For instance, anyone claiming a “hiatus” shorter than 12 years will almost always find one.
I asked author Naomi Oreskes for a summary and she told me,
For a long time, climate change contrarians and deniers have insisted that global warming has paused, stopped, or taken a hiatus. This might have been dismissed as the usual denier cherry-picking—since much of it was based on cherry picking the starting year of 1998—an unusually hot year.
So we took up the question, first of all, whether the warming had stopped and second, if it had not, why were scientists calling it a pause. Ironically the paper that answered the second question got published first: we showed how contrarian discourse had steeped into the climate science community, so scientists were calling this decrease in the rate of warming a pause, when it clearly was no such thing. If warming continued, as indeed it did, then by definition that is not a pause, nor a hiatus. Our new paper, shows statistically that not only has there not been a pause or hiatus, but that the observed rate of warming is well within the range of previous fluctuations—including some positive fluctuations (i.e. increases in the rate of warming) that did not generate any scientific attention.
So the bottom line is: there is no pause, and there has never been one. The rate of global warming does fluctuate—but this has been known for a long time. Whether or not any particular fluctuation has an identifiable cause—like the effects of ocean heat uptake or an El Ninois an interesting question, but a fluctuation is not a pause, and it is important to be clear that the recent fluctuation is not statistically anomalous compared with other fluctuations we have seen, relative to the longer-term warming trend.
Now, with six nails in this coffin of this myth, are any more needed?
http://www.theguardian.com/environment/climate-consensus-97-per-cent/2015/nov/24/study-drives-a-sixth-nail-in-the-global-warming-pause-myth

Wednesday, November 18, 2015

2015 shatters the temperature record as global warming speeds back up

Thanks to human-caused global warming and an assist from El Niño, 2015 will easily be the hottest year in millennia

A man sleeps under the shade of a tree during a May 2015 heat wave in New Delhi, India.

 A man sleeps under the shade of a tree during a May 2015 heat wave in New Delhi, India. Photograph: Anindito Mukherjee/Reuters
by Dana Nuccitelli, The Guardian, November 18, 2015

With just a month and a half left in 2015, it’s clear this year will be by far the hottest on record, easily beating the previous record set just last year. The temporary slowdown in the warming of global surface temperatures (also misnamed the “pause”) has ended, as each of the past four years has been hotter than the one before.
El Niño is one reason 2015 has been such an incredibly hot year. During El Niño events, hot water is transported from the deep ocean layers to the surface. Over the past 15 years, we’ve experienced more La Niñas than El Niños, which helped temporarily slow the warming of global surface temperatures.
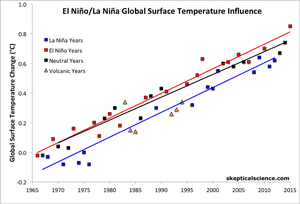
That changed in 2015, which has seen the third-largest surface temperature warming influence from an El Niño event on record (behind 1998 and 1987). The chart below breaks down global surface temperature data into years with El Niño, La Niña, neutral, and volcanic eruption temperature influences. Click here for additional details and a larger, animated version.
NOAA global surface temperature data (1966–2015) broken into El Niño, La Niña, and neutral years with linear trends for each category.
Pinterest
 NOAA global surface temperature data (1966–2015) broken into El Niño (red), La Niña (blue), neutral (black), and volcanic eruption (orange) years with linear trends for each category. Created by Dana Nuccitelli.
As the chart shows, 2015 will be more than 0.2 °C hotter than 1998, despite having a slightly weaker El Niño warming influence. That temperature difference is the result of human-caused global warming. If we look at the temperature trends just for El Niño years, for La Niña years, and for neutral years, each has a trend of 0.15–0.17 °C global surface warming per decade since the 1960s. The years during the mythical “pause” fall right along the long-term trend lines for each category (e.g., the blue points are consistently near the blue trend line).
This tells us that the long-term global warming trend persists, and it was only temporarily slowed because of the prevailing La Niña conditions from 1999 to 2012. In short, La Niña years in the 2000s have been hotter than previous La Niña years because of continued global warming, but they’re cooler at the surface than recent El Niño and neutral years.
We’ve now seen a new global surface temperature record in four of the past 11 years (2005, 2010, 2014, and 2015). This is consistent with a 2011 paper by climate scientists Stefan Rahmstorf and Dim Coumou, who found that as global warming continues, we should expect to set new records about once every four years.
Indeed, if we only use the data of the past 30 y, these show an almost linear trend of 0.017°C/y, yielding an expected 2.5 new record hot temperatures in the last decade [1 per 4 years].
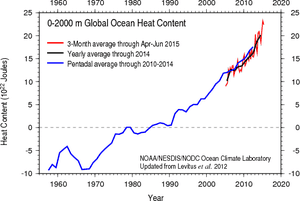
The oceans have continued to accumulate a tremendous amount of heat as well. According to NOAA, in 2015 the oceans have accumulated an amount of heat equivalent to about 400 million atomic bomb detonations (27 zettajoules, or 27 billion trillion Joules). That means the Earth accumulated about 14 atomic bomb detonations of energy per second, on average, throughout 2015. That’s a lot of heat, likewise reaching record levels.
Global ocean heat content estimates from NOAA, 0–2000 meters.
 Global ocean heat content estimates from NOAA, 0–2000 meters.
In short, while global surface warming temporarily slowed down due to a preponderance of La Niñas and a few other short-term factors, it’s now starting to speed up again. The warming of the oceans and heat build-up on Earth continue as well, not having slowed to begin with. One more climate myth bites the dust.

Monday, November 16, 2015

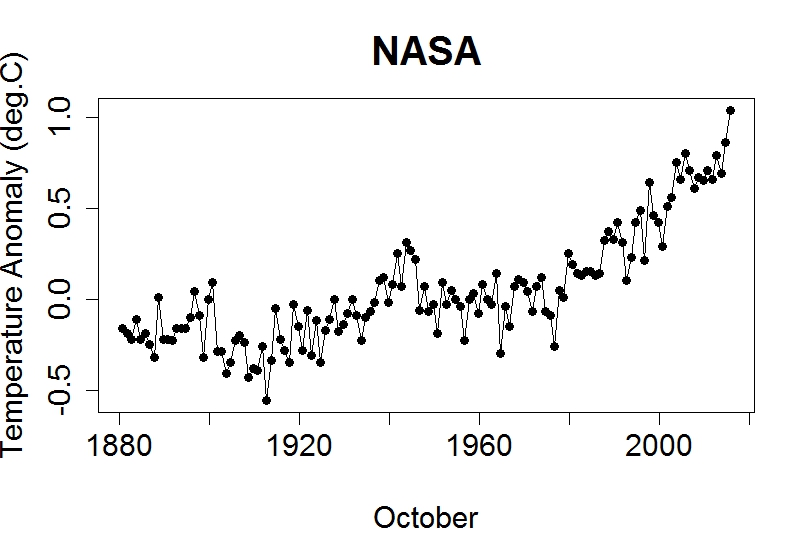
tamino: October 2015 a Scorcher! The hottest month in the entire instrumental record, going back to the 1800s!

A few days ago I learned that JMA (the Japan Meteorological Agency) had released their global temperature data for October, according to which this year’s October beat the pants off any preceding October:
oct_wld

I wasn’t sure what other organizations would report, but NASA just released their October update — and this year’s October beat the pants off any preceding:
giss_October
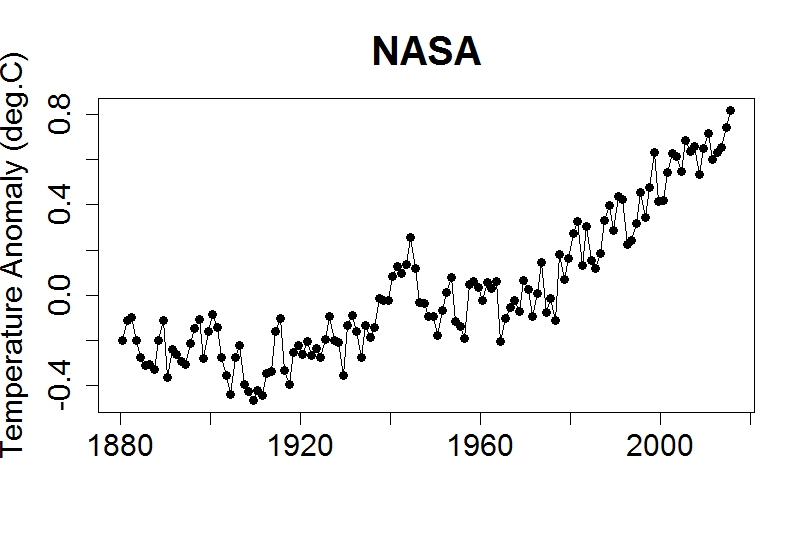
We’re also on track — in fact it’s almost a lock — to set a new record hottest year. Here’s the year-so-far compared to preceding years:
giss_annual
By the way, this month wasn’t just the hottest October temperature anomaly on record in NASA data. It was the hottest month, period.
giss_monthly
What do you think — will Congressman Lamar Smith try to issue a subpoena demanding all the emails from scientists at the Japan Meteorological Agency?