by Alex Kirby, Climate News Network, October 10, 2015
LONDON – One of Africa’s most volatile regions has become increasingly dry over the last century and faces a future of rising tension if this trend continues, US researchers say.
They say the rate of drying in the Horn of Africa is both unusual in the context of the last 2,000 years and in step with human-influenced warming. And they think the drying will continue as the region warms.
“Right now, aid groups are expecting a wetter, greener future for the Horn of Africa, but our findings show that the exact opposite is occurring,” says one of the study’s co-authors, Peter deMenocal, who heads the Center for Climate and Life at Columbia University’s Lamont-Doherty Earth Observatory.
“The region is drying, and will continue to do so with rising carbon emissions.” The study, published in the journal Science Advances, was based on evidence stretching back for 40,000 years.
Sediment core
The researchers used a sediment core they had extracted from the Gulf of Aden to infer past changes in temperature and aridity. After matching the core’s record with 20th-century observations, they concluded that drying is likely to continue across Somalia, Djibouti and Ethiopia.
That contradicts other models, which have suggested that future warming might bring rainier weather patterns that could benefit East Africa.
“What we see in the paleoclimate record from the last 2,000 years is evidence that the Horn of Africa is drier when there are warm conditions on Earth, and wetter when it is colder,” says lead author Jessica Tierney, associate professor of geosciences at the University of Arizona.
Global-scale models used to predict future changes as the climate warms suggest that the region should become wetter, primarily during the “short rains” season from September to November.
However, the new study suggests that those gains may be offset by declining rainfall during the “long rains” season from March to May, on which the region’s rain-fed agriculture relies.
The authors say the region has been racked with political instability and violence as it has dried. The Horn of Africa has suffered droughts every few years in recent decades − creating humanitarian crises as famine and violence spread.
In Somalia, as the political situation deteriorated amid the droughts of the 1980s and 1990s, hundreds of thousands of refugees fled the country, and pirates began raiding ships off the coast.
The 40,000-year-old sediment core has already yielded insights into Africa’s climate. In 2013, Tierney and deMenocal showed that the Sahara, which once used to burst into verdant life with regular rainfall, suddenly dried out over a century or two, during a warm period about 5,000 years ago – not more gradually, as many researchers had thought.
Their work provided evidence that climate shifts can happen quite suddenly, even if the forces driving them are gradual.
This latest study uses isotopes from leaf waxes found in the sediment sample to compare rates of drying over the past 2,000 years.
Plants reflect the environment that sustains them. When the climate is drier, leaf waxes are more enriched with deuterium, or heavy hydrogen isotopes, while leaf waxes from wetter climates reflect the more abundant rainfall through the presence of the normal hydrogen isotopes.
The researchers found an increasing shift toward heavy hydrogen in the last century as the climate − which had experienced a wet period during the Little Ice Age (1450-1850 AD) − dried out.
Climate modelling
Their findings suggest that climate modelling, frequently done at a global scale, would benefit from region-specific studies with higher-resolution results in high-impact areas such as the Horn of Africa
Tierney says: “If we can simulate rainfall in these arid tropical and subtropical regions better, we can understand the future impact of climate change.”
The development agency Oxfam says Ethiopia is facing a major emergency, with 4.5 million people needing food aid because of successive poor rains this year.
Oxfam’s representative in Ethiopia describes the situation − attributed to the El Niño periodic climate phenomenon in the Pacific − as “the start of a major emergency, which is expected to be serious and long.”
Meanwhile, parts of West Africa are suffering from the aftermath of severe floods − also attributed to El Niño − that have ruined crops and destroyed homes in Burkina Faso and Niger.
Showing posts with label paleo-climate. Show all posts
Showing posts with label paleo-climate. Show all posts
Friday, October 30, 2015


Monday, July 20, 2015
Updated ice sheet model matches wild swings in past sea levels: Changes make Antarctica lose more ice, faster
by Scott K. Johnson, arstechnica, January 25, 2015

It has been a bit of a head scratcher. Records of sea level during the last few million years tell us that there have been some warm periods where sea level may have been as much as 20 meters higher than it is today. When fed the conditions that prevailed at the time, however, our computer models of ice sheets haven’t been able to reproduce such a swelling of the ocean.
The models can simulate that much sea level rise, but it requires temperatures much higher than were seen during those warm periods. Realistic losses of ice from Greenland and the fragile, western part of Antarctica (the West Antarctic Ice Sheet) could only provide something in the neighborhood of 3 to 10 meters of sea level rise. That leaves 10 to 17 meters for the East Antarctic Ice Sheet—the largest and most stable ice sheet—to chip in. Convincing the miserly East Antarctic Ice Sheet to be that generous with its contents isn’t easy, which is why the models required such high temperatures.
Updating the models
So what are the models missing? Penn State’s David Pollard and Richard Alley, and University of Massachussetts, Amherst’s Robert DeConto had an idea for something to try. Two things to try, really. They added a pair of physical processes to an ice sheet model that weren’t simulated previously. The first was hydrofracturing. When water reaches the ice sheet from rain or ice melt at the surface, it fills crevasses in the ice.
If they're filled to a great enough depth, the water pressure forces the crevasse to open even deeper—that's termed hydrofracturing. The other process results from the simple fact that a sheer cliff of ice can only be so tall before it collapses under its own weight—a condition not encountered in too many places today.
One place it does occur is where floating glaciers calve large icebergs. These occur on the coastal outlet glaciers at the edges of ice sheets that are the most vulnerable to warming. The glacier thins towards its outer edge, and at some point it grows thin enough that it begins to float. The point at which it floats off the bottom is called the “grounding line”—from there out to the end of the ice is called an ice shelf. Ice shelves that grind against the shore (think of it floating in a bay or fjord) act to hold back the flow of ice behind them. These shelves gradually melt from below as they float in their seawater bath. But they can also melt from above and shed large bergs of ice at their outer edge.
Both hydrofracturing and cliff failure can increase the shedding of icebergs from shelves, hastening their demise and uncorking the glacier behind them. Once these things are happening near the grounding line, though, they can really accelerate its retreat if it's in an unstable configuration where the ground surface drops as you head inland. (Significant portions of Antarctica match that description.) Once you start retreating in that situation, the glacier may have to retreat a long way to find a stable position again.
A hasty retreat
Having added representations of these two processes to the model, the researchers simulated a sudden change from modern conditions to warmer conditions like those past periods of very high sea level. Then they watched the virtual Antarctic glaciers respond.
The results were dramatic. The new processes combined to have a huge impact. Instead of about 2 meters of sea level rise, Antarctica lost enough ice to raise global sea level 17 meters over several thousand years. The fragile West Antarctic Ice Sheet collapses in a matter of decades, rather than centuries or millennia. There’s 5 meters of sea level rise in the first two centuries, after which retreat in portions of the East Antarctic Ice Sheet really get going.
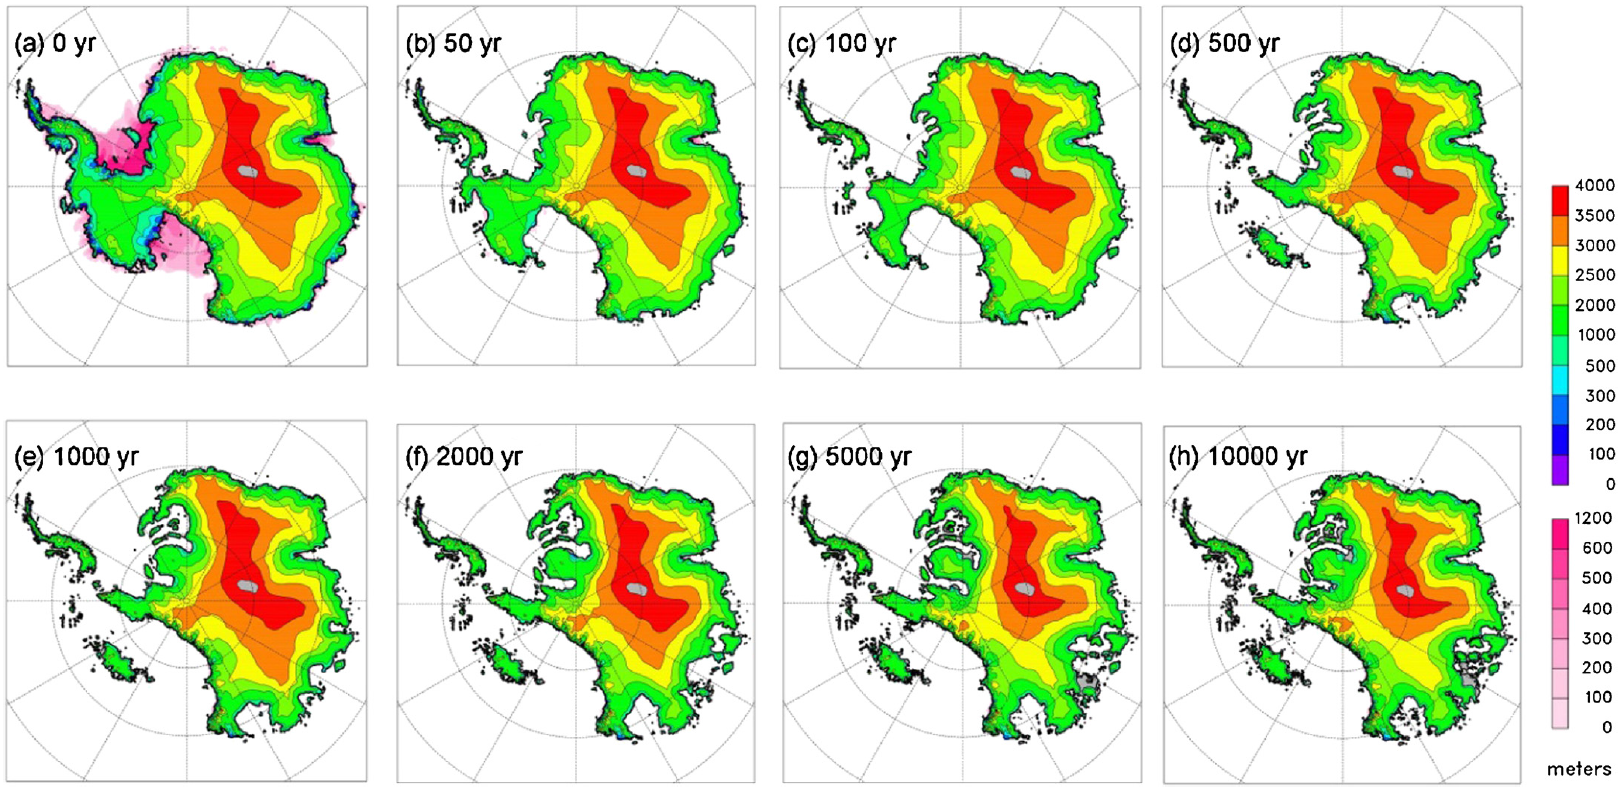
Much more work will be required to make sure these new processes are being simulated accurately, but the early returns show it could put researchers in the ballpark of solving the puzzle of past high sea levels.
The relevance for our present situation is less direct, as the warming in the simulation was not realistic, but the possibility that West Antarctica could lose ice faster than we thought is a serious one. Richard Alley, whose work on this possibility we’ve covered before, explained to Ars via email, “I believe (and I suspect many people do) that it is important for us as scientists to provide not only the most-likely future outcome, but also the range of possibilities, including some sort of assessment of best-case and worst-case outcomes. Best-case is fairly easy, I believe, but worst-case is not; however, providing both is likely to be useful to many people.”
“The physical knowledge that too-tall cliffs fail is very old and familiar to every miner or quarry-worker. The physical knowledge that ice is not the strongest rock on the planet is also rather old. And, the suggestion that cliff failure could affect West Antarctic stability dates back to 1962,” Alley wrote. “We now have stronger evidence that sufficient West Antarctic retreat could lead to a higher calving front than any on Earth today, and higher than a stability limit suggested by recent papers. Putting that understanding into projections of the future, as in our new paper, has implications for the worst-case scenario. And, testing against the paleoclimatic record provides support for that understanding.”
He continued, “It is still too early to say that this is an accurate worst-case scenario. Step-application of the [warming] is too extreme, clearly… but, it is within the realm of possibility that for the time-scale of collapse, the true worst worst-case scenario could be even a bit faster than modeled here; the renewed interest in this topic is recent, and the number of scientific papers exploring the physics remains low.”
Earth and Planetary Science Letters, 2014. DOI: 10.1016/j.epsl.2014.12.035
Saturday, July 4, 2015
Most Comprehensive Paleoclimate Reconstruction Confirms Hockey Stick
by Stefan Rahmstorf (via Scilogs), by Climate Guest Contributor, Climate Progress, July 8, 2013
The past 2,000 years of climate change have now been reconstructed in more detail than ever before by the PAGES 2k project. The results reveal interesting regional differences between the different continents, but also important common trends. The global average of the new reconstruction looks like a twin of the original “hockey stick,” the first such reconstruction published 15 years ago.
The past 2,000 years of climate change have now been reconstructed in more detail than ever before by the PAGES 2k project. The results reveal interesting regional differences between the different continents, but also important common trends. The global average of the new reconstruction looks like a twin of the original “hockey stick,” the first such reconstruction published 15 years ago.

Green dots show the 30-year average of the new PAGES 2k reconstruction. The red curve shows the global mean temperature, according HadCRUT4 data from 1850 onwards. In blue is the original hockey stick of Mann, Bradley and Hughes (1999 ) with its uncertainty range (light blue). Graph by Klaus Bitterman.
78 researchers from 24 countries, together with many other colleagues, worked for 7 years in the PAGES 2k project on the new climate reconstruction. “2k” stands for the last 2,000 years, while PAGES stands for the Past Global Changes program launched in 1991. Recently, their new study was published in Nature Geoscience. It is based on 511 climate archives from around the world, from sediments, ice cores, tree rings, corals, stalagmites, pollen or historical documents and measurements (Fig. 1). All data are freely available.
Figure 1. The map gives an overview of the studied continental areas and the particular combination of the proxies used for each. Source: Nature Geoscience.
The climate history of the past one to two thousand years was reconstructed for 7 continental regions in 30-year intervals (Figure 2).

Figure 2. Temperature evolution of the individual continental regions (30-year average). Red means hot, blue is cold. Source: Nature Geoscience.
Regional climate evolution
The data show, as expected, significant regional differences. Such regional patterns are an important clue to the causes and mechanisms of climate change. Significant local variations in climate can occur through changes in the atmospheric or oceanic circulation patterns, with very little effect on global mean temperature, because heat is only distributed differently (a recent short-term example is the record cold March in parts of Europe while Greenland was extremely warm – nothing unusual happened in the global mean). Changes in global mean temperature, however, occur due to changes in radiative forcing (e.g., solar fluctuations). This forcing can be globally uniform (e.g., well-mixed greenhouse gases) or can have a regional pattern (for example, volcanic eruptions and orbital cycles). So in the individual continents one expects a response to the forcings, superimposed by internal fluctuations.
The data shown in Figure 2 reflect this: they show some coherent signals, especially a long-term cooling trend that leads to increasingly cooler climate conditions from the relatively warm Middle Ages until this is turned around in the late 19th Century (see the next section). But, as expected, some regional variability is superimposed, especially on shorter time scales of decades to a century, where particularly warm and cold phases do not coincide in their timing on different continents, as the authors emphasize in the abstract:
There were no globally synchronous multi-decadal hot or cold intervals that define a worldwide Medieval Warm Period or Little Ice Age.
But they identify some shorter intervals where extremely cold conditions coincide with major volcanic eruptions and / or solar minima (as already known from previous studies).
Global Trends
The global mean temperature is of particular interest because it is a direct response to the global radiative forcing, buffered by the thermal inertia of the oceans. This follows from the first law of thermodynamics, i.e. the law of conservation of energy. So the globally coherent signals indicate globally effective forcings. The authors write in the abstract:
The most coherent feature in nearly all of the regional temperature reconstructions is a long-term cooling trend, which ended late in the nineteenth century. (…) Recent warming reversed the long-term cooling; during the period ad 1971–2000, the area-weighted average reconstructed temperature was higher than any other time in nearly 1,400 years.
The following Figure 3 therefore compares the area-weighted mean over the continents (b) with some previous northern hemisphere reconstructions (a) and the forcings (f, g, h). The basic pattern – a long-term slow cooling which in the late 19th Century turns into a rapid warming – has been known for 15 years and is often compared to a hockey stick: the long cooling trend is the handle, the modern warming the angled blade.
Figure 3. Temperature evolution according to some previous studies (a) and from the new PAGES 2k reconstruction (b). The panels f, g and h show the radiative forcing, see text. Source: Nature Geoscience. (Click here for enlarged image.)

Comparison with the forcings shows that this blade is due to the radiative forcing from the increasing amount of greenhouse gases in the atmosphere (green line in g). The solar and volcanic forcing can be reconstructed only with some uncertainty, therefore two variants are shown. For solar forcing, it is less the shape of the curve but mainly the amplitude which is controversial (a constant conversion factor) – the very high amplitude adopted by Shapiro (dotted line) is widely regarded as highly questionable (see, e.g., Feulner and Judge et al.). But even with this extreme assumption, the solar forcing in the 20th Century cannot compete by far with the greenhouse gases, and it also does not match the temperature evolution.
Interesting especially on long time scales of thousands of years is the orbital forcing (the well-known Milanković cycles; here is an online calculator for the radiative forcing). In the north, especially the summer insolation is important (green curve in panel h), because it is greatly amplified by the albedo feedback (i.e., by changes in the ice and snow-covered area). This may explain part of the cooling trend in the Northern Hemisphere. In Antarctica the situation is different: in summer the ice-covered area is relatively constant at about the size of the Antarctic continent because there is little sea ice and the trend of solar radiation (blue curve in panel h) is relatively weak. Therefore, the summer insolation change is much less important. But the annual average insolation in Antarctica (not shown in the PAGES graph) has declined strongly due to the orbital cycles over the past two millennia. This could be the explanation for the long-term cooling in Antarctica, which (unlike in the global average) has not yet been made up for by the modern anthropogenic warming.
Climate models are computer programs that calculate climate evolution from such forcings, based on the equations of thermo-and hydrodynamics. In the last IPCC report 18 such model calculations for the last millennium by different research groups are listed, almost all of which reproduce the reconstructed climate history from proxy data reasonably well (see IPCC, Figs. 6.13 and 6.14: the red-dashed outlier in 6.13 is the drift-affected model used by von Storch et al. in their failed attempt to discredit Mann et al.). The models also show that without the anthropogenic forcing there would have been no warming in the last 150 years.
The first comparable hockey stick curve was published in 1998 and 1999 by Mann et al. – at that time based on data only from the Northern Hemisphere. Figure 4 compares the new hockey stick (from panel b in Figure 3) with this original hockey stick. (The data for the original hockey stick have also been available since 1999 on the NOAA Paleoclimatology website.)
Figure 4. Green dots show the 30-year average (area-weighted mean over the continents) of the new PAGES 2k reconstruction, as shown in Figure 3b. The red curve shows the global mean temperature, according HadCRUT4 data from 1850 onwards (also in Figure 3b, smoothed with a 30-year window). In blue is the original hockey stick of man, Bradley and Hughes (1999 ) with its uncertainty range (light blue). Graph by Klaus Bitterman.

For the scientific community, the confirmation of the old hockey stick is no surprise (except perhaps for the closeness of the match); many other climate reconstructions with a similar time evolution have already appeared since. Mann et al. at the time cautiously assumed a wide margin of uncertainty (light blue) because of their limited data base and a possible underestimation of the variance by their method; later reconstructions run largely within this margin. The work of Mann and colleagues has gained the highest recognition. For example, Bradley was honoured in 2007 with the Oeschger Medal of the European Geosciences Union and Mann likewise in 2012, and both were (as well as Hughes) elected as fellows of the American Geophysical Union. Politically motivated attacks on their work were immense, however; both Bradley and Mann have published books about that experience:
- The Hockey Stick and the Climate Wars: Dispatches from the Front Lines by Michael E. Mann
- Global Warming and Political Intimidation: How Politicians Cracked Down on Scientists As the Earth Heated Up by Raymond S. Bradley
Stefan Rahmstorf is Co-Chair of Earth System Analysis, Potsdam Institute for Climate Impact Research. This article was originally published in German and translated was provided by the author.
Friday, February 13, 2015
Ocean sediment reveals that release of carbon stored deep in the sea is linked to the rise in atmospheric CO2 that caused the world to warm
by Tim Radford, Climate News Network, February 13, 2015
LONDON − Scientists believe they may have cracked the mystery of the end of the last ice age. The temperatures suddenly soared, and the glaciers went into retreat, because the deep southern ocean released huge quantities of carbon dioxide.
And the convincing answers have been delivered by analysis of the composition of calcium carbonate shells of ancient marine organisms.
The link between human burning of fossil fuels and the steady rise in atmospheric carbon dioxide levels was proposed more than a century ago and firmly established in the last 30 years.
But the ups and downs of planetary temperatures before the emergence of human civilisation are harder to explain. Fossil evidence suggests a link with carbon dioxide levels, but not necessarily a cause.
Bygone climates
Now paleoceanographer Miguel Martínez-Botí, from the University of Southampton, UK, and ocean and climate change researcher Gianluca Marino, from the Australian National University, report in Nature that they found their evidence in sediment cores – in effect, annual records of bygone climates – rich in the shells of tiny foraminifera called Globigerina bulloides.
This is a species that flourishes in conditions of high nutrients, acting as a kind of biological pump, gulping carbon from the atmosphere.
They found that high concentrations of carbon dioxide dissolved in surface waters of the southern Atlantic Ocean and the eastern equatorial Pacific coincided with rises in atmospheric CO2 at the end of the last ice age.
The implication is that these regions were the source of the carbon dioxide to the atmosphere.
At their coldest, during the ice ages, carbon dioxide levels fell to 185 parts per million. During the interglacials, when the world warmed and lions and hyenas roamed the plains of Europe, the carbon dioxide levels rose to 280 ppm.
Right now, thanks to human activity, CO2 levels are rising ominously towards 400 ppm.
The oceans are home to about 60 times more carbon than the atmosphere and can, it seems, surrender it rapidly.
“The magnitude and rapidity of the swings in atmospheric CO2 across the ice age cycles suggest that changes in ocean carbon storage are important drivers of natural atmospheric CO2 variations,” Dr Martínez-Botí says.
“Our findings support the theory that a series of processes operating in the southernmost sector of the Atlantic, Pacific and Indian oceans, a region known as the Southern Ocean, changed the amount of carbon in the deep sea.
Into the abyss
“While a reduction in communication between the deep sea and the atmosphere in this region potentially locks carbon away from the atmosphere into the abyss during ice ages, the opposite occurs during warm interglacial periods.”
To arrive at their conclusion, the scientists had to analyse subtle evidence from the isotopic composition of the carbonate shells, and then use mathematical techniques to reconstruct a story of a great, faraway sigh of carbon dioxide from the ocean to the atmosphere.
The finding, based on calculated probabilities, is incomplete as there may have been other forces also at play.
Gavin Foster, associate professor in isotope geochemistry at the University of Southampton, says: “While our results support a primary role for the Southern Ocean processes in these natural cycles, we don’t yet know the full story. Other processes operating in other parts of the ocean, such as the north Pacific, may have an additional role to play.”
LONDON − Scientists believe they may have cracked the mystery of the end of the last ice age. The temperatures suddenly soared, and the glaciers went into retreat, because the deep southern ocean released huge quantities of carbon dioxide.
And the convincing answers have been delivered by analysis of the composition of calcium carbonate shells of ancient marine organisms.
The link between human burning of fossil fuels and the steady rise in atmospheric carbon dioxide levels was proposed more than a century ago and firmly established in the last 30 years.
But the ups and downs of planetary temperatures before the emergence of human civilisation are harder to explain. Fossil evidence suggests a link with carbon dioxide levels, but not necessarily a cause.
Bygone climates
Now paleoceanographer Miguel Martínez-Botí, from the University of Southampton, UK, and ocean and climate change researcher Gianluca Marino, from the Australian National University, report in Nature that they found their evidence in sediment cores – in effect, annual records of bygone climates – rich in the shells of tiny foraminifera called Globigerina bulloides.
This is a species that flourishes in conditions of high nutrients, acting as a kind of biological pump, gulping carbon from the atmosphere.
They found that high concentrations of carbon dioxide dissolved in surface waters of the southern Atlantic Ocean and the eastern equatorial Pacific coincided with rises in atmospheric CO2 at the end of the last ice age.
The implication is that these regions were the source of the carbon dioxide to the atmosphere.
At their coldest, during the ice ages, carbon dioxide levels fell to 185 parts per million. During the interglacials, when the world warmed and lions and hyenas roamed the plains of Europe, the carbon dioxide levels rose to 280 ppm.
Right now, thanks to human activity, CO2 levels are rising ominously towards 400 ppm.
The oceans are home to about 60 times more carbon than the atmosphere and can, it seems, surrender it rapidly.
“The magnitude and rapidity of the swings in atmospheric CO2 across the ice age cycles suggest that changes in ocean carbon storage are important drivers of natural atmospheric CO2 variations,” Dr Martínez-Botí says.
“Our findings support the theory that a series of processes operating in the southernmost sector of the Atlantic, Pacific and Indian oceans, a region known as the Southern Ocean, changed the amount of carbon in the deep sea.
Into the abyss
“While a reduction in communication between the deep sea and the atmosphere in this region potentially locks carbon away from the atmosphere into the abyss during ice ages, the opposite occurs during warm interglacial periods.”
To arrive at their conclusion, the scientists had to analyse subtle evidence from the isotopic composition of the carbonate shells, and then use mathematical techniques to reconstruct a story of a great, faraway sigh of carbon dioxide from the ocean to the atmosphere.
The finding, based on calculated probabilities, is incomplete as there may have been other forces also at play.
Gavin Foster, associate professor in isotope geochemistry at the University of Southampton, says: “While our results support a primary role for the Southern Ocean processes in these natural cycles, we don’t yet know the full story. Other processes operating in other parts of the ocean, such as the north Pacific, may have an additional role to play.”
Thursday, September 25, 2014
Global sea levels rose up to 5 meters per century at the end of the last five ice age cycles
from phys.org, September 25, 2014

Credit: Tiago Fioreze / Wikipedia
Land-ice decay at the end of the last five ice-ages caused global sea-levels to rise at rates of up to 5.5 metres per century, according to a new study.
Read more at: http://phys.org/news/2014-09-global-sea-rose-meters-century.html#jCp
 Explore further: Antarctica could raise sea level faster than previously thought
http://phys.org/news/2014-09-global-sea-rose-meters-century.html
Land-ice decay at the end of the last five ice-ages caused global sea-levels to rise at rates of up to 5.5 metres per century, according to a new study.
Read more at: http://phys.org/news/2014-09-global-sea-rose-meters-century.html#jCp
An international team of researchers developed a 500,000-year record of sea-level variability, to provide the first account of how quickly sea-level changed during the last five ice-age cycles.
The results, published in the latest issue of Nature Communications, also found that more than 100 smaller events of sea-level rise took place in between the five major events.
Dr Katharine Grant, from the Australian National University (ANU), Canberra, who led the study, says: "The really fast rates of sea-level rise typically seem to have happened at the end of periods with exceptionally large ice sheets, when there was two or more times more ice on the Earth than today.
"Time periods with less than twice the modern global ice volume show almost no indications of sea-level rise faster than about 2 metres per century. Those with close to the modern amount of ice on Earth, show rates of up to 1 to 1.5 metres per century." [Note, however, that there is no past analogue for the current forcing of the climate.]
Co-author Professor Eelco Rohling, of both the University of Southampton and ANU, explains that the study also sheds light on the timescales of change. He says: "For the first time, we have data from a sufficiently large set of events to systematically study the timescale over which ice-sheet responses developed from initial change to maximum retreat."
"This happened within 400 years for 68% of all 120 cases considered, and within 1,100 years for 95%. In other words, once triggered, ice-sheet reduction (and therefore sea-level rise) kept accelerating relentlessly over periods of many centuries."
Professor Rohling speculates that there may be an important lesson for our future: "Man-made warming spans 150 years already and studies have documented clear increases in mass-loss from the Antarctic and Greenland ice sheets. Once under way, this response may be irreversible for many centuries to come."
The team reconstructed sea-levels using data from sediment cores from the Red Sea, an area that is very sensitive to sea-level changes because its only natural connection with the open (Indian) ocean is through the very shallow (137 metre) Bab-el-Mandab Strait. These sediment samples record wind-blown dust variations, which the team linked to a well-dated climate record from Chinese stalagmites. Due to a common process, both dust and stalagmite records show a pronounced change at the end of each ice age, which allowed the team to date the sea-level record in detail.
The researchers emphasise that their values for sea-level change are 500-year averages, so brief pulses of faster change cannot be excluded.
Explore further: Antarctica could raise sea level faster than previously thought
More information: "Sea-level variability over five glacial cycles" Nature Communications, DOI: 10.1038/ncomm6076
http://phys.org/news/2014-09-global-sea-rose-meters-century.html
Friday, September 12, 2014
Arctic Sea sediment cores going back 200,000 years: the 2014 International Expedition
En vanlig dag i mitt expeditionsliv
Efter den första tidens villervalla med att hitta och få ordning på alla saker och hitta sin egen plats i tillvaron ombord, så har rutinerna fallit på plats och åtminstone mina dagar är rätt lika varandra. Tänkte att jag skulle beskriva hur en vanlig arbetsdag ser ut:
Efter frukost, som serveras 7.45–8.15, är det dags för mig att gå ut till det blå tältet på fördäck och dela sedimentkärnor i halvor – eller ”splitta” dom, som vi säger. Det kommer nya kärnor i en aldrig sinande ström, och vi försöker splitta dom så snart som möjligt, men ligger ständigt efter.
Kärnorna är redan delade i längder på 1,5 meter eller kortare, och har scannats av ett instrument som mäter bland annat densitet och magnetiska egenskaper. Några har också redan tagits vattenprov ifrån genom hål borrade i linern (plaströret som sedimentet ligger i).

Jag delar sedimentet med ståltråd.

Sågar och knivblad på core splittern.

Core splitter med sedimentkärna.

Pedro med splittad sedimentkärna.
När kärnorna är delade bär vi in dem i labbet, där Pedro gör mätningar av några fysikaliska egenskaper på den ena halvan, som sedan packas in och sparas som ”arkivhalva”. Den andra halvan, ”arbetshalvan”, gör Laura och Tom en noggrann beskrivning av. De antecknar hur sedimentet ser ut, vid vilka djup vi ser förändringar i färg och kornstorlek och om förändringarna är skarpa eller gradvisa. Om vi hittar stenar, som sannolikt transporterats dit av is, eller större snäckskal noteras det också. Snäckskalen kan senare användas för att göra kol-14-dateringar. För att färgbeskrivningen inte ska bli helt subjektiv, använder man en färgkarta (soil color book) för att hitta den nyans som ligger närmast sedimentets. Man brukar se istiderna som grå lager, medan perioder av varmare klimat som nu, ger chokladbrun lera. Under tider då stora istäcken smälter av får man grövre material i sedimentet. I många kärnor ser vi bara den senaste istiden (ca 15–25 tusen år sedan), men vissa kan man se flera, åtminstone tre, och vi är då ungefär 150–200 tusen år tillbaka i tiden.
Medan experterna beskriver sedimentet, gör jag etikett- och märkningsarbete av provpåsar på löpande band. Alla prover måste vara märkta med vilken sedimentkärna de kommer ifrån, vilken sektion och vilket djup. Sedan, någon gång under eftermiddagen, börjar vi ta ut delprover ur arbetshalvan, för att titta på forntida småkryp och skal i mikroskåp, eller göra kemiska analyser senare. Även arbetshalvan packas sedan noga in och sparas för att kunna ta ut flera delprover senare. När vi hunnit så långt har klockan ofta hunnit bli sju-åtta på kvällen. I början bar vi alla inpackade kärnor direkt till kylcontainern på fjärde våningen – ganska tungt för en klen typ som mig – men efter några småincidenter med snubbel i trapporna och vind som gjorde det svårt att komma runt hörnen (och blåste min hjälm från huvudet över bord), har vi börjat bära kärnorna dagtid istället, när vi ligger still under provtagning.
Utöver splittande och provtagning, gör jag också pH-mätningar på vissa kärnor – men mer om det en annan gång.

Sedimentkärna med tydliga färg- och kornstorleksförändringar. Till höger sektion ett med bottenytan överst, därefter sektion två och tre till vänster. I nedre högra hörnet Munsell soil color book, som används för att bestämma färgnyanser.
|
| by Carina Johansson http://swerus-c3.geo.su.se/index.php/carinas-blog-leg2/307-en-vanlig-dag-i-mitt-expeditionsliv |
Tuesday, August 26, 2014
New study on climate history: Arctic sea ice influenced force of the Gulf Stream
from the Alfred-Wegener-Institut


http://www.awi.de/en/news/press_releases/detail/item/fram_strait_sea_ice_conditions_triggered_the_power_of_the_gulf_stream/
Bremerhaven, 15 August 2014. The force of the Gulf Stream was significantly influenced by the sea ice situation in the Fram Strait in the past 30,000 years. Scientists at the Alfred Wegener Institute, Helmholtz Centre for Polar and Marine Research (AWI) come to this conclusion in a new study that appears today in the journal Earth and Planetary Science Letters. On the basis of biomarkers in deposits on the seafloor, the geologists involved managed for the first time to reconstruct when and how the marine region between Greenland and Svalbard was covered with ice in the past and in what way the Gulf Stream reacted when the sea ice cover suddenly broke up. They concluded that when large amounts of Arctic ice drifted through the Fram Strait to the North Atlantic, the heat transport of the Gulf Stream declined noticeably.
For AWI geologist Juliane Müller the Fram Strait is a key region in the global oceanic circulation. “On the east side of this passage between Greenland and Svalbard warm Atlantic water flows to the north into the Arctic Ocean while on the west side cold Arctic water masses and sea ice push their way out of the Arctic into the North Atlantic. A considerable portion of the Atlantic water cools here on its way to the north and sinks to deeper layers. The circulation of the water caused in this manner drives the global band of oceanic currents like a giant pump and influences, among other things, how much heat the Gulf Stream transports towards Europe,” says the scientist.
If the pulse frequency of this circulation pump changes, this gives rise to direct changes in the climate – for instance, at the end of the past glacial period and during the transition to our present-day interglacial. “In the past 30,000 years the Gulf Stream has lost an extraordinary amount of force at least twice – once 17,600 years ago and about 12,800 years ago. Both times the climate in Europe consequently cooled down significantly – and now we also know why,” says Juliane Müller.
She and her AWI colleague Ruediger Stein were the first scientists to succeed in reconstructing the sea ice conditions in the Fram Strait for this critical period at the end of the last glacial and thus in finding a direct connection between changes in sea ice cover and fluctuations in the Gulf Stream.
A nine metre long sediment core served as a window into the past for the geologists. It was drilled on a Fram Strait expedition conducted on the research vessel Maria. S. Merian and has such clearly defined layers that the scientists can read it like a book. “This core stems from the western continental slope of Svalbard, a region with an unusually high sedimentation rate. That means a very large number of sediment particles – the stores of climate information – trickle to the seafloor. This is the only explanation for the fact that we find the climate data from five to ten years over a length of one centimetre in this core while it could easily be as many as 1,000 years per centimetre of sediment sample in cores from low-particle regions. And, of course, 1,000 years are much too long a period to be able to clearly identify short-term climate fluctuations at all,” explains Juliane Müller.
Two kinds of fossil molecules, also designated as biomarkers, served as indications of the existence and the duration of an ice cover for Juliane Müller. One kind is produced by diatoms living in the sea ice, the other by algae that prefer the open water. “The markers provide us with astonishing insights into the climate history of the Fram Strait. For instance, we now know that a thick ice cover did not form until after the actual high point of the last glacial period. However, it held for around 1,000 years and influenced the oceanic currents in the North Atlantic on a long-term basis,” says Juliane Müller.
The reason for this is that the ice cover delayed the breakup of the large ice sheets that covered large sections of Europe and North America at that time. “The sea ice stabilised the glacier fronts of these ice sheets like a dam wall and prevented icebergs from calving. Export of freshwater from the Arctic to the North Atlantic, which otherwise would have been enormous, was thus checked for a certain time,” explains the geologist.
When the ice cover then broke up within an extremely short time 17,600 years ago, tremendous ice masses poured into the North Atlantic. There they melted and released large volumes of freshwater. “This sudden freshening of the North Atlantic altered the density structure of the water and led to significant weakening of the Atlantic overturning circulation, or to put it more simply, to weakening of the Gulf Stream,” says Juliane Müller.
According to the study, a similar chain reaction occurred yet another time during the Younger Dryas around 12,800 years ago when enormous amounts of sea ice again left the Arctic moving towards the North Atlantic and heat transport via the Gulf Stream declined. “The results of our study show how important Arctic sea ice is for the global oceanic circulation and that sudden changes in the sea ice cover of the Arctic Ocean is directly connected with abrupt climate fluctuations,” says the AWI scientist.
She will now provide the newly obtained data to AWI’s climate modellers. “With the help of these specific data we can check how reliably our models depict the sea ice situation of the past 30,000 years. In this way the data from the past help us to improve our models and consequently enable us to make more precise statements on the future of the Gulf Stream,” states Juliane Müller.
Notes for Editors:
Original study: Juliane Müller / Ruediger Stein: High-resolution record of late glacial and deglacial sea ice changes in Fram Strait corroborates ice-ocean interaction during abrupt climate shifts. Earth and Planetary Science Letters, Earth and Planetary Science Letters, DOI: 10.1016/j.epsl.2014.07.016
Your scientific contact person at the Alfred Wegener Institute is: Dr Juliane Müller (e-mail: Juliane.Mueller@awi.de ; phone +49 471 288-2224); Sina Löschke, Dept. of Communications and Media Relations, is available for further questions (phone +49 471 4831-2008; e-mail: medien(at)awi.de).
http://www.awi.de/en/news/press_releases/detail/item/fram_strait_sea_ice_conditions_triggered_the_power_of_the_gulf_stream/
Subscribe to:
Posts (Atom)

 Posts
Posts





