Blog Archive

Showing posts with label Medieval Climate Anomaly. Show all posts

Sunday, March 23, 2014

NYT: Lessons from the Little Ice Age

by Geoffrey Parker, The New York Times, March 22, 2014

Columbus, Ohio — Climatologists call it the Little Ice Age; historians, the General Crisis.

During the 17th century, longer winters and cooler summers disrupted growing seasons and destroyed harvests across Europe. It was the coldest century in a period of glacial expansion that lasted from the early 14th century until the mid-19th century. The summer of 1641 was the third-coldest recorded over the past six centuries in Europe; the winter of 1641-42 was the coldest ever recorded in Scandinavia. The unusual cold that lasted from the 1620s until the 1690s included ice on both the Bosporus and the Baltic so thick that people could walk from one side to the other.

The deep cold in Europe and extreme weather events elsewhere resulted in a series of droughts, floods and harvest failures that led to forced migrations, wars and revolutions. The fatal synergy between human and natural disasters eradicated perhaps one-third of the human population.

There are two ways to consider the impact of climate change. We can predict the future based on current trends or we can study a well-documented episode of the past.

What happened in the 17th century suggests that altered weather conditions can have catastrophic political and social consequences. Today, the nation’s intelligence agencies have warned of similar repercussions as the planet warms — including more frequent but unpredictable crises involving water, food, energy supply chains and public health. States could fail, famine could overtake large populations and flood or disease could cross borders and lead to internal instability or international conflict.

Earth scientists have discerned three factors at work globally during the 17th century: increased volcanic eruptions, twice as many El Niño episodes (unusually warm ocean conditions along the tropical west coast of South America), and the virtual disappearance of sunspots, reducing solar output to warm the Earth.

The 17th century saw a proliferation of wars, civil wars and rebellions and more cases of state breakdown around the globe than any previous or subsequent age. Just in the year 1648, rebellions paralyzed both Russia (the largest state in the world) and France (the most populous state in Europe); civil wars broke out in Ukraine, England and Scotland; and irate subjects in Istanbul (Europe’s largest city) strangled Sultan Ibrahim.

Climate alone did not cause all the catastrophes of the 17th century, but it exacerbated many of them. Outbreaks of disease, especially smallpox and plague, tended to be more common when harvests were poor or failed. When an uprising by Irish Catholics on October 23, 1641, drove the Protestant minority from their homes, no one had foreseen a severe cold snap, with heavy frost and snow at a time and in a place that rarely has snow. Thousands of Protestants died of exposure, turning a political protest into a massacre that cried out for vengeance. Oliver Cromwell would later use that episode to justify his brutal campaign to restore Protestant supremacy in Ireland.

But the cold did take a more direct toll. Western Europe experienced the worst harvest of the century in 1648. Rioting broke out in Sicily, Stockholm and elsewhere when bread prices spiked. In the Alps, poor growing seasons became the norm in the 1640s, and records document the disappearance of fields, farmsteads and even whole villages as glaciers advanced to the farthest extent since the last Ice Age. One consequence of crop failures and food shortages stands out in French military records: Soldiers born in the second half of the 1600s were, on average, an inch shorter than those born after 1700, and those born in the famine years were noticeably shorter than the rest.

Few areas of the world survived the 17th century unscathed by extreme weather. In China, a combination of droughts and disastrous harvests, coupled with rising tax demands and cutbacks in government programs, unleashed a wave of banditry and chaos; starving Manchu clansmen from the north undertook a brutal conquest that lasted a generation. North America and West Africa both experienced famines and savage wars. In India, drought followed by floods killed over a million people in Gujarat between 1627 and 1630. In Japan, a mass rebellion broke out on the island of Kyushu following several poor harvests. Five years later, famine, followed by an unusually severe winter, killed perhaps 500,000 Japanese.

No human intervention can avert volcanic eruptions, halt an El Niño episode or delay the onset of drought, despite the possibility that each could cause starvation, economic dislocation and political instability. But, unlike our ancestors who faced these changes 350 years ago, today we possess both the resources and the technology to prepare for them.

Britain’s chief scientific officer has warned, for instance, that in the face of a seemingly inexorable rise in sea levels, “We must either invest more in sustainable approaches to flood and coastal management or learn to live with increased flooding.” In short, we have only two choices: pay to prepare now — or prepare to pay much more later.

The experience of Somalia provides a terrible reminder of the consequences of inaction. Drought in the region between 2010 and 2012 created local famine, exacerbated by civil war that discouraged and disrupted relief efforts and killed some 250,000 people, half of them under the age of 5.

In the 17th century, the fatal synergy of weather, wars and rebellions killed millions. A natural catastrophe of analogous proportions today — whether or not humans are to blame — could kill billions. It would also produce dislocation and violence, and compromise international security, sustainability and cooperation.

So while we procrastinate over whether human activities cause climate change, let us remember the range of climate-induced catastrophes that history shows are inevitable — and prepare accordingly.


Monday, February 10, 2014

Michael Mann: Global Warming Speed Bump? The Answer May Be Blowing in the Wind!

by Michael E. Mann, Huffington Post, February 10, 2014

An interesting new paper by Matthew England and colleagues just published in the journal Nature Climate Change tosses another hat in the ring when it comes to the so-called "hiatus" or "pause" (I prefer "speed bump") in global warming.
As I have discussed previously, the fact that global surface temperatures have not increased as much over the past decade as many climate models predict they should have, doesn't necessarily contradict the model predictions at all. In reality, the speed bump may simply reflect the short-term natural fluctuations of climate (and keep in mind that, by some measures such as the melting of Arctic sea ice, climate change is actually proceeding faster than the models have predicted):
Yet there are numerous explanations of the slowing of warming (unaccounted for effects of volcanic eruptions and natural variability in the amount of heat buried in the ocean) that do not imply a lower sensitivity of the climate to greenhouse gases.
The new paper by England et al. is relevant to the latter of the two potential explanations provided above, namely how much heat is being buried below the ocean surface.
The explanation for the speed bump, the authors say, might lie in the stronger-than-normal winds in the tropical Pacific for much of the past decade. The equatorial trade winds are responsible for the upwelling of cold deep water in the eastern equatorial Pacific (why the Galapagos Islands are a cold place to go swimming, despite being located near the equator). That cold water spreads out over a large part of the eastern and central tropical Pacific. Make those winds stronger, and you get cooler surface temperatures over a large region of Earth's tropics, and modestly lower global surface temperatures of 0.1-0.2 C (enough to explain much if not all of the slowing of global warming over this short time frame). The surface cooling is associated, in turn, with greater burial of heat beneath the ocean surface.
Such conditions are basically equivalent to the flip-side of El Niño, known as La Niña. In other words, the slowing of global warming may relate, at least in part, to the tendency for more frequent La Niña-like conditions in recent years. That gives us stronger trade winds in the eastern tropical Pacific, more burial of heat below the ocean surface, colder tropical Pacific sea surface temperatures, and slightly cooler global average temperatures than we might otherwise have seen.
The $64,000 question, then, is whether this increased tendency for La Niña-like conditions over the past decade is entirely natural in origin, or whether it might instead in some way be tied to climate change itself. If we are simply witnessing a temporary natural excursion that is part of an internal oscillation in the climate system, then things might easily turn around in the years ahead. Just as we are getting lulled into a sort of false complacency about the rate of global warming, we may be caught by surprise as the natural oscillation swings in the other direction, and the globe warms even faster than the models predict it should.
On the other hand, if we are instead seeing a subtle effect of global warming in which increased greenhouse gas concentrations are, seemingly paradoxically, favoring the colder  state of the climate system, then future global warming might end up being just a bit less than many of the current climate models are predicting. Keep in mind that the effect in question only amounts to at most one or two tenths of a degree C, and business-as-usual fossil fuel emissions are likely to warm the globe by 4-5 C (7-9 F) by the end of the century. So we're talking about a very minor correction. But nonetheless, it would potentially constitute a small additional negative feedback in the climate system, and a slight mitigation of future warming in comparison with prevailing climate models currently project.
As it happens, I have been arguing for this possibility for some time now, a somewhat inconvenient fact for those who would prefer to label me a "climate change alarmist." ;-)
In the section "It's the Anomalies, Stupid" of Chapter 6 ("A Candle in the Dark") of my book The Hockey Stick and the Climate Wars, I discuss work I published more than a decade ago that provides some possible evidence for a mechanism known as the tropical Pacific ocean thermostat whereby global warming, counter-intuitively, leads to a greater prevalence for La Niña-like conditions.
As I describe in the book, it all relates to controversial research by another climate scientist that dates back nearly 30 years:
In the mid-1980s, a scientist named Paul Handler from the University of Illinois had suggested a relationship between explosive tropical volcanic eruptions and the timing of major El Niño events, but his findings were based on only a short interval of time: the instrumental record available back through the late nineteenth century.
Other properly skeptical scientists argued that the statistical relationship was not very robust -- remove one major volcanic eruption, for example, and the relationship is no longer statistically significant -- and there was no convincing physical explanation given for why this relationship between volcanic eruptions and El Niño events should exist in the first place.
My colleagues and I used the paleoclimate reconstructions that we had published in the late 1990s to further test this hypothesis:
With the longer-term record of El Niño events that we now had from our proxy temperature reconstructions (we could reliably reconstruct the history of El Niño back through the early seventeenth century), we could see whether the relationship held up over a time period that was both longer than, and completely independent of, the modern period Handler had analyzed. What's more, Amy Clement and Mark Cane of Columbia's Lamont Doherty Earth Observatory had provided an important link in establishing a plausible physical mechanism for the purported relationship. In a provocative 1997 article, they used the so-called Cane-Zebiak model of the El Niño phenomenon to demonstrate that the very same mechanisms responsible for El Niño held some counterintuitive implications for how the tropical Pacific Ocean and atmosphere system might respond to an external heating. The mechanism they identified, known as the "tropical Pacific Ocean thermostat," implied that the eastern and central tropical Pacific might actually cool down! The pattern of cooling resembled the opposite of El Niño -- La Niña -- and it resulted from subtle ways that wind patterns and ocean currents influence each other in the equatorial Pacific. Clement, Cane, and collaborators argued that this mechanism could paradoxically cause the climate to look more like the cold La Niña state even as global warming proceeds.
As I go on to explain:
If the thermostat mechanism caused the climate to look more like La Niña in response to heating (by either increased greenhouse gas concentrations or an upturn in solar output), it ought -- my colleagues and I reasoned -- to exhibit an El Niño-like pattern in response to the cooling influence of an explosive volcanic eruption. Not any old volcanic eruption would do; the volcanic aerosols would have to block out sunlight from reaching the surface of the tropical Pacific Ocean, something that -- because of large-scale wind patterns -- only a tropical eruption will do. It made perfect sense to us, now, why Handler had seen a clear relationship only with tropical volcanic eruptions. We confirmed Handler's original findings in our own independent analysis of the relationships between volcanic activity and El Niño over the past several centuries.
Some of our more recent work appears to provide further support for the mechanism from the paleoclimate record (see this more detailed discussion from a few years ago at the climate blog RealClimate I contribute to):
We showed in recent work, for example, that the same mechanisms described above may help to explain many of the now-better-established features of the medieval climate anomaly. For example, the La Niña-like temperature pattern in the tropical Pacific we have discerned for the MCA [Medieval Climate Anomaly] when solar output was high and volcanic eruptions were few, seems to be consistent with the tropical Pacific thermostat mechanism.
Finally, this matter illustrates how scientific uncertainty is not necessarily our friend when it comes to projected climate change impacts, and it provides a good example of true healthy scientific skepticism (as opposed to the sort of denialism/contrarianism that is too often passed off as 'skepticism'):
The implications of this seemingly innocuous finding are not trivial. It suggests the possibility that heating by increased greenhouse gas concentrations could lead to a more La Niña-like state of the climate, associated, for example, with intensified drought in the desert Southwest and increased Atlantic hurricane activity. If the minority of climate models that produce that response are correct, we might see a greater exacerbation of these effects than the IPCC currently projects.
We have then a genuine area of uncertainty in the science with significant potential societal implications, one where a healthy dose of skepticism is warranted in interpreting the predictions of state-of-the-art models. Climate scientists continue to seek more data and make further refinements in the models as they strive to resolve this issue. Here we are very much in the midst of science's erratic path forward.
The latest study by England et al. reflects the latest excursion of this erratic path. Stay tuned!
Michael Mann is Distinguished Professor of Meteorology at Pennsylvania State University and author of "The Hockey Stick and the Climate Wars: Dispatches from the Front Lines(now available in paperback with a new guest foreword by Bill Nye "The Science Guy")
Follow Michael E. Mann on Twitter: www.twitter.com/MichaelEMann

Saturday, April 20, 2013

Andrew Glikson: Another link between CO2 and mass extinctions of species

by Andrew Glikson, The Conversation, March 22, 2013

It’s long been known that massive increases in emission of CO2 from volcanoes, associated with the opening of the Atlantic Ocean in the end-Triassic Period, set off a shift in state of the climate which caused global mass extinction of species, eliminating about 34% of genera. The extinction created ecological niches which allowed the rise of dinosaurs during the Triassic, about 250200 million years ago.

New research released this morning in Science Express has refined the dating of this wave of volcanism. It shows marine and land species disappear from the fossil record within 20,000 to 30,000 years from the time evidence for the eruption of large magma flows appears, approximately 201 million years ago. These volcanic eruptions increased atmospheric CO2 and increased ocean acidity.

Mass extinctions due to rapidly escalating levels of CO2 are recorded since as long as 580 million years ago. As our anthropogenic global emissions of CO2 are rising, at a rate for which no precedence is known from the geological record with the exception of asteroid impacts, another wave of extinctions is unfolding.

Mass extinctions of species in the history of Earth include:
  • the ~580 million years-old (Ma) Acraman impact (South Australia) and Acrytarch (ancient palynomorphs) extinction and radiation
  • Late Devonian (~374 Ma) volcanism, peak global temperatures and mass extinctions
  • the end-Devonian impact cluster associated with mass extinction, which among others destroyed the Kimberley Fitzroy reefs (~360 Ma)
  • the upper Permian (~267 Ma) extinction associated with a warming trend
  • the Permian-Triassic boundary volcanic and asteroid impact events (~ 251 Ma) and peak warming
  • the End-Triassic (201 Ma) opening of the Atlantic Ocean, and massive volcanism
  • an End-Jurassic (~145 Ma) impact cluster and opening of the Indian Ocean
  • the CretaceousTertiary boundary (K-T) (~65 Ma) impact cluster, Deccan volcanic activity and mass extinction
  • the pre-EoceneOligocene boundary (~34 Ma) impact cluster and a cooling trend, followed by opening of the Drake Passage between Antarctica and South America, formation of the Antarctic ice sheet and minor extinction at ~34 Ma.
Throughout the Phanerozoic (from 542 million years ago), major mass extinctions of species closely coincided with abrupt rises of atmospheric carbon dioxide and ocean acidity. These increases took place at rates to which many species could not adapt. These events – triggered by asteroid impacts, massive volcanic activity, eruption of methane, ocean anoxia and extreme rates of glaciation (see Figures 1 and 2) – have direct implications for the effects of the current rise of CO2.


Click on graphs to enlarge.

Figure 1. Trends in atmospheric CO2 and related glacial and interglacial periods since the Cambrian (542 million years ago), showing peaks in CO2 levels (green diamonds) associated with asteroid impacts and/or massive volcanism. CO2 data from Royer (2004 and 2006).


Figure 2. Relations between CO2 rise rates and mean global temperature rise rates during warming periods, including the PaleoceneEocene Thermal Maximum, early Oligocene, mid-Miocene, late Pliocene, Eemian (glacial termination), DansgaardOeschger cycles, Medieval Warming Period, 17502012 and 19752012 periods.

In February 2013, CO2 levels had risen to near 396.80 ppm at Mauna Loa Atmospheric Observatory, compared to 393.54 ppm in February 2012. This rise (3.26 ppm per year) is at the highest rate yet recorded. Further measurements show CO2 is at near 400 ppm of the atmosphere over the Arctic. At this rate the upper stability threshold of the Antarctic ice sheet, defined at about 500–600 ppm CO2 would be reached later this century (although hysteresis of the ice sheets may slow down melting).

Our global carbon reserves (including coal, oil, oil shale, tar sands, gas and coal-seam gas) contain considerably more than 10,000 billion tonnes of carbon (see Figure 5). This amount of carbon, if released into the atmosphere, is capable of raising atmospheric CO2 levels to higher than 1,000 ppm. Such a rise in atmospheric radiative forcing will be similar to that of the PaleoceneEocene boundary thermal maximum (PETM), which happened about 55 million years ago (see Figures 1, 2 and 4). But the rate of rise surpasses those of this thermal maximum by about ten times.


Figure 3. Plot of percent mass extinction of genera versus peak atmospheric CO2 levels at several stages of Earth history.


Figure 4. The PaleoceneEocene Thermal Maximum (PETM) represented by sediments in the Southern Ocean, central Pacific and South Atlantic oceans. The data indicate: (a) deposition of an organic matter-rich layer consequent on extinction of marine organisms, (b) lowering of δ18O values representing an increase in temperature, and (c) a sharp decline in carbonate contents of sediments representing a decrease in pH and increase in acidity (Zachos et al. 2008).

The PaleoceneEocene boundary thermal maximum event about 55 million years ago saw the release of approximately 2,0003,000 billion tons of carbon to the atmosphere in the form of methane (CH4). It led to the extinction of about 3550% of benthic foraminifera (see Figures 3 and 4), representing a major decline in the state of the marine ecosystem. The temperature rise and ocean acidity during this event are shown in Figures 4 and 6.

Based on the amount of carbon already emitted and which could continue to be released to the atmosphere (see Figure 5), current climate trends could be tracking toward conditions like those of the PaleoceneEocene event. Many species may be unable to adapt to the extreme rate of current rise in greenhouse gases and temperatures. The rapid opening of the Arctic Sea ice, melting of Greenland and west Antarctic ice sheets, and rising spate of floods, heat waves, fires and other extreme weather events may signify a shift in the state of the climate, crossing tipping points.


Figure 5. CO2 emissions from fossil fuels (2.12 GtC ~ 1 ppm CO2). Estimated reserves and potentially recoverable resources.

By analogy to medical science analysing blood count as diagnosis for cancer, climate science uses the greenhouse gas levels of the atmosphere, pH levels of the ocean, variations in solar insolation, aerosol concentrations, clouding states at different levels of the atmosphere, state of the continental ice sheets and sea ice, position of high pressure ridges and climate zones and many other parameters to determine trends in the climate. The results of these tests, conducted by thousands of peer-reviewed scientists world-wide, have to date been ignored, at the greatest peril to humanity and nature.

Continuing emissions contravene international laws regarding crimes against humanity and related International and Australian covenants. In the absence of an effective global mitigation effort, governments world-wide are now presiding over the demise of future generations and of nature, tracking toward one of the greatest mass extinction events nature has seen. It is time we learned from the history of planet Earth.


Figure 6. The PaleoceneEocene boundary thermal maximum. http://www.uta.edu/faculty/awinguth/petm_research/petm_home.html

Andrew Glikson does not work for, consult to, own shares in or receive funding from any company or organisation that would benefit from this article, and has no relevant affiliations.

The Conversation
This article was originally published at The Conversation. Read the original article.

Tuesday, March 26, 2013

The characteristics and likely causes of the Medieval megadroughts in North America


by Richard SeagerCeline Herweijer and Ed Cook
Lamont-Doherty Earth Observatory of Columbia University
Severe though the six multi-year droughts since the mid nineteenth century have been in terms of environmental and social impacts, as climate events they were dwarfed by a series of megadroughts that struck the West between about 900 and 1400 AD. These droughts were sufficiently long in duration that it actually makes more sense to describe the Medieval climate of the West as not so much afflicted by a sequence of droughts but as simply more arid than in subsequent centuries or now.
The visual evidence of medieval megadroughts in the landscape today
The medieval droughts were long before the beginning of instrumental weather records and their character and severity must be reconstructed from the signature they left within the environment. One of the most dramatic of these is frequently seen by travelers in the mountains states of the West who probably rarely understand what they are seeing. Dead tree stumps, seasonally flooded by water, are often seen in river valley bottoms in the Sierra Nevada and they also populate the underwater margins of famous lakes such as Mono Lake. In the early 1990s Scott Stine, a University of California geographer, began using carbon dating to determine when these trees were living and found that they pretty much all grouped in the medieval period. See Scott Stine's article at www.yosemite.org. The trees were living in river valleys and around lakes that, because the climate was drier, never flooded. When the medieval megadrought period ended, waters rose and the trees died. Elsewhere in the high plains of Nebraska and elsewhere the medieval megadroughts can still be seen as massive sand dunes that are now grassed over and stable.
In a remarkable paper ("Late Quaternary bison population changes on the southern Plains," Plains Anthropologist, 19 (1974) 180-196), Tom Dillehay successfully sketched the medieval climatological history of the southern Great Plains based on little more than the numbers of bison bones found in archaeological sites. At this time few Indians were dependent on bison hunting -- that was yet to come when European expanded into the moister areas to the east and displaced Indians from areas where they both farmed and hunted. In Dillehay's study it is striking how few were the bison remains a millennium ago compared to the periods before and after. He also drew what now appears the correct conclusion -- the climate was drier and bison populations shrank as grasslands became desert.
The medieval megadroughts may also have left their signature on the human environment of the West. The great cliff cities in the four corners region of the West such as at Chaco Canyon and Mesa Verde were all abandoned towards the end of the drought. These societies were based on irrigated agriculture. Although there remains much debate about why these highly organized Indian societies collapsed archaeologists are revisiting the idea that decades of dry conditions were part of the reason (see Jones et al., "Environmental Imperatives Reconsidered: Demographic Crises in Western North America during the Medieval Climate Anomaly," Current Anthropogy, April 1999). By the time wetter conditions returned, the Spaniards had also arrived and probably prevented Indians from reestablishing irrigation-based complex urban societies.
Tree ring records of the spatial extent, severity and duration of droughts
The best record of the droughts come from the width of annual growth rings of long lived trees. Correlation of modern day ring widths with weather records has demonstrated that the ring width is strongly related to summer values of the so-called Palmer Drought Severity Index or PDSI. The PDSI was developed as a simple measure of the moisture content of soil in the root zone. It makes sense that the tree ring width would correlate with this during summer since that is the growth season. Analysis of ring widths from living trees that have lived in North America for as long as two millennia, together with plenty of complex statistics, allows preparation of maps of summer PDSI for each year from 2 BC to now. This data set was developed at the Tree Ring Laboratory at Lamont-Doherty Earth Observatory and is called the North American Drought Atlas (NADA). For the early centuries the coverage is limited to areas of the West with very long lived trees but by the beginning of the medieval droughts the coverage is pretty much all of the current United States.
In 2004, Ed Cook, of the LDEO Tree Ring Lab, published the first results from the NADA. One figure, reproduced here (Figure 1), of the percentage of the American West at any time effected by severe drought made a clear case for elevated aridity during the medieval period. For several hundred years up until the 15th century well over half the area routinely experienced severe drought at any time. The centuries to follow -- broadly coincident with the Little Ice Age period of a colder climate in Europe -- was wetter. There is a hint that we have been returning to a more arid climate since the beginning of the 19th century.
Figure 1
Top, the percent of the area of the American West experiencing moderate to severe drought at any one time as reconstructed from tree ring records over the last millennium. The time series has been filtered to emphasize variations on timescales of many decades to centuries. The lower panel shows a blowup for the last century emphasizing that the recent drought was not historically exceptional. The figure is taken from Cook et al. (2004, Science). During Medieval times serious drought affected large areas of the West. Following that there was a long period of more moderate drought (corresponding to the Little Ice Age) and, since then there appears to have been a return to a more drought stricken climate.

figure1

Tree ring records of modern droughts
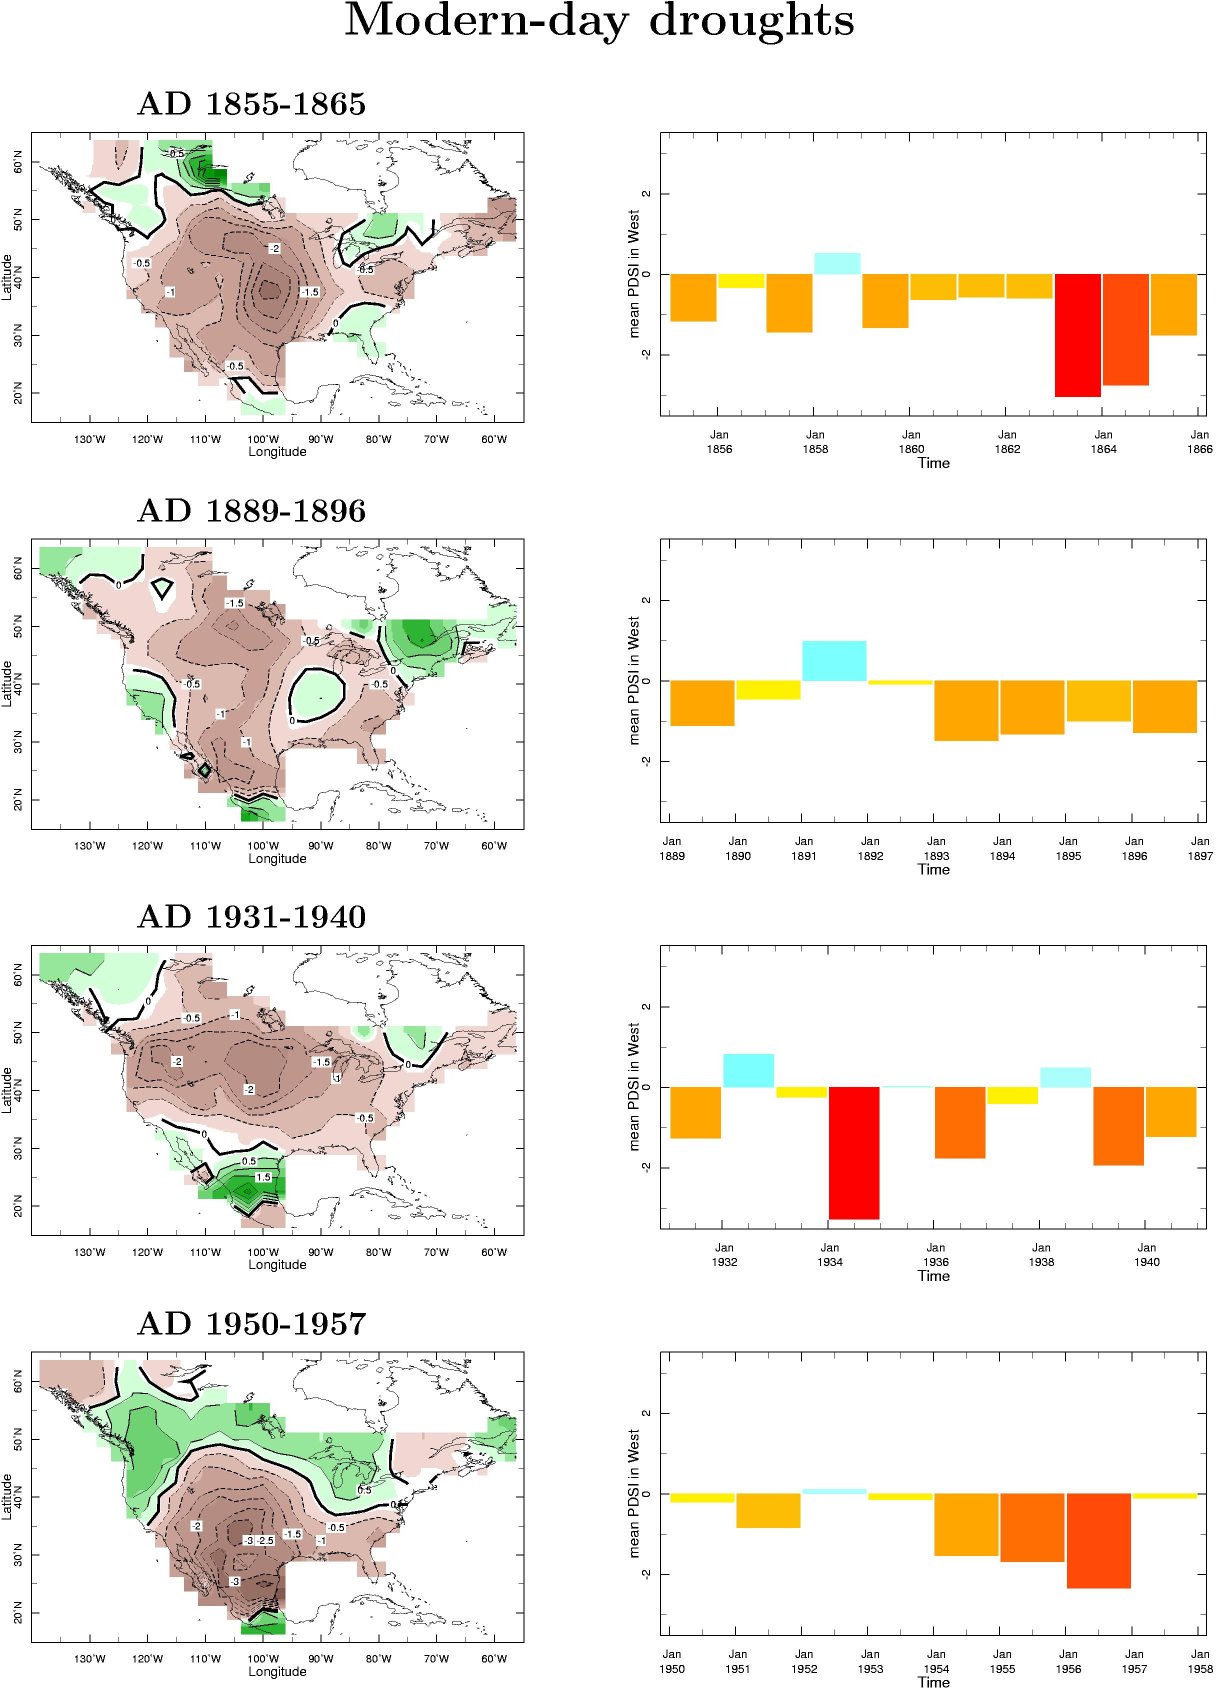
In the last year a collaboration between the Tree Ring Lab and the Climate Modeling and Diagnostics Group at LDEO has allowed a closer look at the tree ring records of drought. Figure 2 shows the summer PDSI reconstructed from the tree ring records for the modern day droughts as well as time series of the PDSI averaged over a region defined as the American West (25 N to 50 N and 125 W to 95 W) for the years covered by the droughts. By comparison to instrumental records, it is clear that the tree ring growths faithfully record the droughts. Each drought effected much of North America from the Appalachians to the Pacific coast and from the northern Mexico and the Gulf Coast into Canada. Each was also associated with weak tendencies to wetter conditions in the Pacific Northwest, maritime eastern Canada and southern Mexico. In the year by year evolution the multiyear droughts were made up of years of severe drought interrupted by more modest years and the occasional wet years. None appear monolithic in having dry conditions year after year after year although the Civil War drought comes closest to this.
Figure 2
Tree ring records of modern droughts. The spatial distribution of tree ring summer Palmer Drought Severity Index (PDSI) is at left and the PDSI averaged over the West is at right.

figure2

Spatial patterns of tree ring records of drought and related ocean conditions
Figure 3 shows the results of an analysis, by Rotated Empirical Orthogonal Functions (REOF), of the spatial patterns of the tree ring records of droughts during the modern period. The first pattern, which explains 32% of the total variance, well describes the observed droughts in covering most of the United States with weak opposite-signed regions in the northwest and northeast. The second and third patterns would better describe droughts more localized in the east and west of the continent.
Figure 3
Summer drought patterns from tree rings for the period 1000-2003 AD as estimated from Rotated Empirical Orthogonal Analysis. The fraction of the total variance explained by each REOF is indicated. According to Preisendorfer's Rule N (bottom right) these three patterns are physically distinct.

figure3

The patterns of sea surface temperature (SST) and sea level pressure (SLP) associated with these patterns can be reconstructed via linear regression onto the time series of the relevant REOF. This is shown in Figure 4. The first, dominant mode, is correlated with a La Niña-like SST and SLP pattern: cold in the tropical Pacific Ocean with warm anomalies in the mid-latitude Pacific, a cold Indian Ocean and a seesaw of SLP between the eastern and western hemispheres. The other two patterns do not seem to be linked into coherent and known patterns of ocean variability. The second pattern could, however, be related to the North Atlantic Oscillation.
Figure 4
The SST (left) and SLP (right) patterns associated with the first three REOF patterns of drought evaluated on the 1856-2003 period. Pattern 1 if a typical decadal La-Niña-like pattern. Pattern 2 could be the summer North Atlantic Oscillation. The third drought pattern does not seem to be related to any clear mode of SST variation. These results support our modeling work of the 1856 to current period in that tropical Pacific influence dominates but that there may be a secondary Atlantic influence too.

figure4

These results support our modeling work of the 1856 to current period in that tropical Pacific influence dominates but that there may be a secondary Atlantic influence too
Tree ring records of medieval droughts
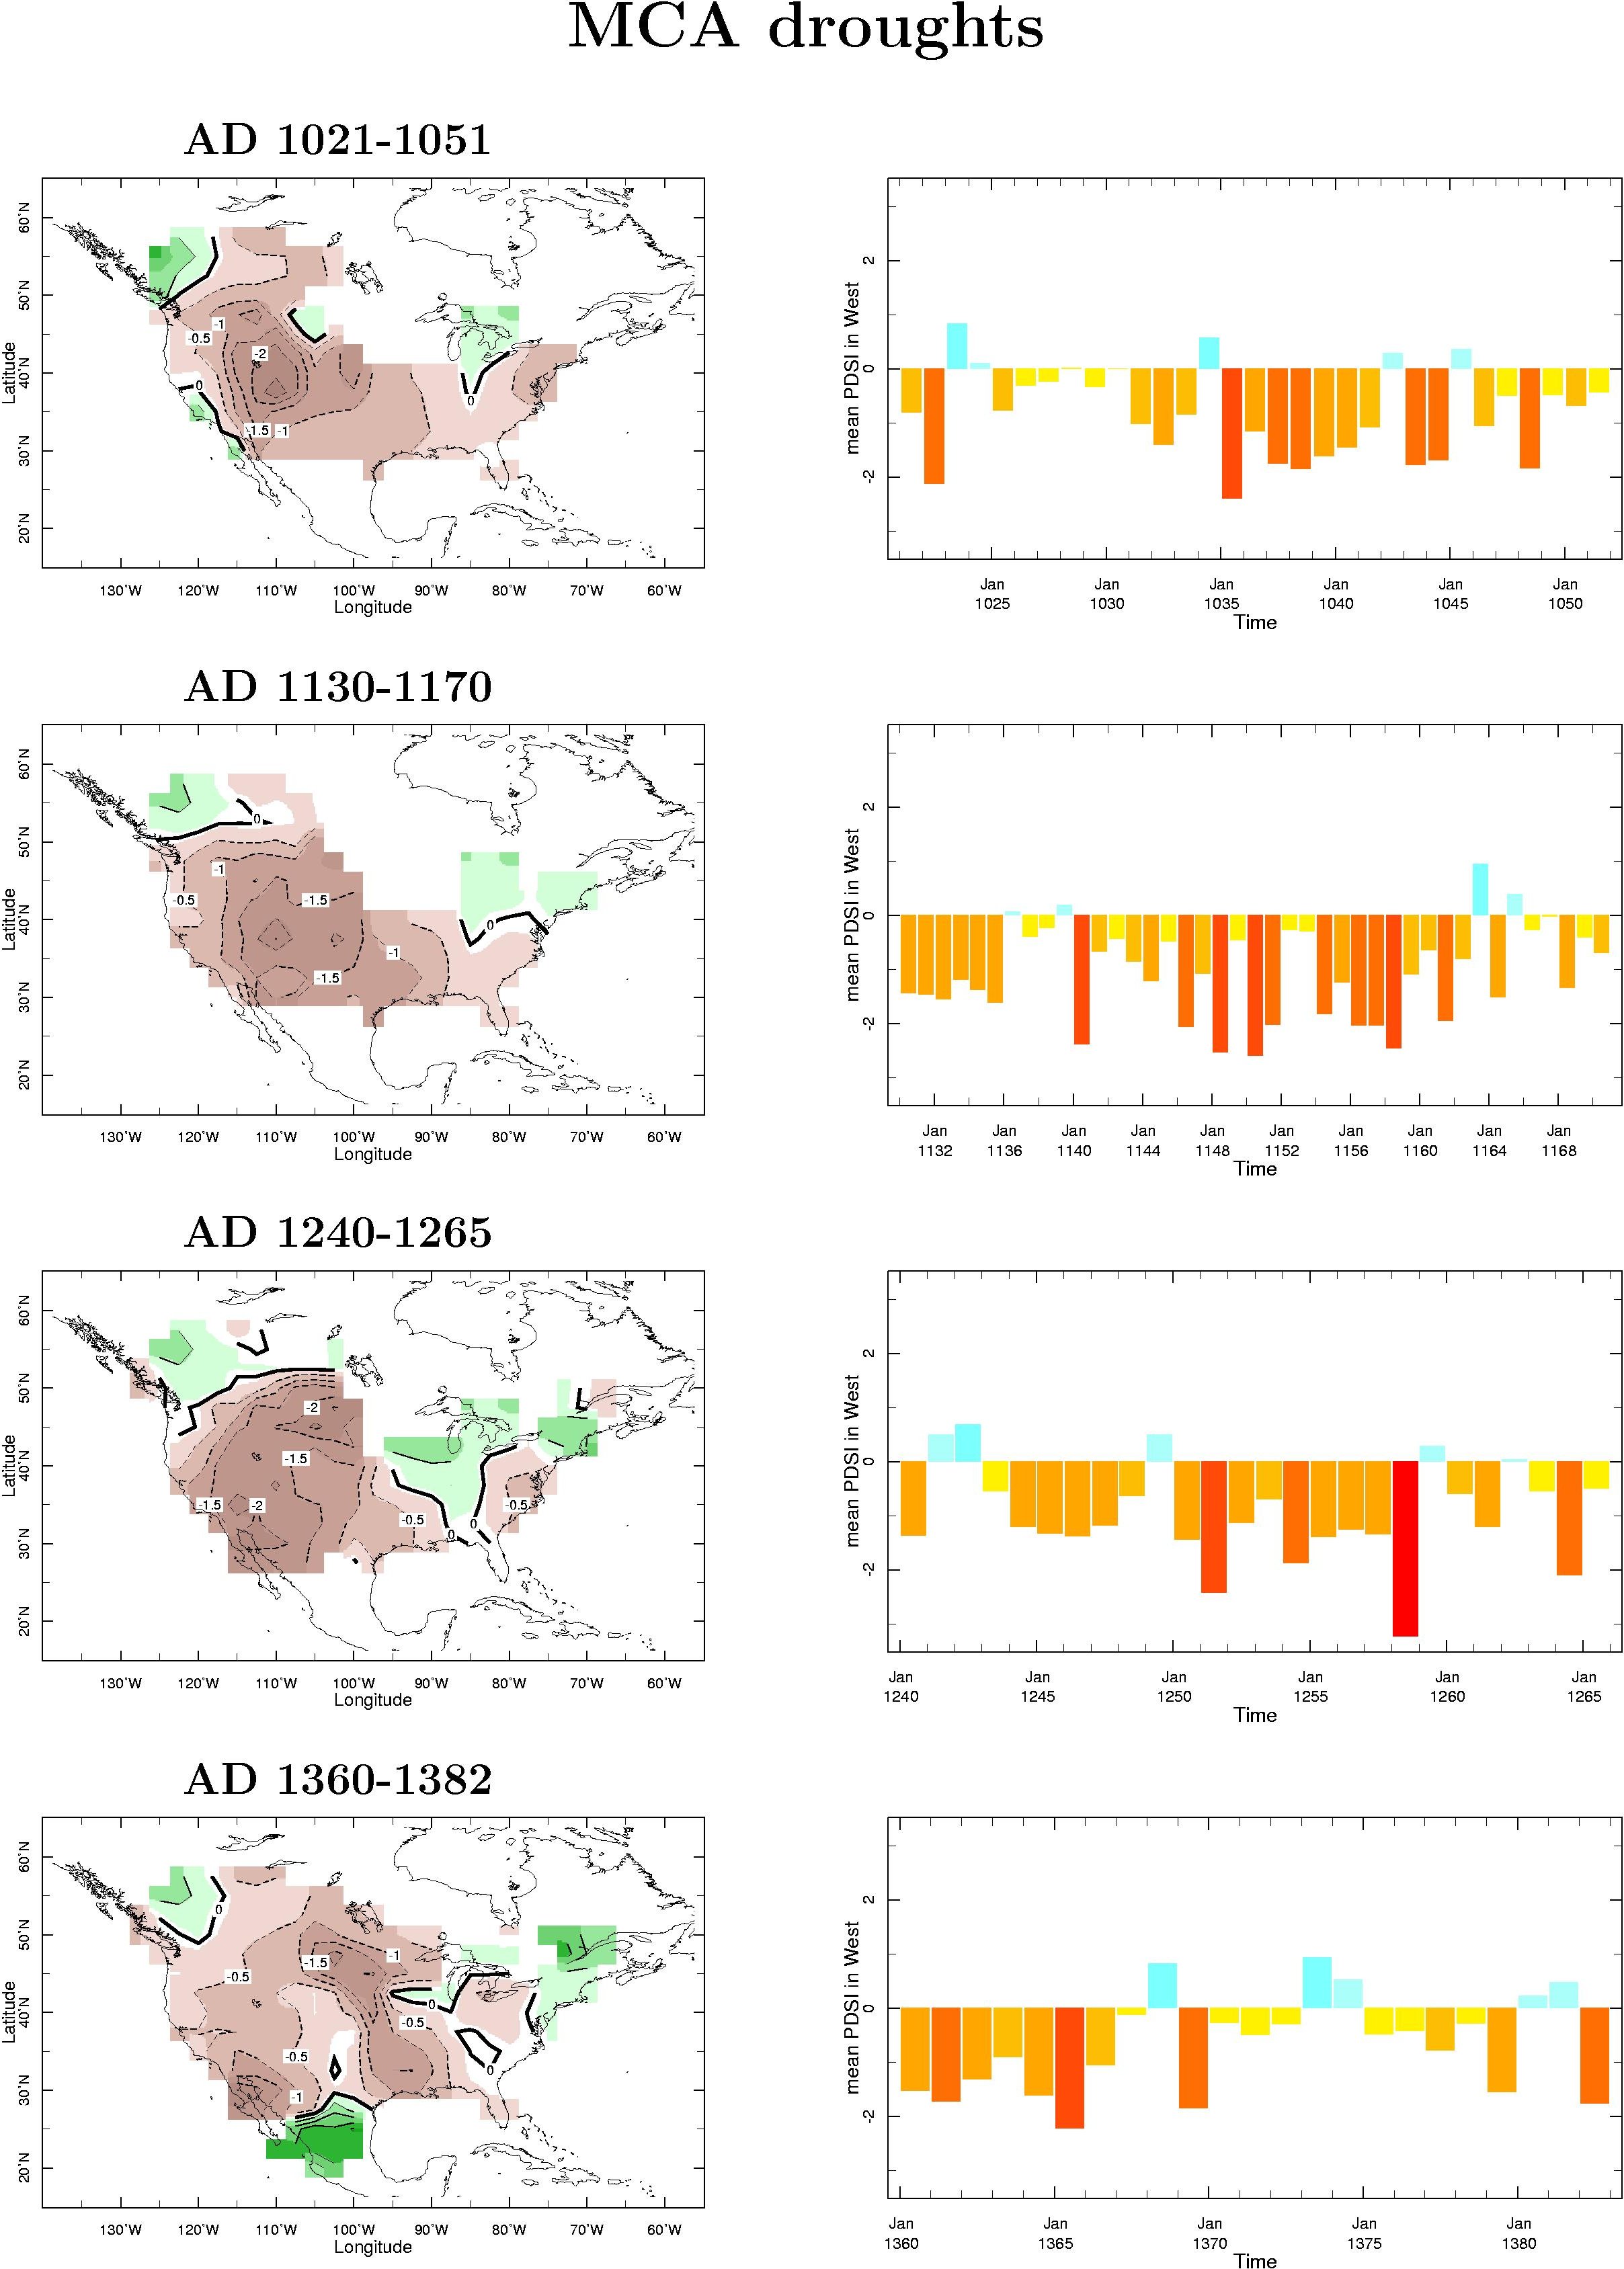
Figure 5 shows the spatial patterns and histories for a collection of medieval megadroughts. (Note that the time series in this figure extends over a much longer period of time than for the modern drought figure above.) Compared to the figures for the modern droughts what is remarkable is how similar the spatial pattern of the medieval droughts is to those with which we are familiar from experience and the instrumental record. The severity of drought in any year was also similar to that of a modern day drought. It is the year to year persistence of the medieval droughts that is different. Years as dry as 1936 or 1939 during the Dust Bowl drought frequently occurred year after year, and often with no break, (e.g., between 1140 and 1165) during medieval times.
Figure 5
Tree ring records of some medieval droughts. Spatial distribution is at left and the time history at right.

figure5

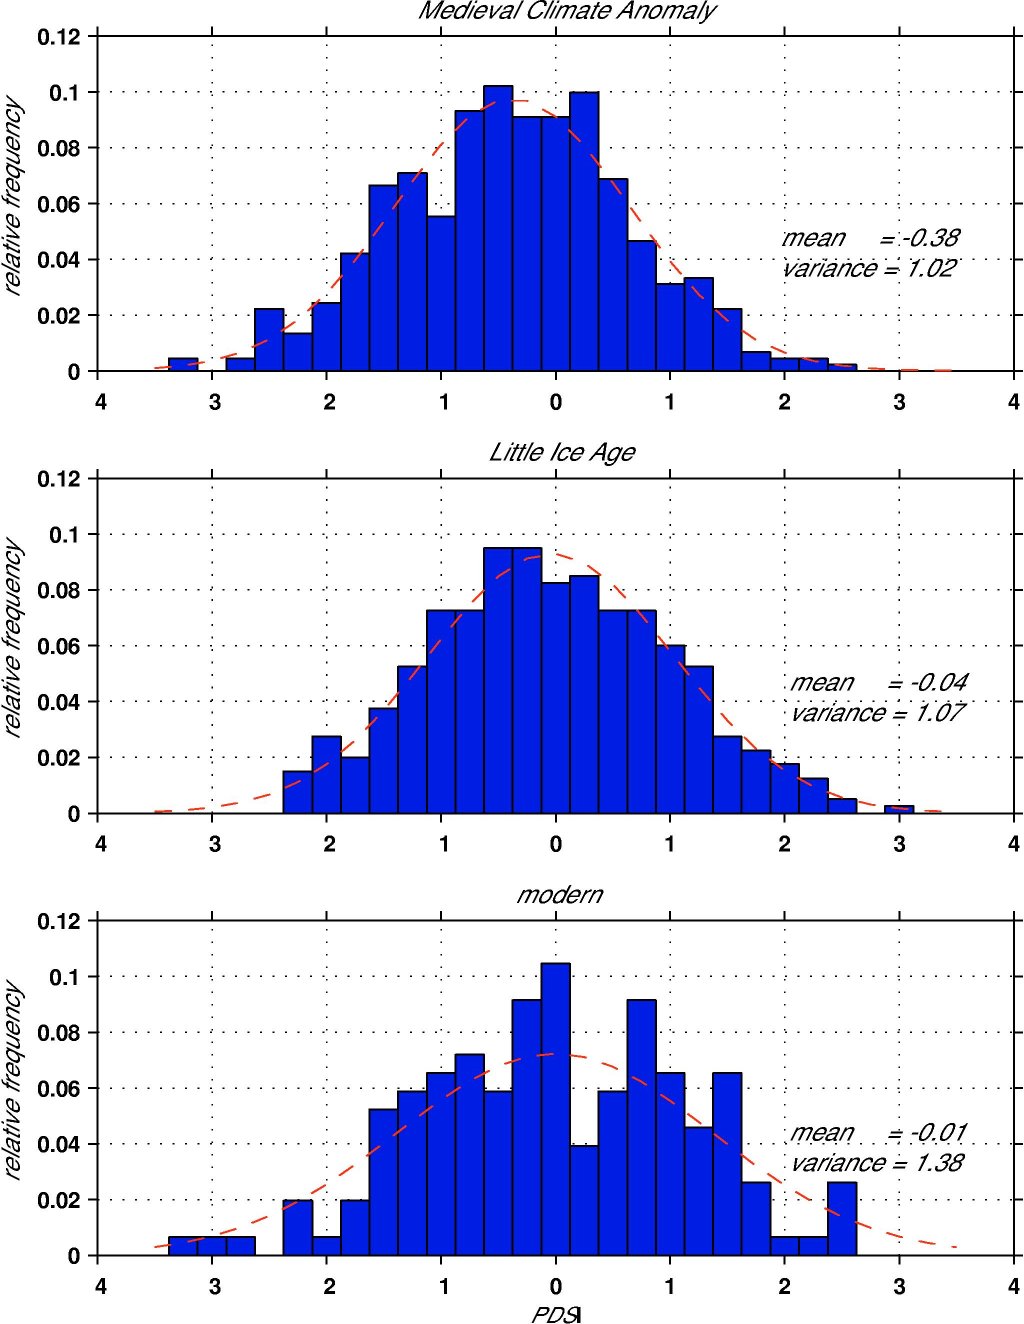
The year-to-year variability of drier and wetter conditions still occurred during the medieval period, albeit about a drier mean state. This is shown in Figure 6. Since ENSO currently influences such interannual variability this suggests that ENSO was operative then as now.
Figure 6
Histograms of annual summer tree ring derived PDSI for (top) the medieval period (or medieval climate anomaly (MCA)), (middle) the Little Ice Age and (bottom) the modern, post 1856, period.

figure6

These results suggest three obvious conclusions:
  1. The similarity of the spatial patterns suggests that the physical processes that caused the modern droughts also caused the medieval megadroughts.
  2. The global atmosphere ocean conditions that currently cause modern droughts for a few years at a time were the prevailing ocean climate during the medieval period.
  3. Despite the shift in the mean tropical ocean climate ENSO variability continued as now but oscillating about a colder mean state.
The global pattern of medieval hydroclimate
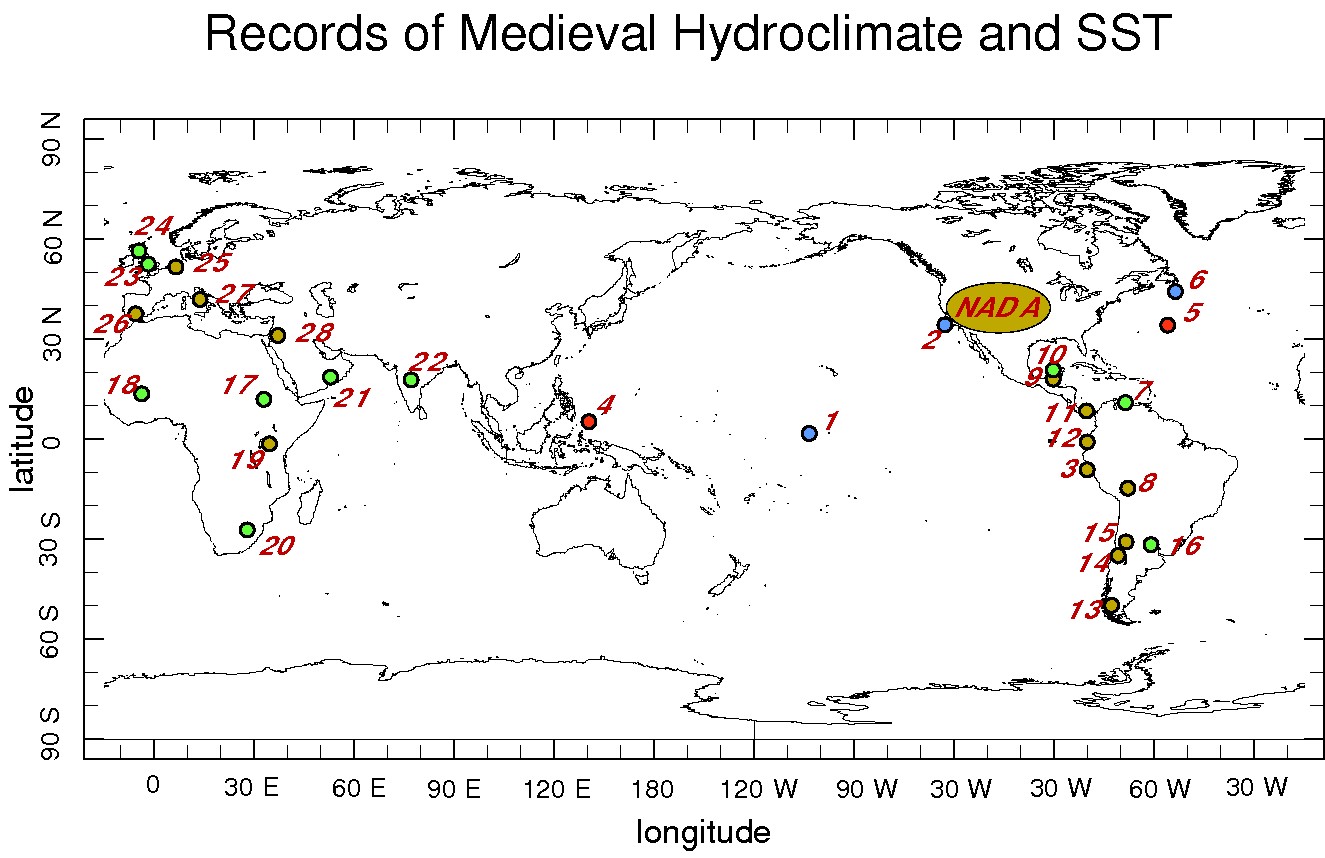
If a cooler tropical Pacific Ocean was the cause of the medieval megadroughts then, analogous to the historical period, we would also expect the climate to have been drier in southern South America, wetter in northern South America and Central America, wetter in the Sahel region of Africa but drier in coastal east Africa and drier in parts of the Mediterranean and southern Europe. There should also be evidence of colder ocean temperatures in the tropical Pacific. Figure 7 shows a compilation of proxy evidence (from trees, lake records, Nile flow records, ocean sediments, etc.) for hydroclimate conditions during the medieval period. Broadly speaking, the evidence of wet and dry conditions fits into the global pattern of hydroclimate change established for the historical period using satellite data, instrumental records and climate models. One of the more intriguing records comes from records of Nile flow. This tends to be low during El Niño events as rainfall is reduced over the headwaters of the White Nile. Therefore La Niña conditions tend to support high Nile flow. In a 1993 paper analyzing the Nile records, Quinn shows that low flows were only half as common during the medieval period as they were during the subsequent Little Ice Age!
Figure 7
Proxy evidence for medieval hydroclimate. Brown indicates a proxy indicator of dry conditions and green an indicator of wet conditions. The pattern resembles that of the global hydroclimate associated with modern day North American droughts.

figure7

For the tropical Pacific Ocean itself there is only one published record of reconstructed ocean temperatures -- based on the geochemistry of corals found on the island of Palmyra and analyzed by Kim Cobb, see web page. She interprets her data to indicate a colder tropical Pacific ocean during the periods of the medieval epoch for which she has data. Consequently, despite considerable limitations of the proxy evidence, to date it does support the idea that, during medieval times, the global hydroclimate tended towards what we would now call a La Niña-like state.
A first attempt to use the coral data to try to model the megadroughts can be found here.

Sunday, September 23, 2012

"The Norse in Greenland and late Holocene sea-level change," by N. Mikkelsen, A. Kuijpers & J. Arneborg, Polar Record; doi: 10.1017/S0032247407006948

Polar Record, 44(1) (January 2008) 4550; doi: 10.1017/S0032247407006948 

The Norse in Greenland and late Holocene sea-level change 

Naja Mikkelsen and Antoon Kuijpers (Geological Survey of Denmark and Greenland, Øster Voldgade 10, 1350 Copenhagen, Denmarkand Jette Arneborg (Greenland Research Centre at the National Museum of Denmark, Fredriksholms Kanal 12, 1220 Copenhagen, Denmark)
Abstract

Norse immigrants from Europe settled in southern Greenland in around AD 985 and managed to create a farming community during the Medieval Warm Period. The Norse vanished after approximately 500 years of existence in Greenland leaving no documentary evidence concerning why their culture foundered. The flooding of fertile grassland caused by late Holocene sea-level changes may be one of the factors that affected the Norse community. Holocene sea-level changes in Greenland are closely connected with the isostatic response of the Earth's crust to the behaviour of the Greenlandic ice sheet. An early Holocene regressive phase in south and west Greenland was reversed during the middle Holocene, and evidence is found for transgression and drowning of early-middle Holocene coast lines. This drowning started between 8 and 7 ka BP in southern Greenland and continued during the Norse era to the present. An average late Holocene sea level rise in the order of 2–3 m/1,000 years may be one of the factors that negatively affected the life of the Norse Greenlanders, and combined with other both socio-economic and environmental problems, such as increasing wind and sea ice expansion at the transition to the Little Ice Age, may eventually have led to the end of the Norse culture in Greenland.

http://journals.cambridge.org/action/displayAbstract?fromPage=online&aid=1439260

Thursday, August 16, 2012

Jason Box: Greenland albedo lowest since 1150 A.D.


2012 summer Greenland ice reflectivity, lowest since year 1150?


by Jason Box, Melt Factor blog, August 15, 2012

After a weeklong delay in data availability from a 61st satellite maneuver in 13 years to makeup low earth orbit drag, we find Greenland ice reflectivity (a.k.a. albedo) returning toward higher values, evidence of fresh snowfall accumulation and accompanying lower temperatures now as the melt season approaches its end. The latest average Greenland ice reflectivity (69.2%) from 13 August is at a level still below 1 standard deviation from the 2000-2009 10-year ‘climatology.’ 2012 values are right on track with the previous record low year 2011.

Larger and more numerous albedo dips
Apparently distinct from previous years in number and intensity of low albedo (evidence of melt) episodes, the 2012 melt season is characterized by 4 anomalous lows, centered on: 2 June (71.4%); 27 June (67.4%); 16 July (64.0%); and 1 August (65.2%).

The albedo lows are punctuated by the brightening effect of snowfall events. There could be a late season melt episode as in 2004 or 2003.


Below, a similar pattern is evident at the highest (coldest) 700 m (2,000 ft) of the ice sheet.


Lowest albedo since year 1150?
The July 16 low was the lowest in the satellite observational record and coincided with 97% of the ice sheet surface area melting. Previous maximum melt extent values since 1978 (when satellite obseravations begin, this is what NASA meant by “unprecedented”) are under 60% of the ice sheet area. Because the 2012 summer temperature was warmer than previous years (as I tweeted 5 August: June 2012, warmest on record for Greenland’s capital Nuuk since at least 1866 when continuous record keeping began, +7.2 C vs +4.3 C average), warmer than 1929 by at least 0.5 deg. C, and if the near surface air temperature records, continuous since 1840, are any indication (Box et al. 2009) this albedo anomaly and accompanying melt extent is probably without precedent since the Medieval Warm Period when the Norse settled Greenland.  Greenland temperature variability is high and there is evidence during the late Medieval Warm Period of a warm period in year 1150, that is 862 years before present (Kobashi et al. 2011). Other factors than warming that could have temporarily lowered Greenland ice reflectivity include the effect of major volcanic eruptions or wild fires. The latter I speculated here. The former has a noteworthy cooling effect but could conceivably still blanket the ice sheet with low reflectivity soot.
Kobashi et al. (2011), Fig. 1.

The albedo work is based largely on:
  • Box, J. E., Fettweis, X., Stroeve, J. C., Tedesco, M., Hall, D. K., and Steffen, K.: Greenland ice sheet albedo feedback: thermodynamics and atmospheric drivers, The Cryosphere, 6, 821-839, doi:10.5194/tc-6-821-2012, 2012. open access
Works Cited
  • Box, J.E., L. Yang, D.H. Browmich, L-S. Bai, 2009: Greenland ice sheet surface air temperature variability: 1840-2007, J. Climate, 22(14), 4029-4049, doi:10.1175/2009jcli2816.1. PDF
  • Kobashi, T., K. Kawamura, J. P. Severinghaus, J.‐M. Barnola, T. Nakaegawa, B. M. Vinther, S. J. Johnsen, and J. E. Box (2011), High variability of Greenland surface temperature over the past 4000 years estimated from trapped air in an ice core, Geophys. Res. Lett., 38, L21501, doi:10.1029/2011GL049444.
  • http://www.meltfactor.org/blog/?p=725

Saturday, July 28, 2012

Richard Muller, NYT op-ed: The Conversion of a Climate Change Skeptic


The Conversion of a Climate-Change Skeptic


CALL me a converted skeptic. Three years ago I identified problems in previous climate studies that, in my mind, threw doubt on the very existence of global warming. Last year, following an intensive research effort involving a dozen scientists, I concluded that global warming was real and that the prior estimates of the rate of warming were correct. I’m now going a step further: Humans are almost entirely the cause.
My total turnaround, in such a short time, is the result of careful and objective analysis by the Berkeley Earth Surface Temperature project, which I founded with my daughter Elizabeth. Our results show that the average temperature of the earth’s land has risen by two and a half degrees Fahrenheit over the past 250 years, including an increase of one and a half degrees over the most recent 50 years. Moreover, it appears likely that essentially all of this increase results from the human emission of greenhouse gases.
These findings are stronger than those of the Intergovernmental Panel on Climate Change, the United Nations group that defines the scientific and diplomatic consensus on global warming. In its 2007 report, the I.P.C.C. concluded only that most of the warming of the prior 50 years could be attributed to humans. It was possible, according to the I.P.C.C. consensus statement, that the warming before 1956 could be because of changes in solar activity, and that even a substantial part of the more recent warming could be natural.
Our Berkeley Earth approach used sophisticated statistical methods developed largely by our lead scientist, Robert Rohde, which allowed us to determine earth land temperature much further back in time. We carefully studied issues raised by skeptics: biases from urban heating (we duplicated our results using rural data alone), from data selection (prior groups selected fewer than 20 percent of the available temperature stations; we used virtually 100 percent), from poor station quality (we separately analyzed good stations and poor ones) and from human intervention and data adjustment (our work is completely automated and hands-off). In our papers we demonstrate that none of these potentially troublesome effects unduly biased our conclusions.
The historic temperature pattern we observed has abrupt dips that match the emissions of known explosive volcanic eruptions; the particulates from such events reflect sunlight, make for beautiful sunsets and cool the earth’s surface for a few years. There are small, rapid variations attributable to El Niño and other ocean currents such as the Gulf Stream; because of such oscillations, the “flattening” of the recent temperature rise that some people claim is not, in our view, statistically significant. What has caused the gradual but systematic rise of two and a half degrees? We tried fitting the shape to simple math functions (exponentials, polynomials), to solar activity and even to rising functions like world population. By far the best match was to the record of atmospheric carbon dioxide, measured from atmospheric samples and air trapped in polar ice.
Just as important, our record is long enough that we could search for the fingerprint of solar variability, based on the historical record of sunspots. That fingerprint is absent. Although the I.P.C.C. allowed for the possibility that variations in sunlight could have ended the “Little Ice Age,” a period of cooling from the 14th century to about 1850, our data argues strongly that the temperature rise of the past 250 years cannot be attributed to solar changes. This conclusion is, in retrospect, not too surprising; we’ve learned from satellite measurements that solar activity changes the brightness of the sun very little.
How definite is the attribution to humans? The carbon dioxide curve gives a better match than anything else we’ve tried. Its magnitude is consistent with the calculated greenhouse effect — extra warming from trapped heat radiation. These facts don’t prove causality and they shouldn’t end skepticism, but they raise the bar: to be considered seriously, an alternative explanation must match the data at least as well as carbon dioxide does. Adding methane, a second greenhouse gas, to our analysis doesn’t change the results. Moreover, our analysis does not depend on large, complex global climate models, the huge computer programs that are notorious for their hidden assumptions and adjustable parameters. Our result is based simply on the close agreement between the shape of the observed temperature rise and the known greenhouse gas increase.
It’s a scientist’s duty to be properly skeptical. I still find that much, if not most, of what is attributed to climate change is speculative, exaggerated or just plain wrong. I’ve analyzed some of the most alarmist claims, and my skepticism about them hasn’t changed. [Guess he isn't going to apologize for his unfounded smears on real climatologists doing good science.]
Hurricane Katrina cannot be attributed to global warming. The number of hurricanes hitting the United States has been going down, not up; likewise for intense tornadoes. Polar bears aren’t dying from receding ice [the hell they aren't!], and the Himalayan glaciers aren’t going to melt by 2035 [nope but they are melting a lot faster than anyone thought they would]. And it’s possible that we are currently no warmer than we were a thousand years ago [and what does he found this statement on???], during the “Medieval Warm Period” or “Medieval Optimum,” an interval of warm conditions known from historical records and indirect evidence like tree rings. And the recent warm spell in the United States happens to be more than offset by cooling elsewhere in the world, so its link to “global” warming is weaker than tenuous.
The careful analysis by our team is laid out in five scientific papers now online at BerkeleyEarth.org. That site also shows our chart of temperature from 1753 to the present, with its clear fingerprint of volcanoes and carbon dioxide, but containing no component that matches solar activity. Four of our papers have undergone extensive scrutiny by the scientific community, and the newest, a paper with the analysis of the human component, is now posted, along with the data and computer programs used. Such transparency is the heart of the scientific method; if you find our conclusions implausible, tell us of any errors of data or analysis.
What about the future? As carbon dioxide emissions increase, the temperature should continue to rise. I expect the rate of warming to proceed at a steady pace, about one and a half degrees over land in the next 50 years, less if the oceans are included. But if China continues its rapid economic growth (it has averaged 10% per year over the last 20 years) and its vast use of coal (it typically adds one new gigawatt per month), then that same warming could take place in less than 20 years.
Science is that narrow realm of knowledge that, in principle, is universally accepted. I embarked on this analysis to answer questions that, to my mind, had not been answered. I hope that the Berkeley Earth analysis will help settle the scientific debate regarding global warming and its human causes. Then comes the difficult part: agreeing across the political and diplomatic spectrum about what can and should be done.