Blog Archive

Showing posts with label cyclones. Show all posts

Wednesday, January 17, 2018

2017’s costly climate change-fueled disasters are the ‘new normal,’ warns major reinsurer Munich Re

“We have a new normal” thanks to climate change, explains leading reinsurer.


by Joe Romm, Climate Progress, January 4, 2018


Hurricane Harvey Impacts. CREDIT: Getty Images
HURRICANE HARVEY IMPACTS. CREDIT: GETTY IMAGES


It turns out 2017 was a uniquely disastrous year in more ways than one, evidenced by German reinsurer Munich Re’s recently released review of the year’s global catastrophes.
Led by massive, climate change-fueled hurricanes Harvey, Irma, and Maria, 2017’s natural disasters will cost insurers a record $135 billion. Adding in uninsured losses brings the total global damages to $330 billion, which is second only to 2011.
“We have a new normal,” Munich Re’s Ernst Rauch told Reuters. Rauch, who runs the group tracking climate change risks, pointed out that “2017 was not an outlier” in having more than $100 billion in insured losses (see chart below). “We must have on our radar the trend of new magnitudes,” Rauch said.
The big reinsurers like Munich Re make their money by insuring the companies that directly insure your property. Those smaller companies are often required by law to buy reinsurance because they lack the capital resources to pay out if there is a major disaster, like superstorm Harvey for instance.
Since the reinsurers must pay out billions and billions of dollars for such mega-disasters, they have a unique incentive to understand and predict trends in mega-disasters. That’s why companies like Munich Re and Swiss Re have been at the forefront of warning businesses and the public about the rise in extreme weather events due to climate change.
Indeed, back in September 2010, another year of stunning warming-driven extreme weather events, Munich Re issued a release noting it had analyzed its catastrophe database, “the most comprehensive of its kind in the world,” and concluded, “the only plausible explanation for the rise in weather-related catastrophes is climate change.” 
Then in October 2012, the company released a massive 274-page report, “Severe weather in North America,” analyzing weather catastrophes and related losses since 1980 to understand trends and their causes, including man-made climate change.
Munich Re found that the number of weather-related loss disasters has been rising much faster in North America than anywhere else, and concluded, “Climate-driven changes are already evident over the last few decades for severe thunderstorms, for heavy precipitation and flash flooding, for hurricane activity, and for heatwave, drought and wild­fire dynamics in parts of North America.”
Prof. Peter Höppe, who heads Munich Re’s Geo Risks Research unit, said at the time, “In all likelihood, we have to regard this finding as an initial climate-change footprint in our U.S. loss data from the last four decades.”
And last April, Munich Re published an article on “rapid attribution,” which explained that we can now rapidly determine how much intensity or frequency of some extreme weather events is affected by man-made climate change. Learning that, for instance, climate change has sharply increased the chances of individual extreme rain and flooding events – such as devastating August 2016 deluge and flooding of Baton Rouge, Louisiana – allows communities to do better planning and Munich Re to do better risk management.
The latest annual report amplifies the message that humans are changing the climate, boosting the intensity and frequency of extreme weather events, and that the longer we dawdle, the higher the costs we will incur. The only question is, is anyone listening?

Sunday, April 2, 2017

Climate Code Red: Climate change pushing floods, cyclones to new extremes, with worse to come

by David Spratt, Climate Code Red, April 1, 2017


With Australia experiencing the aftermath of Cyclone Debbie and record-breaking rains and severe flooding in southeast Queensland and along the north coast of New South Wales, here’s a look at how global warming has, and will, push floods and cyclones to new extremes.

Flooding extremes

Warm air can be more humid than cold air, that is, it can hold more water vapour in absolute terms. And atmospheric water vapour content increases 7% for each 1-degree-Celsius increase in global average temperature, establishing the conditions for more intense rainfall events. 

Flash floods are likely to sweep across the Australian landscape with increasing intensity, particularly in urban or residential areas. Peak rainfall is predicted to soar with rising surface temperatures as Australia experiences ever greater extremes of heat.  

The frequency of major flood events (defined as events which caused extensive flooding within 50 kilometres of the coast, or inundation that extended 20 kilometres along the coast) along Australia's eastern seaboard has doubled in last 150 years, with climate change one of the possible factors, senior Bureau of Meteorology researchers say. 

Record-breaking heavy rainfall and a clear upward trend in downpours over the last 30 years fits in with global temperature rise caused by greenhouse gases. Statistical analysis of rainfall data from 1901 to 2010 around the globe, shows that from 1980 to 2010 there were 12% more of these intense events than would be expected in a climate without global warming. Wet regions generally saw a bigger increase in deluges and drier regions a smaller one. In southeast Asia, the observed increase in record-breaking rainfall events is as high as 56%.

Giant air streams pushing new extremes: The increase of devastating weather extremes in summer, including floods, is likely linked to human-made climate change, mounting evidence shows, with the recent discovery of giant airstreams circling the Earth, waving up and down between the Arctic and the tropics. These planetary waves transport heat and moisture. When these planetary waves stall, droughts or floods can occur. Warming caused by greenhouse-gases from fossil fuels creates favourable conditions for such events.

 “The unprecedented 2016 California drought, the 2011 U.S. heatwave and 2010 Pakistan flood, as well as the 2003 European hot spell, all belong to a most worrying series of extremes,” says Michael Mann, a lead author of the study. “The increased incidence of these events exceeds what we would expect from the direct effects of global warming alone, so there must be an additional climate change effect. In data from computer simulations as well as observations, we identify changes that favour unusually persistent, extreme meanders of the jet stream that support such extreme weather events. Human activity has been suspected of contributing to this pattern before, but now we uncover a clear fingerprint of human activity.”

Attribution studies show how the risk of a particular event may have changed due to the human influence on climate. Some attribution results surveyed by the World Meteorological Organisation include:

  • The US National Oceanic and Atmospheric Administration determined that human-caused climate change increased chances of the fatal and record rains in Louisiana by at least 40% and could have nearly doubled the odds of such a storm.
  • A scientific analysis of devastating 2014 floods in the United Kingdom, which cost an estimated $646 million in insurance losses, found that human-caused climate change has increased the chance of the extreme rain event by 43%.
  • In May–June 2016, portions of northeast France received 6 full weeks of rain in 24 hours. A formal attribution study released June 9, 2016, found that such extreme rains are at least 40%—and as much as 90%—more likely in some areas of France.
Cyclone extremes

Cyclones, in part, draw their energy from the temperature of the ocean's surface waters, so a warming climate and ocean puts more energy into storms, including cyclones, loading them with more rainfall, and stronger winds pushing more of a storm surge.
The recent Climate Council brief notes, “Increasing temperature of the surface ocean affects the intensity of cyclones, both maximum wind speeds and in the intensity of rainfall that occurs in association with the cyclone.”  The force exerted on buildings and structures when cyclones make landfall increases disproportionately with wind speed.

The Council also notes that: “Tropical cyclones form most readily when there are very warm conditions at the ocean surface and when the vertical temperature gradient through the atmosphere is strong. As this vertical gradient weakens as the climate continues to warm, it is likely that fewer tropical cyclones will form.”

Whilst the best evidence scientists have suggests cyclones are unlikely to increase in number, a 2013 study challenges the status quo, suggesting they will occur more frequently, as well becoming more intense. 

In 2013, researchers reported that the stronger hurricanes in the North Atlantic, the South Pacific, and South Indian Oceans have become more intense.  The same year, the UN meteorological agency concluded that climate change is making super typhoons worse. 

In 2015, an international research team found that a warming planet is already stoking the intensity of tropical cyclones in the northwest Pacific, and their ferocity will continue to increase even with moderate climate change over this century.

More broadly, a 2010 study found that "future projections based on theory and high-resolution dynamical models consistently indicate that greenhouse warming will cause the globally averaged intensity of tropical cyclones to shift towards stronger storms, with intensity increases of 2–11% by 2100...higher resolution modelling studies typically project substantial increases in the frequency of the most intense cyclones, and increases of the order of 20% in the precipitation rate within 100 km of the storm centre.

Recent records

With sustained wind speeds of more than 310 kilometres per hour, Typhoon Haiyan in the Philippines in November 2013 was the most powerful tropical cyclone to make landfall in recorded history. The previous record was held by Hurricane Camille, which in 1969 hit the state of Mississippi with wind speeds of just over 300 km/h. Data compiled from the US National Oceanic and Atmospheric Administration shows sea temperatures were about 0.5
1.0 degree Celsius above normal in the waters to the east of the Philippines as Haiyan began forming. The waters cooled in the storm's wake, an indication of how the storm sucked up energy.   

Hurricane Patricia which hit Mexico in October 2015 achieved a record peak intensity with maximum sustained winds 345 km/h, making it the most intense tropical cyclone on record in the Western Hemisphere, and the strongest globally in terms of 1-minute maximum sustained winds. Cyclone Winston in February 2016 was the strongest tropical cyclone to make landfall in Fiji and the South Pacific Basin in recorded history.

Attribution studies 

  • Superstorm Sandy which hit the northeast coast of the USA with devastating effect in October 2012 was made worse by unusually warm waters which increased the hurricane’s intensity. As well, human-caused sea level rise added to the storm surge, and on the stretch of the Atlantic Coast that spans from Norfolk to Boston, sea levels have been rising four times faster than the global average. Researchers say that “It is possible that subways and tunnels may not have been flooded without the warming-induced increases in sea level and storm intensity and size.”  More broadly, the authors say that “‘snowmaggedon’ in February 2010, superstorm Sandy in October 2012 , supertyphoon Haiyan in November 2013, and the Boulder floods of September 2013 were all influenced by high sea-surface temperatures that had a discernible human component.
  • The Climate Council reported that climate change exacerbated the damage caused by Cyclone Pam, which left a trail of destruction across Vanuatu in 2015.
Damage 

Reinsurance giant, MunichRe, says that "nowhere in the world are weather risks changing faster than in Eastern Asia," and concludes that "as a result of climate change... the intensity of typhoons will increase" in Eastern Asia.  On 11 November 2013, in the aftermath of super-typhoon Haiyan, MunichRe surveyed losses:

Eastern Asia has been hard hit by weather-related loss events in the past three decades. Their number has increased by more than a factor of four, causing overall losses from weather-related events of some US$ 700bn during this period. The insured losses of US$ 76bn amounted to only around 10% of overall losses, with 62% of these attributable to Japan. Floods caused 56% of the overall losses in Eastern Asia, but only 30% of insured losses. The number of floods has increased strongly and is expected to increase further in the coming decades. With insured losses of US$ 16bn, the 2011 Thailand floods caused the biggest-ever weather-related insured loss in the region. After floods, it is typhoons that cause the greatest weather-related losses. New analyses indicate a clear cycle of activity for typhoons, and increased typhoon activity is expected over the coming years..."
And in Australia, The Age reports that new modelling has shown that a cyclone the size of Debbie could have catastrophic consequences on the Gold Coast and as far as Brisbane, with winds of 260km/h, in areas where many homes and towers do not meet cyclonic safety standards. As climate change pushes cyclones further south, tens of billions of dollars worth of infrastructure is at risk. Actuaries, who predict and model scenarios for banks and insurers, have warned properties could become "uninsurable" as premiums rise up to 250% to meet this global warming challenge.

http://www.climatecodered.org/2017/04/climate-change-pushing-floods-cyclones.html

Friday, November 6, 2015

Global warming's fingerprints are all over recent extreme weather, research shows


Extreme-weather-repoert051


IMAGE: DANIEL KALISZ/GETTY IMAGES

by Andrew Freedman, Mashable, November 5, 2015

Extreme weather events, from droughts to floods and heat waves, are some of the most tangible present day impacts of global warming, and they will take center stage in speeches at the upcoming Paris Climate Summit. Now a new report gives leaders pushing to reduce emissions of global warming pollution, including President Obama, additional ammunition.
The report, published Thursday as a special supplement to the Bulletin of the American Meteorological Society, amounts to the largest-ever assessment of global warming’s role in intensifying the severity and altering the likelihood of extreme weather events during 2014.
It amounts to the equivalent of a climate change CSI report, and its conclusions are damning in pointing to global warming as being an accomplice to numerous damaging extreme events worldwide.
In total, the report contains analyses from 32 different research groups examining 28 extreme weather and climate events on all continents. The dozens of researchers from 21 countries found that climate change’s fingerprints are all over the scene of the crime in more than half of these events, including California wildfires, Middle Eastern drought and heat waves in Australia.
Specifically, tropical cyclones in the central Pacific, deadly heat waves in Australia, Asia and South America, and a deadly snowstorm in the Himalayas, were each in part the result of human activities, the studies show.
“For each of the past four years, this report has demonstrated that individual events, like temperature extremes, have often been shown to be linked to additional atmospheric greenhouse gases caused by human activities, while other extremes, such as those that are precipitation related, are less likely to be convincingly linked to human activities,” said Tom Karl, director of the National Centers for Environmental Information in Asheville, North Carolina.
“As the science of event attribution continues to advance, so too will our ability to detect and distinguish the effects of long-term climate change and natural variability on individual extreme events. Until this is fully realized, communities would be well-served to look beyond the range of past extreme events to guide future resiliency efforts."
These studies are part of a new and increasingly sophisticated subfield within climate science known as extreme event attribution, which involves attempts to tease out the influence of climate change, natural variability and other factors that go into extreme events.
Notably, each of the assessments of extreme climate events in Australia found clear evidence of human influences, including increased likelihood of a heat wave in Brisbane, Australia, heat waves in Adelaide and Melbourne in January 2014, record warm spring temperatures across Australia.

Man-made extremes

The events that had a man-made component to them included tropical cyclones that hit Hawaii, the Argentinean heat wave of 2013, and Australian heat waves.
Four separate studies by different scientific teams found that human influences, mainly in the form of increased emissions of global warming pollutants, caused a substantial increase in the likelihood and severity of several heat waves that struck Australia in 2014. These included events in Melbourne and in Brisbane, where extreme heat hit during the G20 Summit and global warming was conspicuously absent from leaders’ agenda.
For example, climate model simulations for 2014 indicated that man-made global warming “very likely increased the likelihood of hot and very hot November days in Brisbane by at least 25% and 44% respectively,” the G20 heat wave study concluded.
Another study published Thursday found that the record warm Australian spring of 2014, during which all-time temperature records were exceeded across the continent, “would likely not have occurred without increases in carbon dioxide over the last 50 years,” combined with weather patterns in the upper atmosphere.
Perhaps the most fascinating, albeit extremely deadly, event scientists analyzed was the blizzard that killed 43 people, including 21 trekkers, in the Himalayas. This storm resulted from the combination of Category 4 Tropical Cyclone Hudhud with other weather systems in a rare confluence of extreme events.
The study found that climate change increases the odds of such “unusual mergers” between tropical cyclones and upper level weather disturbances, because of the ways it is changing weather patterns in that region. The study detected a northward shift in intense tropical cyclones in the Bay of Bengal, as well as an intensification in the strongest storms that have occurred as water temperatures in the area have increased.
These changes have raised the risk of such storms in northeastern India and increased the frequency of extremely high amounts of moisture slamming up against the wall of the Himalayan Mountains in Nepal, where such water vapor falls as heavy snow.
“The implication of these results is that, although weather systems similar to that of 13–14 October 2014 did occur in the past, there is a tendency for both types of weather systems to interact more frequently,” the study said.
The Nepal disaster, which was the deadliest event in the history of Nepal’s mountain climbing history, had some similarities to Hurricane Sandy, when a massive tropical cyclone in the Western Atlantic interacted with a feature in the jet stream to bring several feet of snow to West Virginia while flooding parts of the East Coast with a deadly storm surge.
In addition, another study using computer modeling found that man-made global warming has increased the odds of unusually high sea surface temperatures in the western tropical Pacific Ocean and northeast Pacific Ocean. Such temperature extremes contributed to record heat in Alaska and whole scale shifts in the distribution of sea life, as well as changes in tropical cyclone behavior in the western tropical Pacific.

Many studies turned up little evidence of a man-made influence

Many studies did not turn up a man-made influence on particular extreme events, although every weather event today takes place in an atmosphere altered by man-made activities.
One study by scientists at Spain’s Barcelona Supercomputing Center, found that the all-time maximum in Antarctic sea ice in 2014 was mainly the result of unusual wind patterns that enhanced offshore production of sea ice. The study found that these winds, and the resulting spike in sea ice extent, are now less likely to occur due to climate change.
All-time maximum of Antarctic sea ice in 2014 resulted chiefly from anomalous winds that transported cold air masses away from the Antarctic continent, enhancing thermodynamic sea ice production far offshore. This type of event is becoming less likely because of climate change.
The authors of the overall report noted that attribution assessments are limited by the often limited observational records and limitations of computer models. “In general, when attribution assessments fail to find anthropogenic [man-made] signals this alone does not prove anthropogenic climate change did not influence the event,” the report states. “The failure to find a human fingerprint could be due to insufficient data or poor models and not the absence of anthropogenic effects.”

Looking back a year later: what’s the relevance to society?

The examination of 2014’s extremes demonstrates a major weakness of these studies so far, which is that they frequently take so long to be completed that they come months or a year or more after the events themselves. This is well after such events have disappeared from the news, and after many of the governmental leaders who dealt with these events — such as former Australian Prime Minister Tony Abbott — have left office.
Such studies often require supercomputing resources obtained either through national supercomputing centers — such as at Barcelona or the National Center for Atmospheric Research in Colorado — or distributed computing, in which everyday citizens use their home computers’ down time to perform computations for climate scientists. This project, known as Weather At Home, is led by a team in the U.K. and partially funded by The Guardian newspaper and Microsoft.
“Understanding our influence on specific extreme weather events is groundbreaking science that will help us adapt to climate change,” said Stephanie Herring, lead editor for the report.
“As the field of climate attribution science grows, resource managers, the insurance industry, and many others can use the information more effectively for improved decision making and to help communities better prepare for future extreme events.”
There are ongoing efforts to change this, however, and make more rapid assessments.
http://mashable.com/2015/11/05/extreme-weather-global-warming/

Saturday, March 21, 2015

Kerry Emanuel, Real Climate: Severe Tropical Cyclone Pam and Climate Change

by Kerry Emanuel, guest post, Real Climate, March 18, 2015

In the past 16 months, two exceptionally intense tropical cyclones, Haiyan and Pam, have struck the western Pacific with devastating effect. Haiyan may have had the highest wind speeds of any tropical cyclone on record, but we will never know for sure because we do a poor job estimating the intensity of storms that are not surveyed by aircraft. (Currently, only North Atlantic tropical cyclones are routinely reconnoitered by aircraft, and only if they threaten populated regions within a few days.) Pam’s analyzed intensity puts it within 10 knots of the most intense storms on record in the South Pacific, but here again this is within the error bars of satellite-derived intensity estimates.

pam2

Pam’s high intensity and terrible impact on Vanuatu have invariably raised the question of the possible effect of global warming on its characteristics. For example, Vanuatu’s President Baldwin Lonsdale blamed the disaster partly on climate change. Just as predictable is the backlash to the effect that no single event can be attributed to climate variations of any kind. What can we say about the effects of climate change on South Pacific tropical cyclones?

We can begin by looking at the record of tropical cyclones in that region. Unfortunately, for the reasons discussed above, these records are poor and those that exist only go back to about 1980, though there are longer records of storms making landfall in Australia. Perhaps the best existing analysis of South Pacific tropical cyclones is that of Kossin et al. (2013), who homogenized the satellite data record from 1982 to 2009 to create a temporally consistent record, and compared that to the problematic historical data base of storms over the world. While the historical data in the South Pacific region show a highly significant upward trend in the incidence of high intensity events, the satellite-based record shows a less prominent and significant trend of 2.5 m/s per decade with a value of 0.09. Thus there is some evidence of a trend toward higher intensity of high category tropical cyclones in the South Pacific over the period 1982-2009, but it is not conclusive and in any event spans a limited time interval.

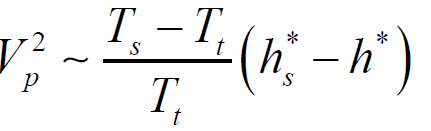
We can also look at trends in important environmental factors that are known to influence tropical cyclones. The usual suspect among these is sea surface temperature (SST) and there has been much talk about the elevated SST’s in the region where Pam developed. But SST by itself is not the main factor in the existing theory for the upper bound on tropical cyclone intensity, known as the potential intensity; instead, the potential intensity depends more nearly in the difference between SST and a measure of the bulk temperature of the troposphere as well as the temperature of the tropopause. An expression of the potential intensity, measured in maximum possible wind speed, is

igiffacj

where Vp is the potential maximum wind speed, Ts is the surface temperature, Tt is the tropopause temperature, hs* is the saturation moist static energy of the sea surface, and h* is the saturation moist static energy of the free troposphere, which is nearly uniform with height if the lapse rate is moist adiabatic. In the deep tropics, temperature is nearly uniform on pressure surfaces because there is not enough Coriolis acceleration to balance strong pressure gradients, thus h*, which is just a function of pressure and temperature, is horizontally as well as vertically uniform in the free troposphere. 

Therefore, the potential intensity depends mostly on variations of SST (which controls hs*) for climate variations that do not affect the mean temperature of the troposphere. But global warming very definitely does affect the temperature of the tropical free troposphere, so it is not possible to conclude, as alas many have, that increasing SST per se means increasing tropical cyclone intensity (though it usually does signify more TC-related rain).

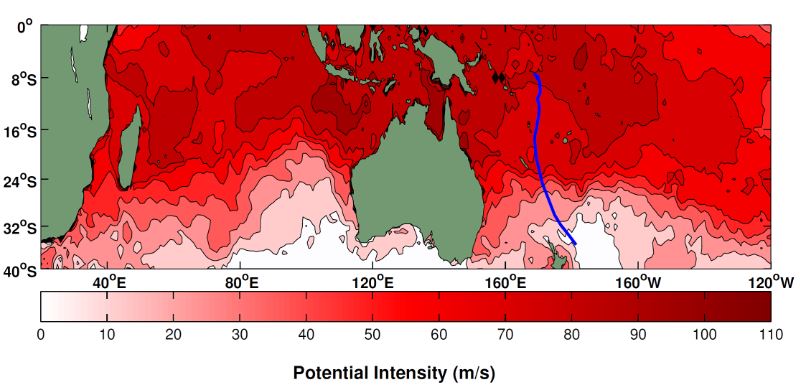
It is not difficult to calculate the actual potential intensity from SST and atmospheric soundings, and this can be done as well for reanalysis and global model data sets. The map below shows the potential intensity at 12 GMT on 7 March, 2015, calculated from the NCEP operational analysis at that time. 

The track of PAM is superimposed in blue.
pam_pi

Pam traversed a region of potential intensities around 75 m/s, consistent with the storm’s estimated peak intensity. These values are not unusual in this region, but for the past few decades they have been increasing, if the reanalyses are to be believed. I calculated potential intensity trends over the period 1980-2012 using three different reanalysis products: NASA’s MERRA, the European Center’s ERA Interim, and the NCAR/NCEP reanalysis. The MERRA and ERA Interim reanalyses show upward trends of around 2 m/s per decade in the region where Pam formed, while NCEP’s trend is closer to 3 m/s per decade; all these trends have values less than 0.1. These trends are broadly consistent with the Kossin et al. (2013) trend of 2.5 m/s per decade in the observed intensity of high category tropical cyclones in this region.

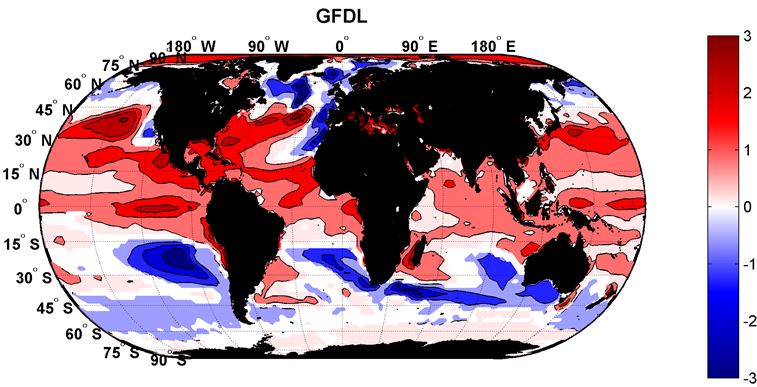
Thus the weight of evidence points to increasing potential intensity in the region where Pam developed, and consistent with this, increasing intensity of the highest category storms based on satellite-derived measurements. But to what do we attribute such increases? The roughly 30-year period over which we have reliable reanalyses and satellite measurements is too short to rule out the influence of natural climate variability, such as the Pacific Decadal Oscillation. We can at least check to see what kinds of trends climate models produce. I looked at eight CMIP 5 models whose output I had ready access to and calculated linear trends of potential intensity over the period 2006-2100 under the RCP 8.5 emissions pathway. The eight models were the NCAR CCSM4, a super-parameterized version of the same, referred to as SP-CAM, The GFDL CM3, the UKMO HADGEM-ES, the IPSL CM5A-LR, the Max Planck MPI-ESM-MR, the CCSR/NIES/JAMEST MIROC5, and the Meteorological Research Institute’s MRI-CGCM3. Of these, two models showed insignificant trends in the region in which Pam developed, and the rest showed positive trends averaging around 0.5 m/s per decade, considerably less than the observed trend over the last 30 years. The largest trend was produced by the GFDL model, whose global trend distribution is shown below. (White areas represent p values less than 0.1., and the units are m/s per decade.)

gfdl-pi

It is interesting that the largest increases are at the polar peripheries of the tropics, indicating a general expansion of the regions that are thermodynamically favorable for tropical cyclone development; this general feature is present in most of the model potential intensity trends as well as the reanalysis trends over the past 30 years, and may be behind the poleward migration of the latitudes at which observed tropical cyclones reach their peak intensity, as documented by Kossin et al. (2014).

The disparity between the reanalysis potential intensity trends over the past 30 years and the projected trends over this century suggests either that most of the observed increase in potential intensity (and actual intensity of high category storms) is due to natural variability, that decreasing anthropogenic aerosol loading over that period may have played a role, or that the model projections are too conservative. Yet the projected increase is not insignificant, amounting to about 5 m/s over 100 years. Note from the figure above that there are somewhat larger increases elsewhere, particularly in the northern hemisphere.

All of this is consistent with the strengthening consensus that the frequency of high category tropical cyclones should increase as the planet warms (Knutson et al., 2010). Basic theory and a variety of numerical simulations support this, as well as the projection that tropical cyclones should produce substantially more rain, owing to the increased moisture content of the tropical atmosphere. This is important because most destruction and loss of life are caused by high category storms and their attendant storm surges, and by freshwater flooding from torrential rains. Most of the disagreement in the literature on tropical cyclone projections concerns the incidence of weak storms, but these are usually far less consequential in spite of being more numerous.

Besides the oft-discussed issues of TC frequency and intensity, changes in genesis locations and tracks are potentially very important, as are the diameters of TCs, which affect the area covered by strong winds and which greatly affect the magnitudes of storm surges. In the present climate, the diameter of storms, as measured by the radius at which their circular wind component becomes indistinguishable from environmental winds, appears to be log normally distributed, with a mean around 420 km (Chavas and Emanuel, 2010). There is some indication from modeling studies that the size of the dangerous inner core scales with the potential intensity divided by the Coriolis parameter (Khairoutdinov and Emanuel, 2014). If this turns out to be true in nature, then storm inner core dimensions should increase over time.

While Pam and Haiyan, as well as other recent tropical cyclone disasters, cannot be uniquely pinned on global warming, they have no doubt been influenced by natural and anthropogenic climate change, and they do remind us of our continuing vulnerability to such storms. Destructive TCs in any one place tend to be generational…enough time for people to forget them and go back to risky behavior, including over-development of coastal regions. We adapt more successfully to the more frequent events which are always in the back of our minds (and often in the front). But this human adaptation time scale may be longer than the time over which climate change affects storms, so that comparatively small changes in the frequency of generational events can have large social consequences. When a 100-year event becomes a 50-year event, it may take a few destructive hits before we adapt to the new reality. This is of particular concern with tropical cyclones, where the application of existing damage models to projected changes in tropical cyclone activity predict large increases in damage, as documented, for example, in the recent Risky Business report commissioned by Michael Bloomberg, Hank Paulson, and Thomas Steyer*.

Now if only we could better measure tropical cyclones to record how they may change in coming years.
_________
* [Update, 1pm ET] It has been pointed out that in my reference to the Risky Business report, I might have mentioned that I contributed synthetic hurricane event sets that were used by Risk Management Solutions, Inc., to estimate damages from tropical cyclones.

References
Chavas, D. R., and K. A. Emanuel, 2010: A QuickSCAT climatology of tropical cyclone size.Geophys. Res. Lett.37. 10.1029/2010GL044558.
Khairoutdinov, M. F., and K. Emanuel, 2014: Rotating radiative-convective equilibrium simulated by a cloud-resolving model. J. Adv. Model. Earth Sys.5, In press.
Knutson, T. R., and Coauthors, 2010: Tropical cyclones and climate change. Nature Geosci.3,157-163.
Kossin, J. P., T. L. Olander, and K. R. Knapp, 2013: trend analysis with a new global record of tropical cyclone intensity. J. Climate26, 9960-9976.
Kossin, J. P., K. A. Emanuel, and G. A. Vecchi, 2014: The poleward migration of the location of tropical cyclone maximum intensity. Nature509, 349-352.

http://www.realclimate.org/index.php/archives/2015/03/severe-tropical-cyclone-pam-and-climate-change/

Wednesday, September 3, 2014

Australian insurance industry a stronghold against climate change

With a coast-dwelling populace, huge natural variability in rainfall and a heavy reliance on agriculture, Australia already feels the brunt of extreme weather more than most nations.

by Bernard Kellerman, Broker Buzz, Insurance Risk & Professional, September 3, 2014


All but one of the 20 largest property losses in the country in the past four decades have been weather-related and even though it accounts for just 2% of the global reinsurance market, Australia accounted for 6% of all losses in the five years to 2013.
There is near-universal consensus in the scientific community that climate change will cause more unpredictable and more extreme weather in the coming decades and that the process has already begun.
In Australia, that means more intense storms and storm surges, rising sea levels, wetter and drier extremes and increased flooding.
Insurance policies are typically issued on an annual basis but that hasn’t stopped insurers thinking long and hard about its impact and what role they can play.
In fact, Lloyd’s of London Head of Asia Pacific Kent Chaplin says: “The insurance industry sits at the forefront in helping to mitigate the impact of extreme weather.”
“Communities across Asia Pacific are highly exposed to these risks and catastrophe modelling firms and insurers need to account for surface sea level and air temperature rises in their modelling so we can better understand and prepare for their impact.
"Insurers can also help to strengthen defences against climate change by sharing our knowledge and expertise with the public sector to encourage climate change mitigation and adaptation strategies across the most vulnerable regions.”
Raising the stakes even higher is the fact demographic change keeps increasing the insurance sector’s exposure to adverse weather events, as explained by Allianz Australia Corporate Affairs General Manager Nicholas Scofield.
“The sea-changers and tree-changers have moved more property and assets into coastal areas and northern areas – for example, North Queensland – over recent decades,” he says.
“So, even if there was no change in the frequency of weather events, because we have more property exposed and the value of that property has gone up, any insurance claims will necessarily be higher than for similar events last century.”
Counting the cost
A recent report, compiled by Australia’s Climate Institute in association with consumer watchdog Choice, predicted that by 2050 the average home insurance premium could have almost doubled.
“There are a number of information barriers [to assessing true climate change effects on house prices] and we are saying that insurance premiums look like the canaries in the climate risk coal mine,” Climate Institute CEO John Connor says.
“It won’t be the same victims of natural disasters every time if the risk of extreme weather events and bushfires intensifies. That’s where the insurance sector has to make sure it’s in step with expectations.”
He says the problem is more of a property market failure than an insurance sector failure.
Further, some local governments continue to be reluctant to share detailed flood maps and other information that will allow more accurate risk assessment.
“Brokers, and the insurance industry generally, are the meat in the sandwich,” he says.
“The insurance companies, when they price premiums, are acting rationally.”
Pinpointed premiums
As average premiums increase, more granular risk data will become increasingly important as underwriters seek to sort out good risks from bad.
For instance, last year the Queensland Government announced it would share all its flood data with the industry, adding detail to many insurers’ already-sophisticated models.
Peter Jones, Zurich’s head of SME Underwriting, says flood cover can be offered sustainably for 95% of its business insurance policies, thanks to sophisticated flood data that has allowed his team to price risk accurately.
“That sounds great until you consider that less than 10% of properties have a flood risk and a large proportion of the 10% who don’t have flood cover are the ones most at risk of flood damage,” he says.
This, Allianz’s Nicholas Scofield suggests, is because severe flood risk can result in premiums that are five, 10 or 15 times the amount of premiums for similar houses that are not at risk.
After racking up $150 milliom in payouts for $4 million in premiums, Suncorp declared that homes and businesses in several central Queensland towns would not be offered in insurance.
“Our experience is that the vast majority of people most at risk will opt out of cover if they can," he says.
“This means brokers have a product that they can sell to someone with a high flood risk, but can’t afford to cover themselves for flood."
The downside of this is divergence in premiums, even for houses in adjacent streets, will become more common.
For example, in cyclone-prone areas, property premiums are influenced by the year of construction.
The dividing line for Allianz is 1982, when improved cyclone-proof building standards were introduced.
Now other factors are coming into play.
“The work on assessing flood risk means we are also able to look at whether properties are on flat land and close to the coast and determine if there is a storm surge risk when a cyclone hits,” Scofield says.
“Similarly, wind speeds increase as they move up the side of a hill increasing potential property damage.”
The majority of people in areas of low or medium to high risk will benefit most from the availability of more detailed data about flood risk for individual properties, as this gives insures more certainty in pricing, according to Colin Fagen, QBE Australia CEO.
However, there is more to be done by the industry as a whole, he suggests.
“With Australia’s exposure to natural perils, we need to focus more collaboratively on the preventative measures so we are reducing risk, particularly in relation to land development, risk awareness and mitigation initiatives.”
Karl Sullivan, the Insurance Council of Australia’s Policy Risk and Disaster Planning General Manager says, for instance, the industry is moving toward more precise assessment of bushfire risk at an address level, with better data on vegetation and landforms becoming more accessible.
This means of course that even before the climate noticeably dries out in some areas, as climate modelling has suggested, people in houses assessed as being highly vulnerable to bushfires are likely to see big loadings to their policies, much as people with flood-affected addressees have experienced, he warns.
“When it comes to address level rating for bushfire risk and premiums can be expected to diverge in much the same way as we have seen with flood cover,” Sullivan says.
The price to pay
Insurance affordability and boosting risk mitigation are two areas where the industry has been pushing hard.
“The argument shouldn’t really be about how insurers should lower their prices for people in high risk locations paying high premiums,” Sullivan says.
We need to focus more collaboratively on the preventative measures so we are reducing risk.
“It should be about listening to the price signal and working out how we can lower the probability of flooding for those people.”
One area where affordability can be increased is through tax reductions, not a popular topic in the current political environment, but one insurance industry leaders are keen to keep on the agenda.
“Numerous reviews, including the recent Henry Tax Review, have unanimously found that state taxes, duties and levies on insurance are inefficient to the point of being counterproductive,” QBE Australia CEO Colin Fagen says.
“Given the importance of insurance affordability and the implications of non- or under-insurance on the public purse, we believe it is time to act to remove all these specific imposts on insurance, as has previously been recommended.”
Insurance taxes are particularly regressive when one considers they are most keenly felt by those facing the largest risks, and therefore in most need of insurance.
When combined with the GST, taxes add around 20% to cost of premiums in many states, heightening unaffordability and lessening insurance’s reach where it is most needed.
However, an encouraging example is being set by the current ACT Government, which has been gaining industry praise for its progressive lowering of stamp duties on both life and general insurance products, with all such taxes to be abolished by 2016.
Leadership in promoting mitigation
Tax-free or not, insurance pricing plays a critical role in signalling to individuals, communities and government the existence and nature of specific risks.
Pricing should also encourage risk mitigation – either pushing developers to build to standards that will reduce the damage of a major weather event, or can amount to halting development in inappropriate areas, Fagen says.
NIBA CEO Dallas Booth agrees, and has been lobbying the Federal Government to grant the Council of Australian Governments greater powers to co-ordinate disaster mitigation planning on a national level.
The ICA’s Karl Sullivan says governments can drastically improve the built environment’s resistance to extreme weather in three ways.
“The first is land use planning; buildings need to be appropriate for their locations,” he says.
“The second side is building codes – they need to be updated to account for specific hazards, not just safety of life.
"You might get an incidental property protection benefit in a bushfire if the home is built to be “fireproof” for safety, but for most other hazards it’s just not taken into consideration.
"The third side is mitigation, to get the residual risk to property down to an acceptable level, by allowing actions such as clearing trees and undergrowth within a certain distance of homes."
Another industry leader, Suncorp Personal Insurance CEO Mark Milliner, has advocated strongly for more proactive government investment in mitigation infrastructure and changes to planning and building approval.
“Many communities in Queensland and Australia-wide could be better protected – and pay lower premiums – with the right funding and government policies,” he says.
And in the most unambiguous example of direct action, two years ago, after racking up $150 million in payouts for $4 million in premiums, Suncorp declared that homes and businesses in several central Queensland towns – notably Roma and Emerald – would not be offered insurance “unless clear decisions are made to build or implement improved mitigation to protect the residents of these towns.”
The move had the desired effect and so, once mitigation work began in Roma in September last year – 16 months after Suncorp pulled out – Milliner was there to announce the insurer would return to the town, but would be carefully reassessing risks until the levee was completed.
He suggested that premiums could fall by an average of 30%, and maybe by as much as 80%.
Broking through
While Australia’s insurance industry has been able to influence government policy and large-scale customer behaviour, through both lobbying and direct market actions, there is a well-defined role for individual insurance brokers in dealing with the consequences of adverse weather events.
“Brokers are in a unique position to educate their clients about dependencies they may have on suppliers to their business and the impact that could have to their business,” says Tony MacRae, Executive General Manager of Intermediary Distribution at QBE Australia.
That means explaining the value of business interruption insurance, particularly for small and medium-sized businesses, who quite often have greater dependencies upon their suppliers.
This increases the risk to their business in the event of a natural disaster.
MacRae also suggests advisers encourage their clients to develop a thorough contingency plan, including identifying alternative premises, alternative suppliers and alternative distribution channels.
There are also a range of other measures businesses of all sizes can take to protect themselves from increasingly volatile weather, such as ensuring buildings are designed to withstand the impacts of adverse weather, he added.
Insurance taxes are particularly regressive when one considers they are most keenly felt by those facing the largest risks, and therefore in most need of insurance.
In its latest report, the Intergovernmental Panel on Climate Change singles insurance out for a leadership role in preparing communities for climate change.
“Insurance can contribute positively to risk reduction by providing incentives to policy holders to reduce their risk profile,” the report states.
“Apart from constituting an autonomous private sector response to extreme events, insurance can also be framed as a form of social policy to manage climate risks, similar to New Zealand’s government insurance scheme; government measures to reduce or avoid risks also interact with insurance companies’ willingness to provide cover.
“Yet insurance can also act as a constraint on adaptation, if those living in climate-risk prone localities pay discounted or cross-subsidised premiums or policies fail to encourage betterment after damaging events by requiring replacement of ‘like for like’, constituting a missed opportunity for risk reduction.
“The effectiveness of insurance thus depends on the extent to which it is linked to a broader national resilience approach to disaster mitigation and response.”