Blog Archive

Showing posts with label PIOMAS. Show all posts

Thursday, April 11, 2013

Neven: PIOMAS April 2013 - extra update

by Neven Acropolis, Arctic Sea Ice Blog, April 12, 2013

The Polar Science Center has released some extra PIOMAS gridded data that allows smart bunnies like Wipneus and Chris Reynolds to show how ice thickness is distributed around the Arctic. Here's a thickness distribution map made by Wipneus that shows the difference between March 2012 and March this year:Thickness_chg_mar13
It seems the situation has basically flip-flopped, with thicker ice now off the Siberian coast and thinner ice in the Beaufort and Chukchi Seas. This is most probably due to those big highs that caused a very strong Beaufort Gyre that pulled at the ice pack so hard it cracked all over the Beaufort Sea and beyond, but at the same time made the ice compact against the Siberian coast. This thicker ice along the Siberian coast is at a relatively low latitude and is bound to melt away anyhow, although it will be interesting to see when the Northern Sea Route opens this year.
Last year I was expecting thicker ice in the Beaufort and Chukchi Seas to protect the centre of the ice pack as had happened in 2010 and 2011, but I was completely wrong on that. The ice just disappeared at a rapid pace - an amazing sight. If the above map is correct, we don't even have thick ice there now, and so I'm with Chris Reynolds when he says: "I expect an aggressive melt from the first week of June onwards, when the melt really starts within the Arctic Ocean."
Speaking of which: Chris has produced this thickness distribution map for March 2013, with next to that a table that shows the division between ice that is thinner than 2 metres and ice that is thicker than 2 metres since 1978:

March-nosedive
According to the PIOMAS model there's even less thick ice than in the previous two years, which makes sense, of course, after last year's record smasher. There's now more first-year ice than there has ever been since the record started. Some real weird weather is needed to prevent this coming melting season from becoming a serious pretender to the throne.
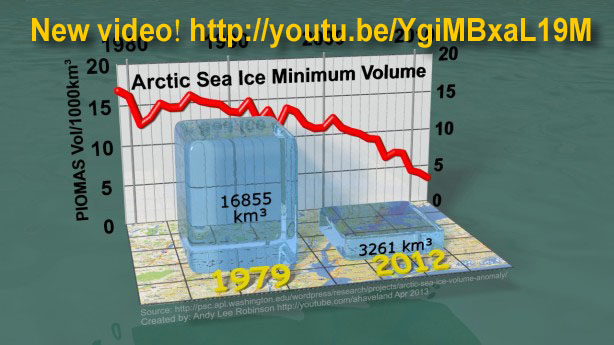
To top this update off I present to you Andy Lee Robinson's latest PIOMAS video:

Wednesday, April 3, 2013

NSIDC Arctic Sea Ice Report of April 2, 2013: Single-year ice takes over


Arctic sea ice has passed its annual maximum extent and is beginning its seasonal decline through the spring and summer. While total extent was not at record low, it remained well below average through March. Ice fracturing continued north of Alaska, and the Arctic Oscillation was in a strongly negative phase during the second half of the month, with unusually high sea level pressure over almost all of the Arctic Ocean. Levels of multiyear ice remain extremely low. The ice is thinner, and satellite data suggests that first-year ice may now cover the North Pole area for the first time since winter 2008.

Overview of conditions

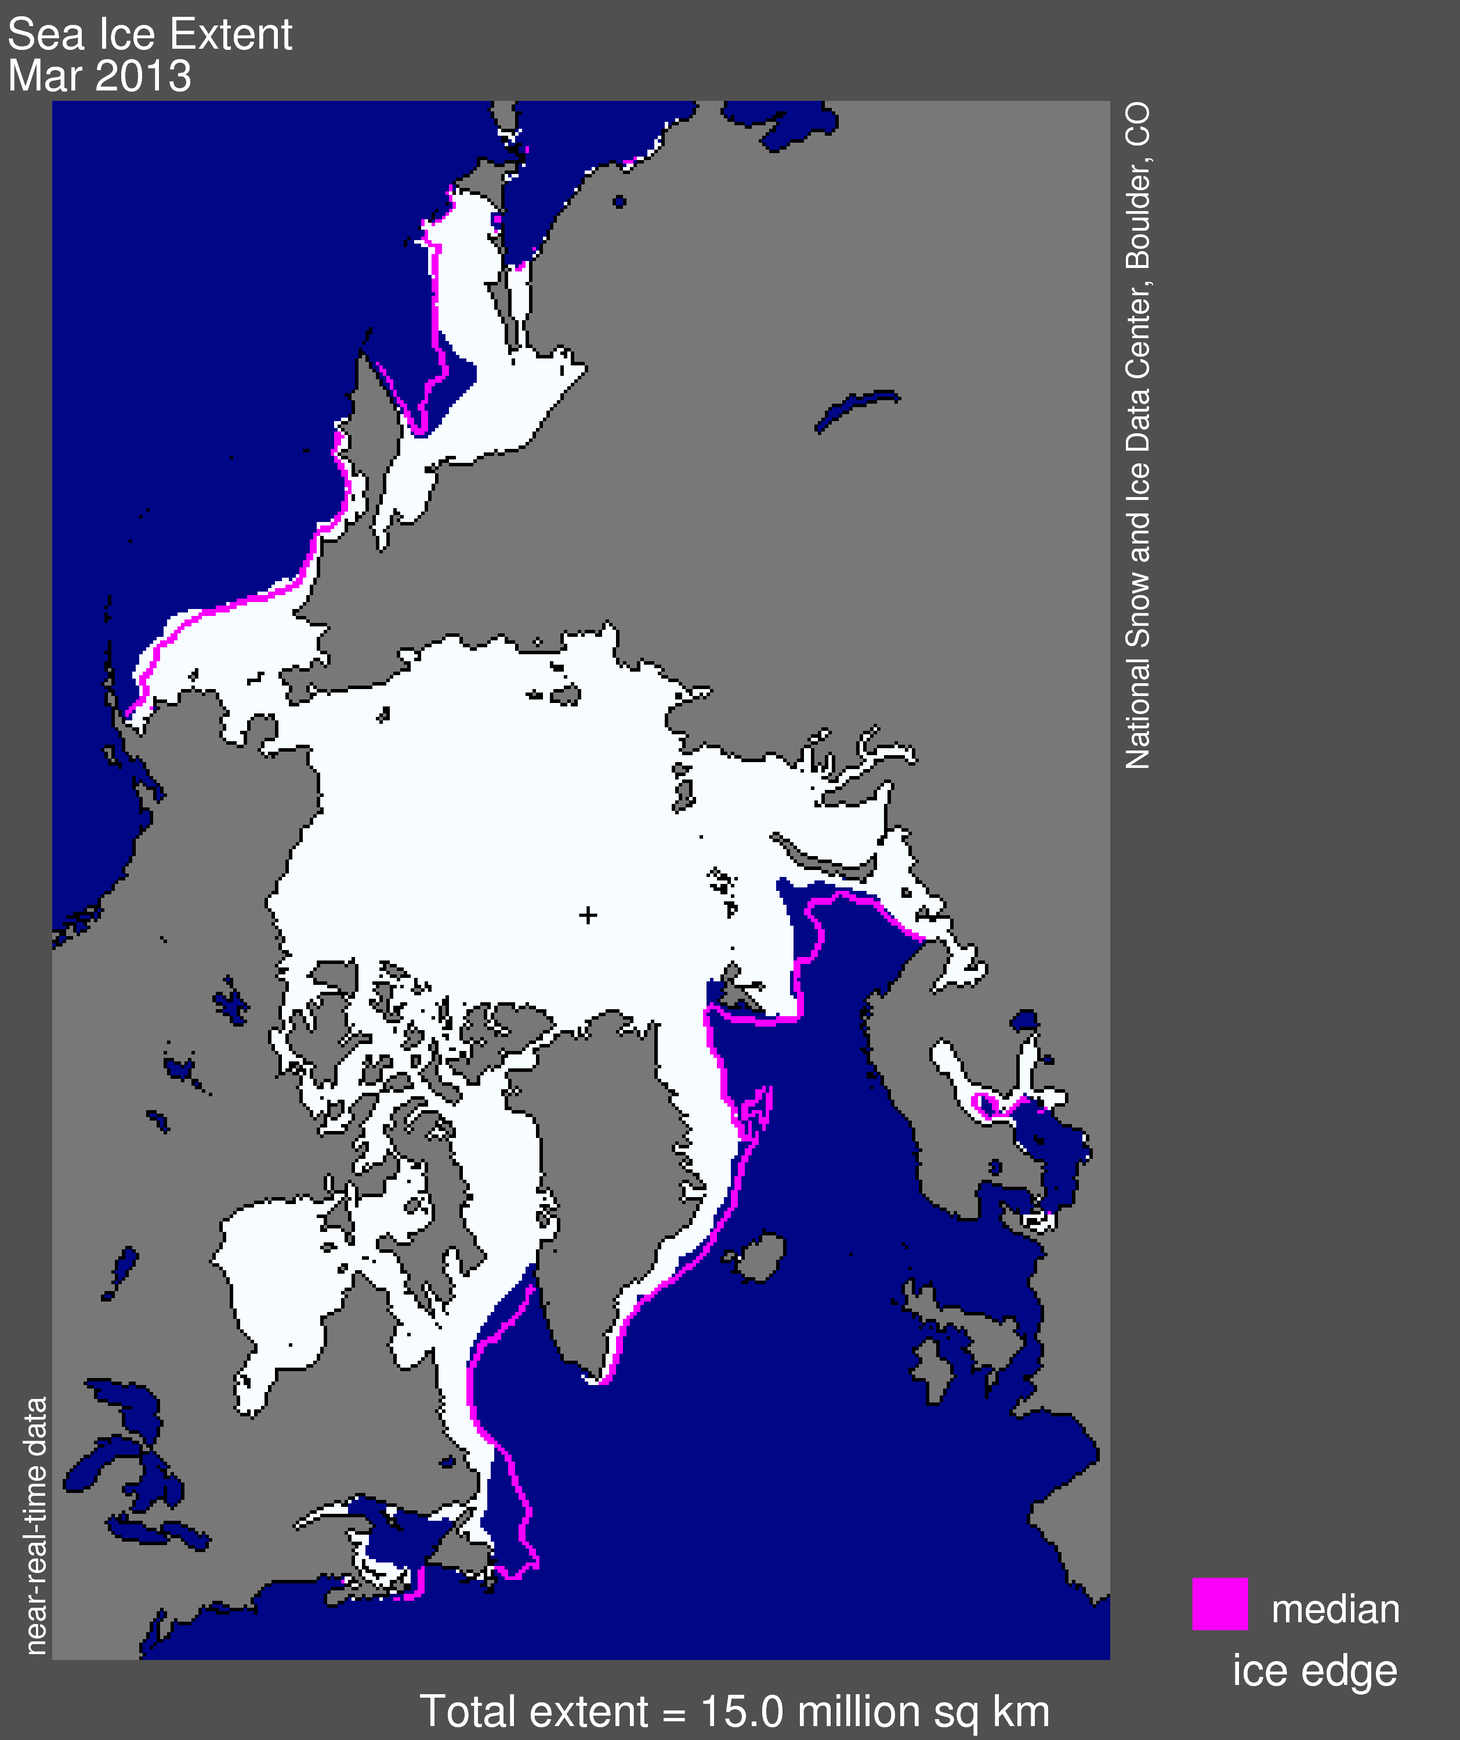
Figure 1. Arctic sea ice extent for March 2013 was 15.04 million square kilometers (5.81 million square miles). The magenta line shows the 1979 to 2000 median extent for that month. The black cross indicates the geographic North Pole. Sea Ice Index data. About the data. Credit: National Snow and Ice Data Center. High-resolution image
Arctic sea ice extent in March 2013 averaged 15.04 million square kilometers (5.81 million square miles). This is 710,000 kilometers (274,000 square miles) below the 1979 to 2000 average extent, and 610,000 square kilometers (236,000 square miles) above the record low for the month, which happened in 2006. Continuing a trend in recent winters, ice extent was near or below average levels throughout most of the Arctic, with the exception of higher extent in the Bering Sea.

Conditions in context

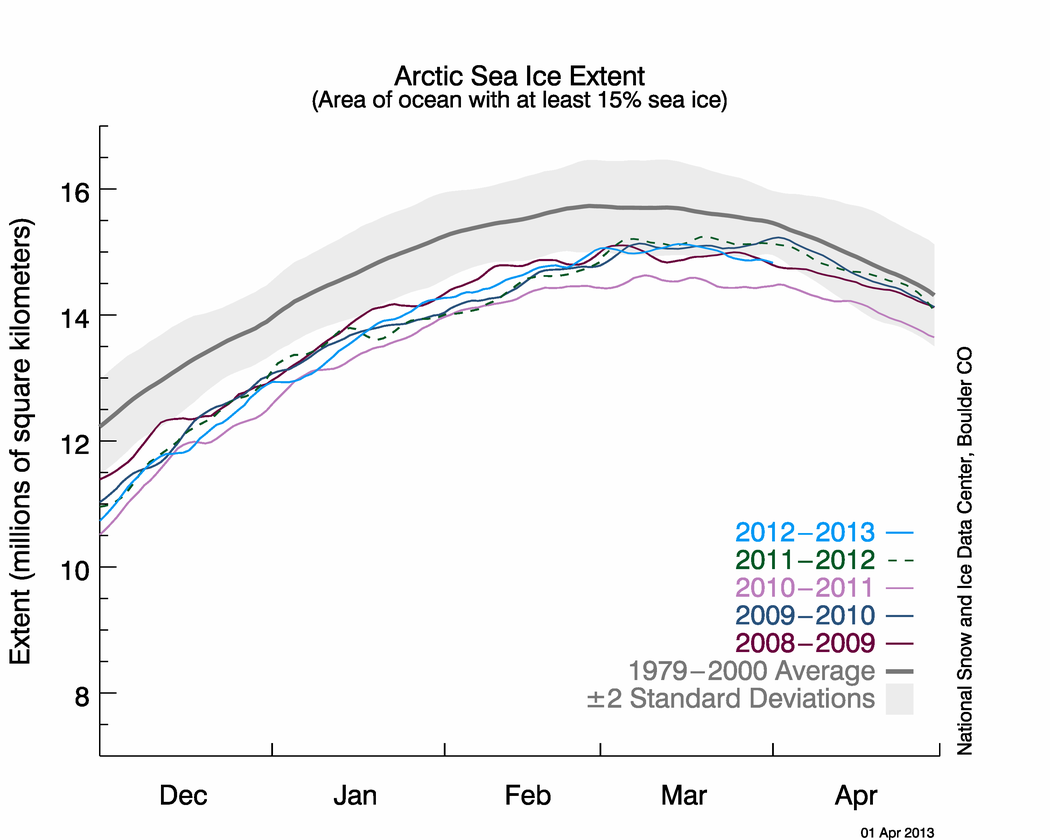
Figure 2. The graph above shows Arctic sea ice extent as of April 1, 2013, along with daily ice extent data for the previous five years. 2012-2013 is shown in blue, 2011-2012 in green, 2010-2011 in pink, 2009-2010 in navy, and 2008-2009 in purple. The 1979-2000 average is in dark gray. The gray area around this average line shows the two standard deviation range of the data. Sea Ice Index data.
Credit: National Snow and Ice Data Center
High-resolution image
As Arctic sea ice reaches its maximum extent in March, the net gain or loss through the month tends to be small. This year, extent decreased 5,400 square kilometers (2,100 square miles) between the beginning and end of the month, with the decline in the second half of the month slightly outweighing the increase over the first half. Air temperatures (at the 925 mb level, or about 3,000 feet) were 3-6 degrees Celsius (5-11 degrees Fahrenheit) higher than average over the central Arctic Ocean, with cooler conditions compared to average (3-6 C, or 5-11 F) over the Kara and Barents seas.
The circulation pattern known as the Arctic Oscillation (AO) reached an extreme negative phase in the second half of the month, associated with unusually high sea level pressure covering nearly the entire Arctic Ocean. The AO index, a measure of the state of the atmosphere over the Arctic, fell to as low as -5 sigma in mid March. This caps several months of a persistently negative AO. In the past, a negative AO in winter has been associated with the retention of thick ice in the Arctic Ocean and reduced export by drift into the Atlantic, favoring more extensive sea ice at the end of the summer melt season. However, in recent years, this relationship has not held and low summer extents have followed winters with strong negative AO. The month was also notable for continued fracturing of the ice cover in the Beaufort and Chukchi seas north of Alaska, as seen in a new animation by the NASA Earth Observatory. This is consistent with wind patterns associated with the strong negative pattern of the AO.

March 2013 compared to previous years

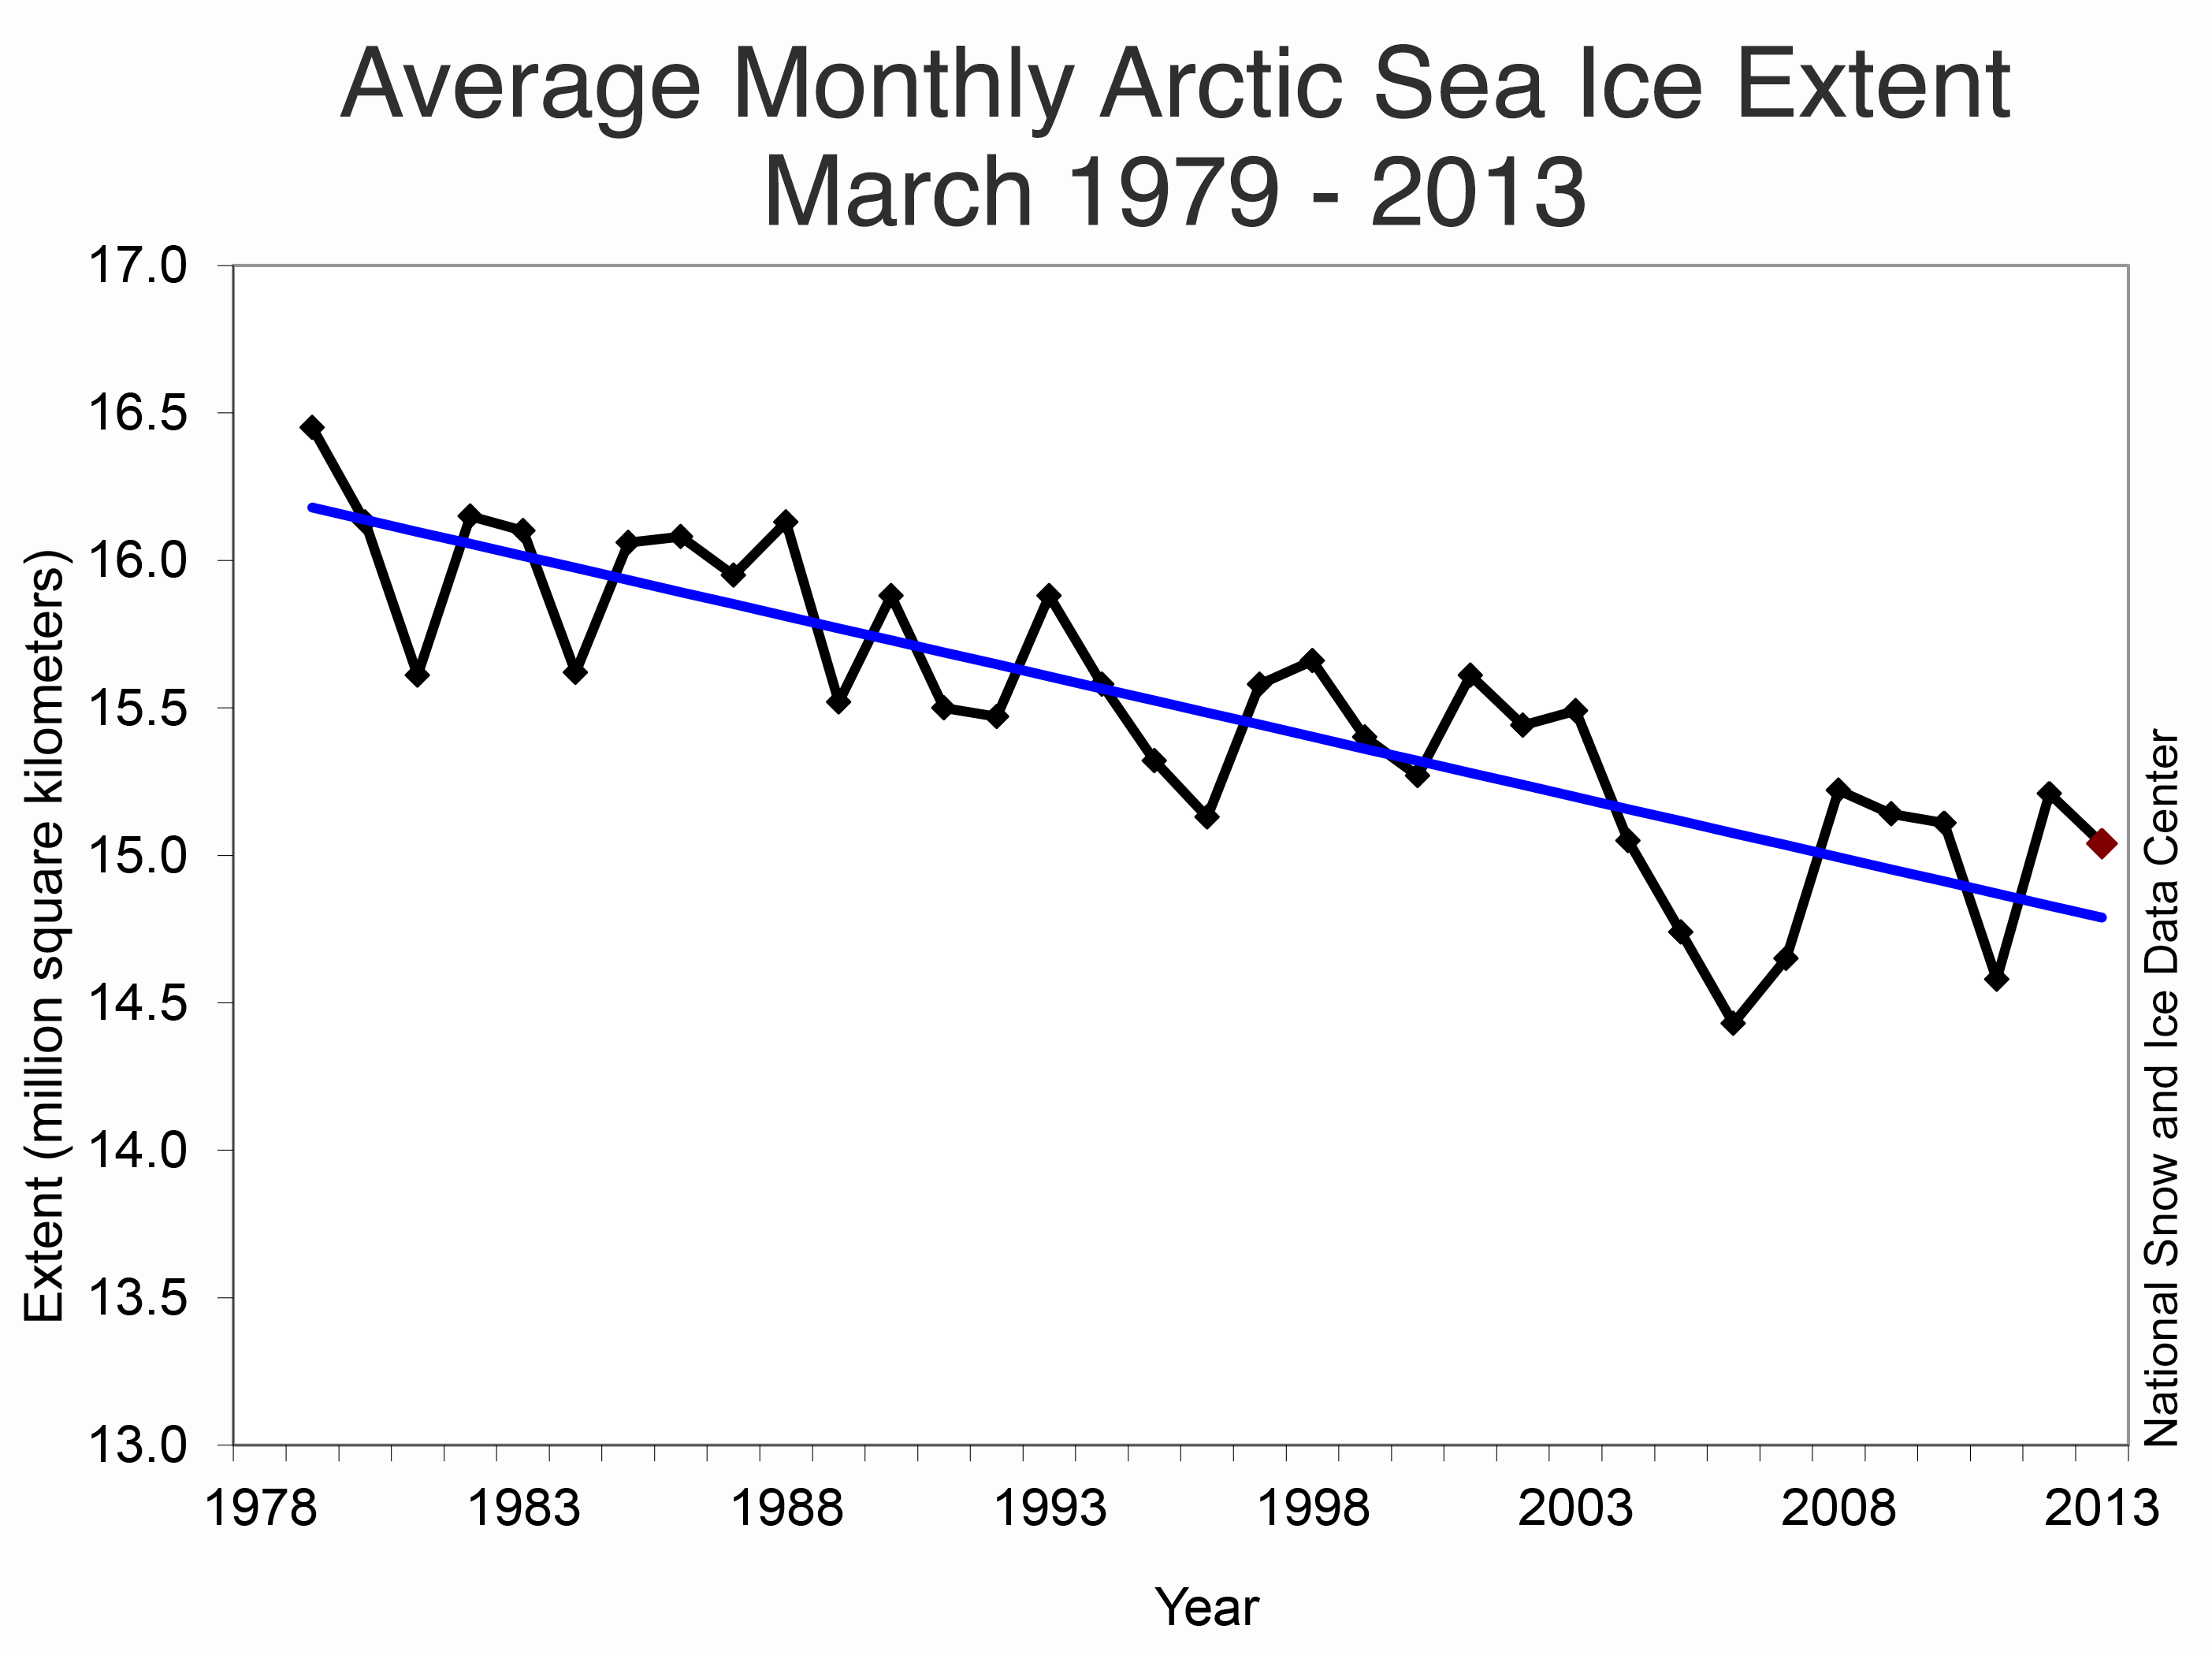
Figure 3. Monthly March ice extent for 1979-2013 shows a decline of 2.5% per decade. Credit: National Snow and Ice Data Center. High-resolution image
Average ice extent for March 2013 was the fifth lowest for the month in the satellite record. Through 2013, the linear rate of decline for March ice extent is 2.5% per decade relative to the 1979-2000 average. While the percentage trend is lower than in the summer, the average rate of decrease is 39,800 square kilometers (15,300 square miles) per year, roughly the size of Maryland and Delaware combined.

A record extent of first-year ice in the Arctic

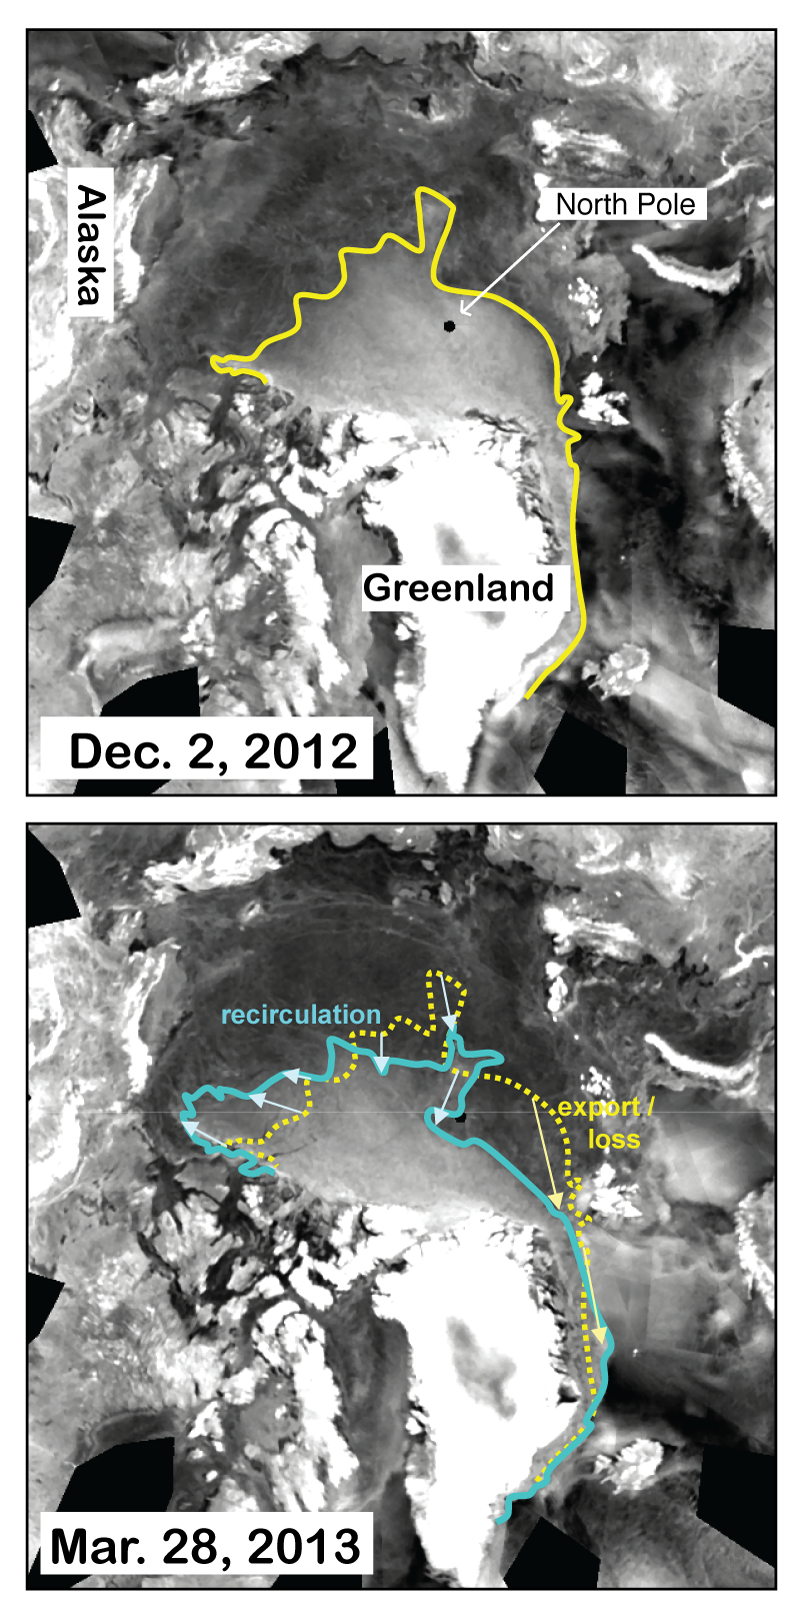
Figure 4. Imagery from the European Advanced Scatterometer (ASCAT) for December 2, 2012 (top) and March 28, 2013 (bottom) show the change in multiyear ice coverage over the winter season, as outlined by the colored lines. In winter, multiyear ice changes are due to the motion of the ice, either export through Fram Strait or redistribution within the Arctic Ocean.Credit: Advanced Scatterometer imagery courtesy NOAA NESDIS, analysis courtesy T. Wohlleben, Canadian Ice Service. High-resolution image
Between the 2012 summer minimum and the 2013 winter maximum, sea ice extent increased 11.72 million square kilometers (4.53 million square miles), the largest increase in the satellite record. This was primarily due to the extreme record low ice extent in September 2012, which resulted in a near-record high first-year ice extent. This is evident in imagery from the Advanced Scatterometer (ASCAT) sensor on the European METOP-A satellite provided by National Oceanic and Atmospheric Administration’s National Environmental Satellite, Data, and Information Service (NOAA NESDIS). Analysis by Trudy Wohlleben at Environment Canada indicates that multiyear ice is relegated to areas far from the Alaskan and Eurasian coasts. Over the winter, some multiyear ice recirculated into the Beaufort Sea where significant melt of multiyear ice has occurred in recent summers. Also, some multiyear ice has been lost, as it moved out of the Arctic through Fram Strait. The boundary between primarily first-year ice and multiyear ice is now near the North Pole (indicated by the small black circle near the center of the image), marking the first time since the winter of 2008 that a substantial amount of first-year ice may be covering the pole as we enter the melt season.

Oldest ice continues to decline

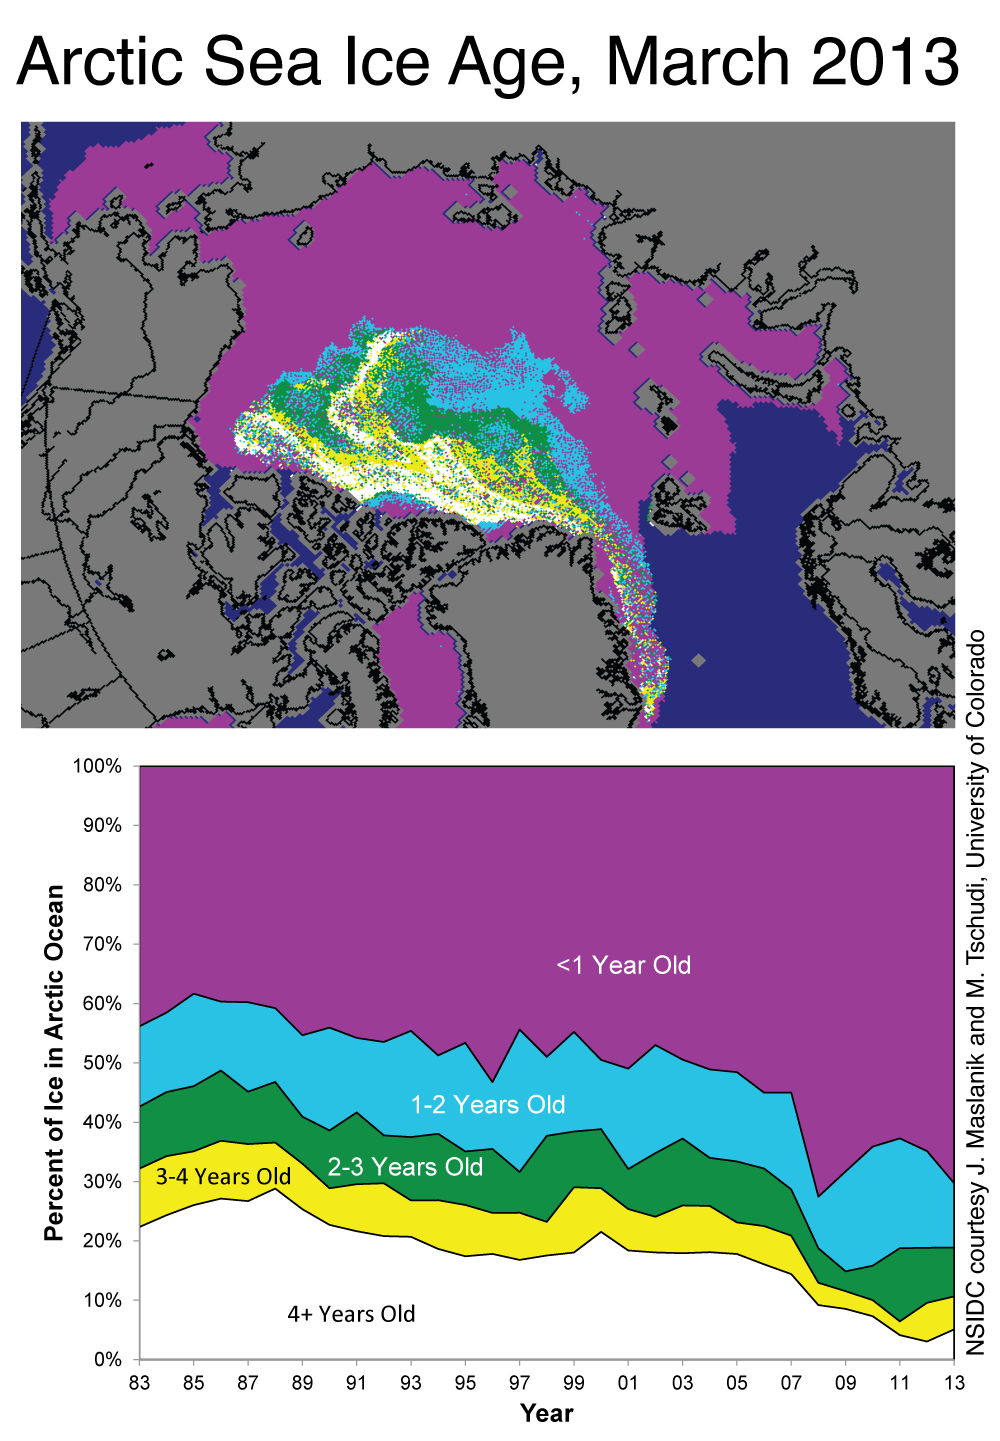
Figure 5. The map at top shows the ages of ice in the Arctic at the end of March 2013; the bottom graph shows how the percentage of ice in each age group has changed from 1983 to 2013.
Credit: NSIDC courtesy J. Maslanik and M. Tschudi, University of Colorado. High-resolution image
While multiyear ice used to cover up to 60% of the Arctic Ocean, it now covers only 30%. There is a slight rebound in the oldest ice (4+ years old), a remnant of the large amount of first-year ice that formed during the winter after the 2007 record minimum. However, most of that new ice has not survived through the subsequent years. The oldest ice now comprises only 5% of the ice in the Arctic Ocean. This is a slight uptick from last winter’s record low of 3%, but still far less than during the 1980s when old ice covered roughly 25% of the region.

 Satellite estimates show continued thinning

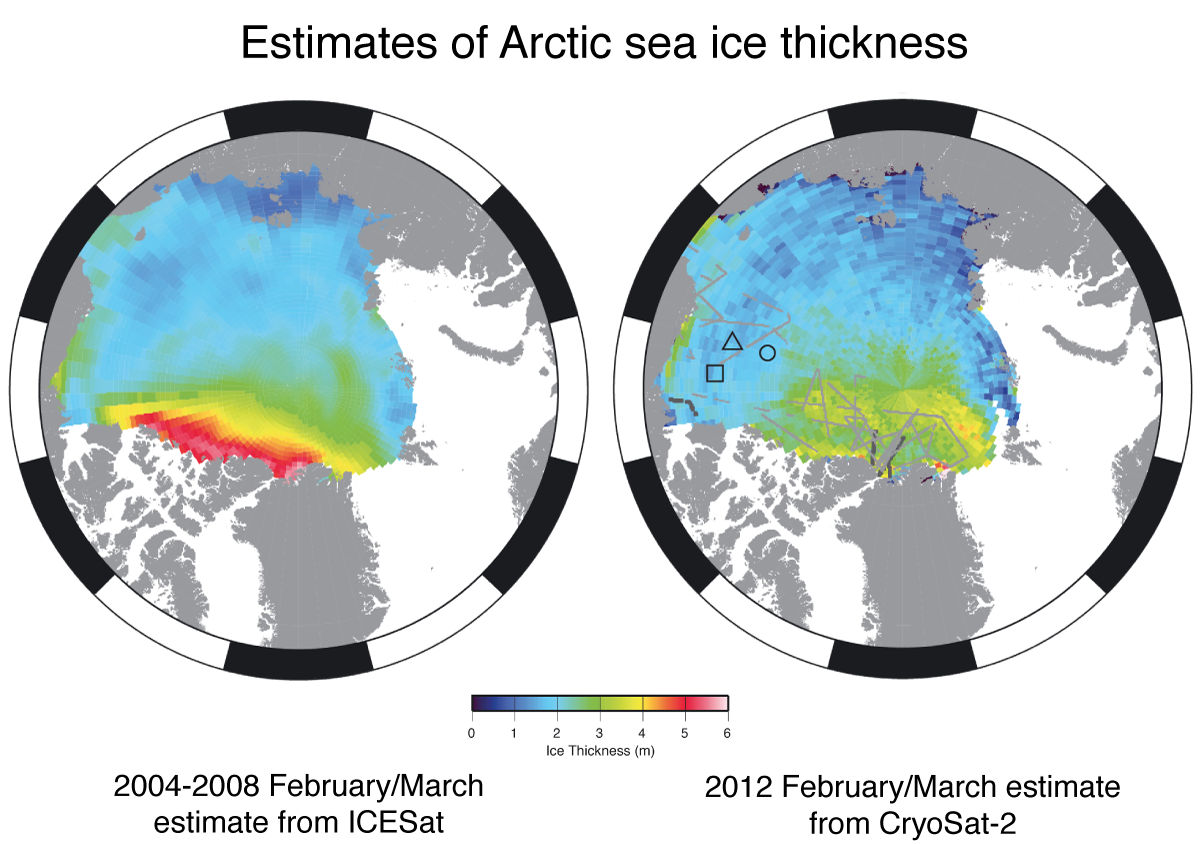
Figure 6. Estimates of February-March average sea ice thickness for 2004-2008 from NASA’s ICESat (left) and February-March 2012 from CryoSat-2 (right). Colors indicate ice thickness in meters, with blue indicating 1-meter thick sea ice and red indicating 5-meter thick sea ice. The black and gray lines in the CryoSat-2 image are tracks of airborne data collected for validation. The triangle, circle, and square are locations of upward-looking sonar (ULS) moorings, also used for validation of the CryoSat-2 estimates.
Credit: American Geophysical Union. High-resolution image
The ASCAT data and ice age data both suggest a continued thinning of the ice pack, and overall decline in its volume, but they do not provide direct information on ice thickness. However, the European Space Agency’s CryoSat-2 satellite, launched in April 2010, now provides estimates of sea ice thickness distribution across the Arctic Ocean. A new paper by Laxon et al. (2013) shows the first published results from CryoSat-2 and compares them with thickness estimates from NASA’s ICESat satellite, which operated from 2003 to 2009. The CryoSat-2 results indicate continued thinning since 2008. Significantly, ice along the north coast of Greenland appears to have thinned—in the past this has been the site of some of the thickest sea ice in the Arctic. The paper also shows that total volume estimates from CryoSat-2 agree well with University of Washington’s Pan-Arctic Ice Ocean Modeling and Assimilation System (PIOMAS)  estimates.

In memoriam

We dedicate this post to Seymour Laxon, who tragically passed away in early January. Laxon was a driving force behind the CryoSat-2 mission, a leading innovator in the development of sea ice altimetry, an outstanding scientist, and a great friend to the sea ice community, including the contributors to Arctic Sea Ice & News Analysis.

Further reading

Laxon S. W. K. A. GilesA. L. RidoutD. J. WinghamR. WillattR. CullenR. KwokA. SchweigerJ. ZhangC. HaasS. HendricksR. KrishfieldN. KurtzS. Farrell, and M. Davidson. 2013. CryoSat-2 estimates of Arctic sea ice thickness and volumeGeophysical Research Letters40, doi: 10.1002/grl.50193

Sunday, March 3, 2013

Angry Bear: Updates on atmospheric methane and volume measurements of Arctic sea ice


by Dan Crawford (Rdan), Angry Bear blog, February 18, 2013


Today we’d like to make note of an interesting development in the arctic     during January. Below we have 3 images of methane concentrations above the Arctic Ocean from 3 ten day periods in january (January 1-10, January 11-20, and January 21-31, 2013) from Russian physicist Dr. Leonid Yurganov. The methane concentration scale, with darker reds being the highest, can be viewed by clicking on the image to enlarge it.


Quite obviously, there's been a sudden increase in atmospheric methane in an area of the arctic ocean north of eastern Europe and western Asia. As shown in the post about this at Arctic News, that area where the methane concentrations are highest coincides with the area of the arctic ocean that is still relatively ice-free


This dramatic increase in atmospheric methane seems to be similar to an arctic event that we covered a little over a year ago that occurred in November 2011. At that time Russian scientists [Shakhova & Semiletov] had observed vast plumes of methane bubbling to the surface of the arctic ocean off the coast of eastern Siberia [and again, even more pervasive, in late 2012], which they described as "powerful and impressive seeping structures more than 1,000 metres in diameter."

Back then we figured that since that eastern Siberian area was one of the shallowest areas of the arctic, it had warmed enough during a period of unusual atmospheric circulation that fall to thaw the extensive amounts of frozen methane hydrates known to be locked up by high pressure and cold temperatures on the ocean floor, and they were melting and rising to the surface. In this case it appears that a branch of the warm gulf stream current is causing enough warming to destabilize the frozen methane on the ocean floor in the areas between Norway and Svalbard and points east. This is similar to a scenario that was warned about in a study in the journal Nature in October.

What happens next is anyone's guess, but Dr Yurganov's records indicate that higher levels of arctic methane emissions have been increasing over time. (US scientists must now rely on Canadian and European monitoring of greenhouse gas emissions because NOAA’s monitoring of Arctic methane and CO2 was halted last week by budget cuts.) We've pointed out before that atmospheric methane hit a new high of about 1,813 parts per billion (ppb) in 2011, which was at 259% of the pre-industrial level, and that 40% of the increase was coming from natural sources such as this


Methane is 25 times as potent a heat-trapping gas as CO2 over a 100-year time horizon, but 72 times as potent over 20 years, and methane's global heat trapping effect is now roughly one-third that of CO2. Further thoughts on the potential impact of large abrupt release of methane in the Arctic are here. Suffice it to say that if all the ancient carbon were to be released from the arctic it would be enough to raise global temperatures 3 C on top of the 4 C temperature rise from human activities predicted by the recent World Bank study

Our awareness of this comes the same week that the European Space Agency’s CryoSat-2 probe has confirmed the conclusion of the Pan-Arctic Ice Ocean Modeling and Assimilation System (PIOMAS) at the University of Washington’s Polar Science Center that not only is the extent of the Arctic ice receding, but its thickness has diminished considerably as well. The combined result has been a collapse in total arctic ice volume to one-fifth of what was the minimum ice volume as recently as 1980. With the associated warming in the Arctic, we can only expect the frequency and range of such Arctic methane releases to increase, from both the seabed and the permafrost.


4 comments
  1. AbyNormal Feb 19, 2013, 6:04:00 AM
    Methane is 25 times as potent a heat-trapping gas as CO2 over a 100 year time horizon, but 72 times as potent over 20 years...about 110 times as potent over 10 years too = STEALTH SPEED

    http://www.angrybearblog.com/2013/02/updates-on-atmospheric-methane-and.html

Thursday, February 14, 2013

Arctic sea ice death spiral confirmed by CryoSat-2; also confirms PIOMAS model results

Arctic Death Spiral Bombshell: CryoSat-2 Confirms Sea Ice Volume Has Collapsed

The sharp drop in Arctic sea ice area has been matched by a harder-to-see, but equally sharp, drop in sea ice thickness. The combined result has been a collapse in total sea ice volume — to one fifth of its level in 1980.
Arctic sea ice volume in 1,000s of cubic kilometers (via Robinson)
Back in September, Climate Progress reported that the European Space Agency’s CryoSat-2 probe appeared to support the key conclusion of the Pan-Arctic Ice Ocean Modeling and Assimilation System (PIOMAS) at the University of Washington’s Polar Science Center: Arctic sea ice volume has been collapsing much faster than sea ice area (or extent) because the ice has been getting thinner and thinner.
Now the Natural Environment Research Council (NERC), the UK’s primary agency for funding and managing environmental sciences research, has made it official. In a Wednesday press release, they report:
Arctic sea ice volume has declined by 36% in the autumn and 9% in the winter between 2003 and 2012, a UK-led team of scientists has discovered….
The findings confirm the continuing decline in Arctic sea-ice volume simulated by the Pan-Arctic Ice-Ocean Modelling & Assimilation System (PIOMAS), which estimates the volume of Arctic sea ice and had been checked using earlier submarine, mooring, and satellite observations until 2008.
This should be the story of the day, week, month, year, and decade. As NERC notes, sea ice volume is “a much more accurate indicator of the changes taking place in the Arctic.”
Many experts now say that if recent volume trends continue we will see a “near ice-free Arctic in summer” within a decade. And that may well usher in a permanent change toward extreme, prolonged weather events “Such As Drought, Flooding, Cold Spells And Heat Waves.
It will also accelerate global warming in the region, which in turn will likely accelerate both the disintegration of the Greenland ice sheet and the release of the vast amounts of carbon currently locked in the permafrost.
The findings were published online in Geophysical Research Letters (subs. req’d). In a U. of Washington news release, polar scientist and coauthor Axel Schweiger said:
Other people had argued that 75-80% ice volume loss was too aggressive. What this new paper shows is that our ice loss estimates may have been too conservative, and that the recent decline is possibly more rapid.”
Creative tech guru and programming analyst Andy Lee Robinson has made a video of the PIOMAS data
Here is the rest of the NERC press release:
… Researchers used new data from the European Space Agency’s CryoSat-2 satellite spanning 2010 to 2012, and data from NASA’s ICESat satellite from 2003 to 2008 to estimate the volume of sea ice in the Arctic.
They found that from 2003 to 2008, autumn volumes of ice averaged 11,900 km3. But from 2010 to 2012, the average volume had dropped to 7,600 km3  a decline of 4,300 km3. The average ice volume in the winter from 2003 to 2008 was 16,300 km3, dropping to 14,800 km3 between 2010 and 2012 – a difference of 1,500 km3.
“The data reveals that thick sea ice has disappeared from a region to the north of Greenland, the Canadian Archipelago, and to the northeast of Svalbard,” says Dr Katharine Giles, a NERC-funded research fellow at the Centre for Polar Observation & Modelling (CPOM) at UCL (University College London), who co-authored the report, published online in Geophysical Research Letters….
Other satellites have already shown drops in the area covered by Arctic sea ice as the climate has warmed. Indeed, sea-ice extent reached a record minimum in September 2012. But CryoSat-2, launched in April 2010, differs in that it lets scientists estimate the volume of sea ice — a much more accurate indicator of the changes taking place in the Arctic.
“While two years of CryoSat-2 data aren’t indicative of a long-term change, the lower ice thickness and volume in February and March 2012, compared with same period in 2011, may have contributed to the record minimum ice extent during the 2012 autumn,” says Professor Christian Haas of York University, Canada Research Chair for Arctic Sea Ice Geophysics, co-author of the study and coordinator of the international CryoSat sea ice validation activities.
CryoSat-2 measures ice volume using a high-resolution synthetic aperture radar altimeter, which fires pulses of microwave energy down towards the ice. The energy bounces off both the top of sections of ice and the water in the cracks in between. The difference in height between these two surfaces let scientists calculate the volume of the ice cover.
The findings are the result of a huge international collaboration between teams from UCL, the European Space Agency, the Jet Propulsion Laboratory, the University of Washington, York University, Alfred Wegener Institute for Polar & Marine Research, Woods Hole Oceanographic Institution, Morgan State University and the University of Maryland.
The team confirmed CryoSat-2 estimates of ice volume using measurements from three independent sources – aircraft, moorings, and NASA’s Operation IceBridge.
If you were wondering whether “death spiral” was the right visual metaphor for the collapse of Arctic ice, Robinson has a graphic for you:

It is almost certainly too late to save the Arctic’s summer sea ice from near-total destruction. Let’s hope the same isn’t true for the biosphere. The time to act is now if we don’t want to betray our children and future generations.
Related Posts:

Monday, September 17, 2012

UK MET Office keeps downplaying significance of events in the Arctic

by Sam Carana, Arctic News blog, September 17, 2012 One of the most respected datasets on Arctic sea ice volume is produced by the Pan-Arctic Ice Ocean Modeling and Assimilation System (PIOMAS, Zhang & Rothrock, 2003) developed at the Polar Science Center, Applied Physics Laboratory, University of Washington. The graph below shows PIOMAS data for annual minimum Arctic sea ice volume (black dots) with an exponential trend added (in red).


The Arctic Methane Emergency Group (AMEG), in a February 12, 2012, written submission to the U.K. Environmental Audit Committee, pointed at the graph:
 . . summer volume [is] less than 30% of its value 20 years ago. The trend in volume is such that if one extrapolates the observed rate forward in time, by following an exponential trend line, one obtains a September near-disappearance of the ice by 2015.

The MET Office, in a March 8, 2012, written submission:
Climate models project the Arctic will become ice-free during summer at some point this century – though likely not before 2040. . . In September 2007, sea ice extent reached an all-time low, raising the question of whether the sea ice is likely to melt more quickly than has been projected. There is, however, no evidence to support claims that this represents an exponential acceleration in the decline. Indeed, modelling evidence suggests that Arctic sea ice loss would be broadly reversible if the underlying warming were reversed.

Professor Slingo, Chief Scientist, MET Office, elaborated on this in a March 14, 2012, oral submission:
Q114 Chair: . . when the Arctic will be ice free in summer. . .
Professor Slingo: . . Our own model would say between 2040 and 2060 . .

Q115 Chair: You would rule out an icefree summer by as early as 2015, for example?
Professor Slingo: Yes we would . . .

Q117 Chair: . . In terms of the modelling that you are using, does that cover . . . volume of ice?
Professor Slingo: We run quite a sophisticated sea ice model. . . and we are looking forward now to the new measurements from CryoSat-2.

Q118 Chair: . . evidence that we had suggested that the volume of ice had already declined by 75%, and that further decreases may cause an immediate collapse of ice cover.
Professor Slingo: I wouldn’t [give credence to that]. We don’t know what the thickness of ice is across the whole Arctic with any confidence. . . I probably would [rule it out altogether] . . . to say we have lost 75% of the volume is inconsistent with our assessments.

Professor Laxon, director of Centre for Polar Observation and Modelling, where CryoSat-2 data is being analysed, in an August 24, 2012, written submission:
. . [analysis of] CryoSat-2 and ICESat data . . suggest a decrease in ice volume over the period 2003–12 at least as large as that simulated by PIOMAS, and possibly higher.

The Met Office, in an August 31, 2012, supplementary written submission:
The changes in observed sea-ice volume only extends [sic] over a few years and cannot in isolation be interpreted as representative of a long term trend. . . . The extrapolation of short-term trends in ice volume is not a reliable way to predict when the Arctic will be seasonally ice free as negative feedbacks and changing weather patterns may slow the rate of ice loss. . . it is worth noting that climate models can show a period of recovery in ice volume following periods of large ice volume loss.

For some curious reason, some people seek to downplay the significance of the events taking place in the Arctic, as well as the risk of methane releases. Here's more on that.

AMEG added, in its above February 12, 2012 written submission:
The catastrophic risk of global warming leading to very large emissions of methane from large Arctic carbon pools, especially from subsea methane hydrate, is documented in the 2007 IPCC assessment.

By collaborating with others to protect the Arctic, a climate of cooperation can be engendered to protect the whole planet for the benefit of ourselves and future generations.

Professor Lenton, in a Feb 21, 2012, oral submission:
. . the Hadley Centre [has] permafrost in the latest state-of-the-art model . . . their best estimate is we may get 0.1°C of extra warming at the end of the century from the loss of methane from the northern high latitudes.

Professor Slingo, in the above March 14, 2012, oral submission:
Q126 Dr Whitehead:. . what sort of modelling factors may be accounted for by the possibility of tipping points or feedback attached to these? For example, the argument that follows very substantially from the extent of continental shelf that there is within the Arctic Basin and, therefore, the particular relationship that warming on that relatively shallow sea has on trapped methane-for example, the emergence of methane plumes in that continental shelf, apparently in quite an anomalous way-leading possibly to the idea that there may be either tipping points there or catastrophic feedback mechanisms there, which could then have other effects on things, such as more stabilised caps like the Greenland ice cap and so on. I rapidly collated all the possible catastrophe theories, but I mean how are those factored into the modelling process?

Professor Slingo: . . we are not looking at catastrophic releases of methane. . . We don’t see catastrophic change in the Arctic that would lead to catastrophic releases of methane, or very large changes in the thermohaline circulation, within the next century. Our understanding of the various feedbacks-and it is a very complex system-both through observations and modelling, suggests that we won’t see those catastrophic changes, in terms of the physical system.

Note that the above are excerpts, to make things easier to read. For the full text, click in the respective links.

Below an update of the image, produced earlier this month, with recent volume data for 2012 added. Note that the value for 2012 may still have a substantial way to go down further before reaching its 2012 minimum.
The image below shows Arctic sea ice extent (total area of at least 15% ice concentration) for the last 7 years, compared to the average 1972-2011, as calculated by the Polar View team at the University of Bremen, Germany.


Below are written submissions to date to the Protecting the Arctic inquiry of the U.K.Environmental Audit Committee. Highlighted in yellow are submissions that are particularly relevant to points brought up by the Arctic Methane Emergency Group (AMEG), with links to videos and oral evidence added where available. 
http://arctic-news.blogspot.com/2012/09/uk-met-office-keeps-downplaying-significance-of-events-in-the-arctic.html