Blog Archive

Showing posts with label Zwally Effect. Show all posts

Wednesday, September 9, 2015

Jason Box: Earth's Ice Is Melting Much Faster Than Forecast. Here's Why That's Worrying

GREENLAND GLACIER

by Jason Box, Professor of Glaciology, Geological Survey of Denmark and Greenland, Huffington Post, September 4, 2015

COPENHAGEN -- For me it was only after 8 years of studying Greenland -- installing and maintaining a network of on-ice climate stations and examining how much snow evaporates from the island -- that I suddenly realized glaciology textbooks needed a major revision. This was in 2002. Prior to the epiphany, conventional knowledge held that the ice sheet was frozen at its bed, and so the reaction time of the ice sheet to climate warming was measured in tens of thousands of years. A heck of a long time.
Climate warming had just infiltrated Greenland glaciology in earnest. Summer melt water, it turned out, drains down quickly to the bed, lubricating the glacier's flow. Suddenly we realized an expanding melt season meant the ice sheet would be sliding faster, longer. It was not to be the only time our philosophy got hit with a major surprise that connected the ice sheet with climate change and the threat of abrupt sea level rise.
The next one came in 2006.
Somehow all marine-terminating glaciers across the southern half of Greenland doubled in speed simultaneously between 2000 and 2005. [Readers, this news is what caused me to begin this blog -- I had the one and only epiphany in my life when I read about this.] We didn't yet know why.
In the meantime, scientists tried defining a plausible upper limit for the contribution to sea level rise from Greenland's ice. That was at a time when surging glacier speeds -- ice flow -- was thought to be the dominant conveyer of ice loss, and would be for the foreseeable future. Well, surprise! It became clear that for six years in a row, starting in 2007, ice loss from surface meltwater runoff took over the lead position in the competition for biggest loser.  [This was something I thought privately at the time -- that this must occur eventually, but I did not imagine that it would occur so soon. I never bought into the idea that the topography was a limit on glacial outflow and thus would restrain Greenland's contribution to sea level rise.] From 2007 to 2012, nearly each summer set higher and higher melt records, owing to persistent and unforeseen weather that by 2012 would become a signature of climate change.
The competition between how much ice is lost through glacier flows into fjords versus meltwater runoff is intimately synergistic with meltwater interacting with ice flow all along the way. Increasing melt sends more water down through the ice sheet, softening the ice so it flows faster. Once at the bed the water lubricates flow. Squirting out the front of glaciers into the sea, the meltwater drives a heat exchange that undercuts glaciers, promoting calving, loss of flow resistance and faster flow. Put it this way: in Washington, DC, to know what's happening, you follow the money; in Greenland you follow the meltwater.
Put it this way: in Washington, DC, to know what's happening, you follow the money; in Greenland you follow the meltwater.
Glaciologists became oceanographers when they realized, in 2008, the trigger effect for galloping glaciers was warm pulses of subtropical waters that undermine glaciers at great depth in the sea, at the grounding lines where this warm water can invade.
Indeed, ocean warming is arguably the climate change story. The planetary energy imbalance due to the enhanced greenhouse effect is loading far more heat into the oceans than the atmosphere or land. The world is 70% ocean-covered. after all. While there were signs of a warming hiatus in air temperatures from 1998 to 2012, the ocean continued to heat up, an equivalent of four Hiroshima bombs, per second, all day, every day. The increase is continuing as we load the atmosphere with CO2.
The fundamental climate heating issue is a problem of too much of a good thing. The natural greenhouse effect -- a good thing -- keeps temperatures tolerable at night. But it has been enhanced by more than a century of people externalizing the environmental costs of stupendous economic growth, loading the atmosphere now with 42% more carbon dioxide, 240% more methane, 20% more nitrous oxide, 42% more tropospheric ozone, etc. We have far too much gaseous carbon compounds now in our atmosphere, people. The carbon pollution is, by the way, making our oceans too acidic, threatening the base of the marine food chain. Would someone step forward and deny the changing ocean chemistry? Do I digress?
We have far too much gaseous carbon compounds now in our atmosphere, people.
The key question, as I see it, is how to project what the sea level will soon be due to ice sheet melting. But this is confounded by us not really knowing what to expect. We keep being surprised by nature being more sensitive and complex. As the science develops, we see more interconnection, where multiplying feedbacks produce surprisingly fast responses.
Will there be some saving self-regulation of human-induced climate warming and its melting land ice consequences? The enormous increase of heat in our oceans, from past decades of enhanced greenhouse effect, negates any hope that negative feedbacks or even solar output will prevent a much warmer world. The few negative feedbacks we have found for ice -- like more snow as a result of a warming climate, more reflective frost, more efficient sub-glacial water transmission -- are clearly being outdone. And at the global scale, despite some negative feedbacks like more clouds, clearly we are not seeing net cooling. Feedbacks, whether positive or negative, only do their thing after the initial effect. Negative feedbacks don't reverse the perturbation.
Seemingly the biggest issue with abrupt sea level rise comes from the now-unstoppable loss of key sectors of West Antarctic ice and the discovery of more marine instability than we thought elsewhere. Like glaciers thinning rapidly in East Antarctica. Or in Greenland, where improved bedrock maps reveal a marine connection an average of 40 kilometers further inland than previously thought. Or like how new fjord underwater mapping reveals greater fjord depths, increasing the odds that deep warm ocean water can communicate with more Greenland glaciers than previously thought. Surprise, surprise, surprise.
I'd say we are in for more surprises.
If the past decade of scientific inquiry is any indication, I'd say we are in for more surprises. That notion is further supported by the fact that the climate models used for projecting future temperatures lack key processes that likely reinforce warming or the effects of warming, not regulate it.
Despite decades of progress by many clever scientists engaged with climate modeling, climate models used to inform policymakers don't yet encode key pieces of physics that have ice melting so fast. They don't incorporate thermal collapse -- ice softening due to increasing meltwater infiltration.
Climate models also don't yet incorporate increasing forced ocean convection at the ocean fronts of glaciers that forces a heat exchange between warming water and ice at the grounding lines.
Climate models don't yet include ice algae growth that darkens the bare ice surface.
Climate models don't yet prescribe background dark bare ice from outcropping dust on Greenland from the dusty last ice age.
Climate models don't include increasing wildfire delivering more light-trapping dark particles to bright snow-covered areas, yielding earlier melt onset and more intense summer melting.
As a result of some of these factors and probably some as yet unknown others, climate models have under-predicted the loss rate of snow on land by a factor of four and the loss of sea ice by a factor of two.
Climate models also don't yet sufficiently resolve extended periods of lazy north-south extended jet streams that produce the kind of sunny summers over Greenland (2007-2012 and 2015) that resulted in melting that our models didn't foresee happening until 2100.
While individual climate models come close to observations on this or that piece of the complex big picture, what ends up in global assessment reports intended to help guide policy decisions and national discussions of climate change are very conservative averages of dozens of models that don't include the latest, higher sensitivity physics.
So, alas, when it comes to ice, how fast it can go and how fast the sea will rise, if I were a betting man, I'd put my money on it going faster than forecast.

Wednesday, April 27, 2011

"Recession of Jakobshavn Isbrae continues July 2010" by Mauri Pelto, "From A Glacier's Perspective" blog

June 28, 2009
by Mauri Pelto, "From A Glacier's Perspective" blog, June 28, 2009 (with updates from 2010 and 2011)
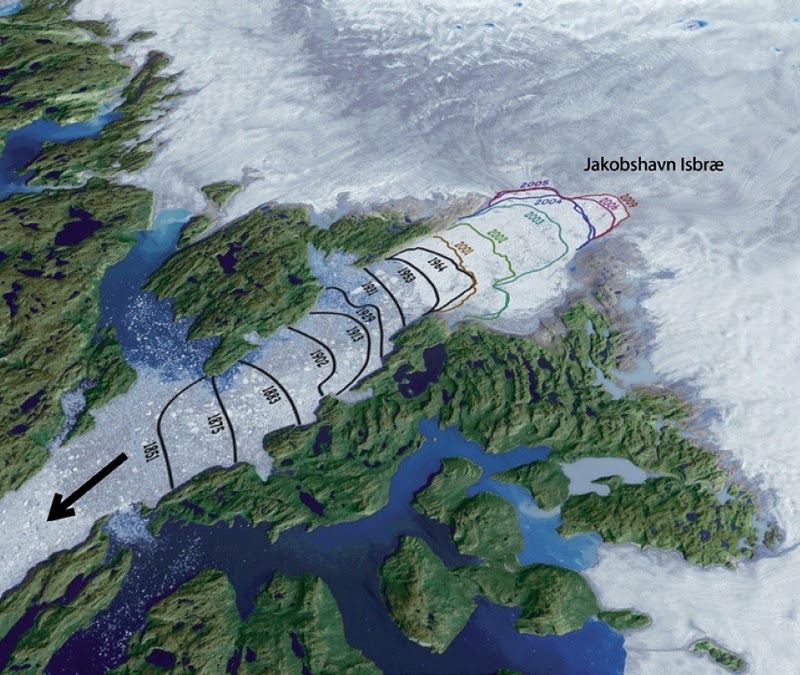
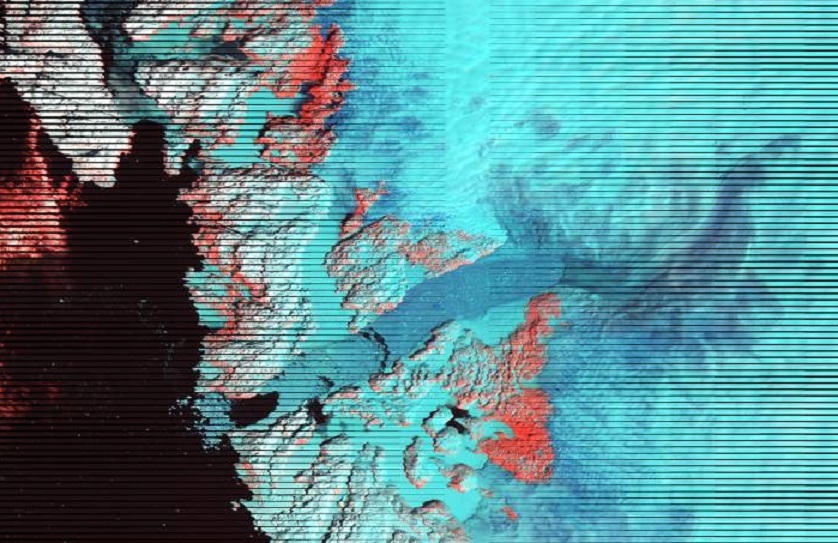
The Jakobshavn Isbrae (glacier) has captured our attention over the last 30 years because it has the highest long-term average velocity of any glacier in the world. At the ice front, the velocity has remained above 16 meters per day for all measurements completed over the last 50 years. The ability of this glacier (which is 10 km wide at its front and 800 m thick at the calving front) to drain 6.5% of the Greenland Ice Sheet is its importance. This prompted the University of Maine’s Terry Hughes to take a close look at the glacier in 1985. I participated in that project, and one key conclusion we reached was that the Jakobshavn Isbrae was in approximate equilibrium (Pelto and others, 1989). The terminus had not shifted significantly in the prior 30 years and no thinning was evident either. The image below of terminus change The top image above is from Jason Box, Byrd Polar Research Center, Ohio State University, and is a mosaic of Landsat and ASTER images indicates a substantial retreat from 1850-1964 of about 30 km. The second image is from the fall of 2009 and the third is a Modis image from June 2010. The fourth from July 2010 is from NASA. Notes on this latest image below the sequence.

From 1964 to 2001, the glacier terminus did not recede significantly and observations of terminus velocity remained relatively constant at 16-20 m year at the glacier front. Then, in 1997, an acceleration began. The velocity reached 34 m per day by 2003, twice its normal speed, the glacier thinned by up to 15 m year and retreated 10 km, from 2001 to 2003. From 2004-2007, an additional retreat of 5 km occurred.
.
jakobshavns
A bedrock high beneath the glacier is reflected by the sudden increase in slope below point A. What is fascinating is the speed at which the glacier surface below A at Point C was transformed from an ordinary set of transverse crevasses to the chaotic scene typically indicative of an area of rapid acceleration and failure of seracs, those walls between crevasses. The glacier had a profound response to the rifting-calving retreat of the previous day. The area of crevasse transformation is an indication of the connection of this area of the glacier to action at the terminus, the crevassed areas response was so swift that it was effectively involved in the calving retreat incident. The area around C is a zone of weakness to watch for further appearance of rifting. The area in front of the bedrock high is clearly not a place for the terminus to stabilize. The bedrock high itself could well be a point of greater stability for the terminus. Upglacier, 2010 was not a good year for the glacier either -- the snowline is high for June, exposing larger areas of bare glacier ice with higher albedo for melting, see image at bottom.
On Jakobshavn, the acceleration began at the calving front and spread up-glacier 20 km in 1997 and up to 55 km inland by 2003 (Joughin et al., 2004)Luckman et al. (2006) observed, “The most plausible sequence of events is that the thinning eventually reached a threshold, ungrounded the glacier tongues and subsequently allowed acceleration, retreat and further thinning. It is reasonable to believe that the 1998 Jakobshavn speed-up, also following a long period of stability, was triggered by the same processes of thinning but occurred earlier and after a shorter period of thinning because the tongue was already afloat.”
On Jakobshavn, the acceleration was not restricted to the summer, persisting through the winter when surface meltwater is absent. This indicates that it is the change in conditions at the calving front where the backforce on the glacier was reduced that allowed acceleration and retreat. This is typical for Greenland marine-terminating outlet glaciers: they have accelerated most at the calving front, and the acceleration is not seasonal. The acceleration is not significantly due to meltwater-enhanced lubrication. Below is the acceleration of the last decade compared to before, illustrating that the greatest acceleration is at the calving front (Thomas et al., 2009).


The Jakobshavn is of particular importance as it has a bed below sea level for at least 80 km inland from the terminus. In this reach, there are no significant pinning points, or abrupt changes in slope or width (Clarke & Echelmeyer, 1996), that would help stabilize the glacier during retreat. In particular, the bed becomes deeper from 24-40 km behind the calving front, which should reinforce calving acceleration (Thomas et al., 2009).


Images of Jakobshavn Isbrae in 2001 indicate substantial rifts on the north side of the glacier near the 2005 terminus position, suggesting the glacier had been preconditioned for retreat. In the image below from June 17, 2010, the snowline is evident on the north side of Jakobshavn as the transition to the much lighter blue tone, in this Landsat image. The red line is the June 2009 snowline, and the green line is the 2008 June snowline.


A comparison of the April 2010 (top image below) and the April 2011 Landsat image (middle image) indicates a somewhat lower snowline on the Jakobshavn in 2011. The zoomed-in version indicates the amount of the ice that is actually icebergs.


Friday, April 8, 2011

H. Jay Zwally et al., J. Glaciol., 57 (March 2011), Greenland ice sheet mass balance: distribution of increased mass loss with climate warming: 2003-2007 versus 1992-2002


H. Jay Zwally, L. I. Jun, Anita C. Brenner, Matthew Beckley, Helen G. Cornejo, John Dimarzio, Mario B. Giovinetto, Thomas A. Neumann, John Robbins, Jack L. Saba, Y. I. Donghui and Weili Wang 
Abstract

We derive mass changes of the Greenland ice sheet (GIS) for 2003-2007 from ICESat laser altimetry and compare them with results for 1992-2002 from ERS radar and airborne laser altimetry. The GIS continued to grow inland and thin at the margins during 2003-2007, but surface melting and accelerated flow significantly increased the marginal thinning compared with the 1990s. The net balance changed from a small loss of 7 ± 3 Gt a-1 in the 1990s to 171 ± 4 Gt a-1 for 2003-2007, contributing 0.5 mm a-1 to recent global sea-level rise. We divide the derived mass changes into two components: (1) from changes in melting and ice dynamics and (2) from changes in precipitation and accumulation rate. We use our firn compaction model to calculate the elevation changes driven by changes in both temperature and accumulation rate and to calculate the appropriate density to convert the accumulation-driven changes to mass changes. Increased losses from melting and ice dynamics (17-206 Gt a-1) are over seven times larger than increased gains from precipitation (10-35 Gt a-1) during a warming period of ∼2 K (10 a)-1 over the GIS. Above 2,000 m elevation, the rate of gain decreased from 44 to 28 Gt a-1, while below 2,000 m the rate of loss increased from 51 to 198 Gt a-1. Enhanced thinning below the equilibrium line on outlet glaciers indicates that increased melting has a significant impact on outlet glaciers, as well as accelerating ice flow. Increased thinning at higher elevations appears to be induced by dynamic coupling to thinning at the margins on decadal timescales.

Thursday, December 16, 2010

Greenland Ice Sheet outlet glaciers' ice loss: an overview (Mauri Pelto and Daniel Bailey, Skeptical Science)

Greenland Ice Sheet outlet glaciers' ice loss: an overview

The vast majority of this blog post was contributed by glaciologist Mauri Pelto.  Examples of his work can be found at From A Glaciers Perspective and at RealClimate.
posted by Daniel Bailey, Skeptical Science, December 16, 2010
The mass loss from Greenland's ice sheet has been well documented over the years.  In recent years, the rate of loss has accelerated.


Figure 1. Greenland ice mass anomaly (black). Orange line is quadratic fit (John Wahr).

To understand the causes of the acceleration we must examine how they vary in time and from glacier to glacier.  It also must be recognized that the same processes will not have the same level of impact on each glacier.  The two key mechanisms are the Zwally Effect and the Jakobshavn effect.  Let's take a closer look at those.

The Zwally Effect 

This mechanism relies on meltwater reaching the glacier base via moulins and reducing the friction at the base of the glacier. This mechanism has been examined in detail and has yielded short-term accelerations in the 10-20% range (Zwally et al., 2002Das et al., 2008), but is of little significance to the annual flow of the large glaciers' outlet glaciers.  A recent paper by Schoof et al. (2010) further examines this issue. They conclude that rapid changes in the basal water pressure that is key:  long periods of sustained melt may lead to reductions in basal water pressure as the channels that drain the meltwater at the glacier base mature. 
A mature channel system would successfully remove the meltwater, instead of having the meltwater fill the channels and spread out as a lubricant over more of the glacier bed.  This is not a new concept, having been observed on Ryder Glacier during a surge after a lake outburst in 1995.  This mechanism has been observed in Iceland and Bering Glacier in Alaska as well. 
The mechanism does have limitations, however.  First of all it would be short lived, as it is only at times of rapid change in the amount of available meltwater that acceleration would occur.  The examinations of increased speeds from glacial lakes in Greenland to the base fit the pattern noted.  It is not a continuous summer-long acceleration necessarily; it is often a short-term, rapid, flow increase that is also localized.  Thus, this mechanism falls within the domain of the observed meltwater-driven accelerations.  For this to be the star player, we need a glacier area where flow is slow enough for channels to develop and where basal water pressure is often limited. 
This is not the case on the rapid-flowing, marine-terminating, outlet glaciers.  The mechanism of a meltwater impulse driving short-term acceleration would then be most important in regions where flow is slower and basal meltwater production not persistent.  Joughin and others (2008) observed that seasonal drainage of meltwater to the glacier bed induces a uniform acceleration of 50–150 meters/year over a ~300-km-long section of the West Greenland margin that is not drained by outlet glaciers, causing a large fractional acceleration of the interior ice sheet but a small fractional change in the speed of fast-moving outlet glaciers.  This suggests that over the process of glacier acceleration due to changes in meltwater flux tend to not lead to localized accelerations that generate a different overall velocity.

The Jakobshavn Effect

We are still left with the main cause of glacier acceleration in Greenland resulting from  dynamic thinning of the terminus zone of the marine-terminating outlet glacier reducing the effective bed pressure, allowing acceleration – the Jakobshavn effect. The reduced resistive force at the calving front due to the thinner ice, now experiencing greater flotation, is then propagated “upglacier” (Hughes, 1986; Thomas, 20032004). This type of acceleration has a limited seasonal signal and propagates upglacier from the terminus. 
Howat and others (2008) examined changes in terminus position, surface elevation and flow on 32 glaciers along the southeast coast of Greenland from 2000 to 2006. They affirmed that speedup results from loss of resistive stress at the front during retreat. Many retreats began with an increase in thinning rates near the front in the summer of 2003, a year of record high coastal-air and sea-surface temperatures.
This indicates again the importance of preconditioned thinning via melting.  The mass balance at the calving front is the sum of the ice flux from upglacier, the rate of melting above and below the waterline, and the iceberg calving rate. Mass balance transfer to the calving front is a slow process with a large lag time (centuries) and is not capable of playing a meaningful role in the recent relatively large and sudden glacier accelerations (Pfeffer, 2007).
Surface ablation and basal ice ablation are determined by the climatic and oceanographic conditions at/near the glacier front. Increased ablation even in a single summer will cause thinning near the ice front.  This will reduce the effective pressure at the glacier bed, reducing friction and encouraging acceleration.  Acceleration at the calving front will then effectively pull on the ice upstream, stretching it, causing further thinning and acceleration.  This is how the marine-terminating outlet glaciers can respond rapidly to climate conditions.  Howat and others (2008), in observing the seasonal flow rates of 32 outlet glaciers, concluded that the presence of a seasonal oscillation in speed was ambiguous. On average, the glaciers show a difference in summer (faster) and winter (slower) speeds on the order of 10%.

How is does this play out on various glaciers?

Petermann Glacier is a much different glacier than the large, fast-flowing, marine-terminating glaciers above. Its extensive ice tongue, the largest in the Northern Hemisphere, makes it particularly susceptible to basal melt processes, due to the area and duration of exposure of the glacier base.  Its velocity of 2-3 m/day is much lower than 10-30 m/day observed on the other marine-terminating outlet glaciers.
Petermann is located on the northwest corner of Greenland and certainly experiences less melting and less snowfall. The lower 80 km (in length) and 1300 km2 (in area) of the glacier is afloat. This makes it (by area) the largest floating glacier in the Northern Hemisphere. The ice front is not impressive, unlike the faster outlet glaciers. The calving front protrudes a mere 5-10 m above sea level, reflecting the fact that the ice at the front is only 60-70 m thick.
Further upglacier, the ice at the grounding line is 600-700 m thick. The combination of velocity and thickness yield the volume of material calved each year. Petermann Glacier calves 0.6 km3 (Higgins, 1990), whereas Jakobshavn yields close to 40 km3. The thinning between the grounding line and the calving front is mainly via melting, as the snowline is at 900 m. The low slope leads to very low velocities, giving the low-lying floating section plenty of time to melt, and surface melt ponds are common.  The glacier flow in the long terminus section is not susceptible to basal water pressure changes.
Left panel denotes ice velocities; the right panel shows changes in velocities
 
Figure 2. The panel on the left shows ice velocity; the right, changes in velocity.  Areas in black are sea ice and open water.
 
Humboldt Glacier is much different, as the lack of confining topography prevents the development of the strong ice-stream flow we see on Jakobshavn Glacier or the weaker ice-stream flow of Petermann Glacier and its subsequent long floating tongue.  This glacier could then be more susceptible to changes in meltwater flux.

Figure 3. Humboldt Glacier profile.
 
Ryder Glacier is much different: Howat and others (2008) note that Ryder Glacier, North Greenland, accelerated by 300% over a 7-week period following drainage of a supraglacial lake in 1995.  This indicates the ability of an unusually large, sudden discharge of water to increase basal water pressure dramatically and enhance basal sliding.  This glacier is in the north of Greenland and has an order of magnitude less melt than Jakobshavn and would be more susceptible to such sudden meltwater pulses.

Figure 4. Horizontal velocity field of the Ryder Glacier. Contour interval is 20 m/yr (cyan) for velocity less than 200 m/yr and is 100 m/yr (blue) for values greater than 200 m/yr. Red arrows indicate flow direction and have length proportional to speed.
With the warming of the globe (land + ocean) continuing apace, the mass loss of Greenland’s outlet glaciers is not only expected to continue, but their acceleration is expected to increase as well.  Current events surrounding increased oceanic heat around ice sheet margins in Antarctica are expected to play a dynamical role in marine-terminating, glacial ice loss acceleration there as well.  Stay tuned...