Blog Archive

Showing posts with label Jeff Masters. Show all posts

Wednesday, October 24, 2018

Jeff Masters: Extreme 'Grey Swan' Hurricanes in Tampa Bay: a Potential Future Catastrophe

Extreme 'Grey Swan' Hurricanes in Tampa Bay: a Potential Future Catastrophe

A “black swan” hurricane — a storm so extreme and wholly unprecedented that no one could have expected it — hit the Lesser Antilles Islands in October 1780. Deservedly called The Great Hurricane of 1780, no Atlantic hurricane in history has matched its death toll of 22,000. So intense were the winds of the Great Hurricane that it peeled the bark off of trees – something only EF5 tornadoes with winds in excess of 200 mph have been known to do. However, hurricanes even more extreme than the Great Hurricane of 1780 can occur in a warming climate, and can be anticipated by combining physical knowledge with historical data. Such storms, which have never occurred in the historical record, can be referred to as “grey swan” hurricanes, according to research published in Nature Climate Change in 2015 by Kerry Emanuel of MIT and Ning Lin of Princeton University (press release here). Using a detailed hurricane model embedded within six different global climate models, the scientists showed that the risk of extreme “grey swan” hurricanes for three specific locations  Tampa, Florida; Cairns, Australia; and the Persian Gulf  may increase by up to a factor of 14 by the end of the century, thanks to our changing climate. We'll focus in this post on the results for Tampa. 


Figure 1. Damage to Tampa’s Bayshore Boulevard after the 1921 Tampa Bay hurricane. 


Figure 2. Track of the Tampa Bay Hurricane of 1921, one of only two major hurricanes ever recorded to hit the city. This Category 3 storm with 115 mph winds brought a storm tide of 10.0
11.5 feet (3.03.5 meters) to Tampa Bay. 

Tampa’s hurricane history: only two major hurricanes since 1848

Tampa Bay doesn't get hit very often by hurricanes. This is because the city faces the ocean to the west, and the prevailing east-to-west trade winds at that latitude make it uncommon for a storm to make a direct hit on the west coast of Florida from the ocean. This is fortunate, since the large expanse of shallow continental shelf waters offshore from Tampa Bay (less than 300 feet deep out to 90 miles offshore) is conducive for allowing large storm surges to build. In a worst-case scenario, with a powerful hurricane traveling north-northwestwards at just the right speed parallel to the coast, the geometry of the coast creates a unique additional rise in the water level due to a phenomenon known as a coastally trapped Kelvin wave. 


Figure 3. Two possible tracks of the Great Gale of 1848, the most violent hurricane in Tampa's history, a Category 3 or 4 hurricane with 115
135 mph winds. A 15-foot storm surge (4.6 meters) was observed in what is now downtown Tampa.

The last time Tampa suffered a direct hit by any hurricane was 1946, when a Category 1 storm came up through the bay. The Tampa Bay Hurricane of October 25, 1921, was the last major hurricane to make landfall in the Tampa Bay Region. This low-end Category 3 storm with 115 mph winds at landfall brought a storm tide of 10.0
11.5 feet (3.03.5 meters), causing severe damage ($10 million in 1921 dollars). The only other major hurricane to hit the city occurred on September 25, 1848, when the Great Gale of 1848, the most violent hurricane in Tampa's history, roared ashore as a Category 3 or 4 hurricane with 115135 mph winds. A 15-foot storm surge (4.6 meters) was observed in what is now downtown Tampa, and the peninsula where St. Petersburg lies, in Pinellas County, was inundated, making St. Petersburg an island. A large portion of what few human structures were then in the area were destroyed.


Figure 3. Predicted height above ground of the water from a worst-case Category 4 hurricane in the Tampa Bay region, as computed using NOAA's SLOSH storm surge model. Downtown Tampa Bay would be inundated by more than 20 feet of water, and St. Petersburg would become an island, as occurred during the 1848 hurricane. Image taken from our storm surge inundation maps.

Tampa fury: global warming may make grey swan hurricanes up to 14 times more likely

The risk of grey swan hurricanes increased in the models used in the study due to an increase in both the frequency and intensity of hurricanes in the future climate. While an increase in the frequency of hurricanes due to global warming is something many models run by other hurricane scientists do not show happening, there is widespread agreement among hurricane scientists that the strongest storms should get stronger, and a number of studies have shown that Cat 4/5 storms already make up an increasing proportion of tropical cyclones, at least in some basins (though the quality of our observations adds considerable uncertainty to this finding). Stronger storms are to be expected, because hurricanes are heat engines that extract heat energy from the oceans and convert it to wind energy, and any increase in ocean heat energy due to global warming can be expected to increase the maximum potential intensity a hurricane can reach. An additional factor not considered: potential intensity theory suggests that hurricanes will increase in size; storms that have a larger diameter push up a larger and more damaging storm surge since strong winds are blowing over a larger ocean area. Also, the study did not consider the impact of sea level rise, which will steadily increase storm surge damage in the coming decades. A 2007 study by Tufts University, 
Florida, and Climate Change, found that a 2.25-foot increase in sea level 
 which many sea level rise scientists expect will happen by the end of the century  would put 152,000 people in Pinellas County (where St. Petersburg is located) under water at high tide. 

A ferocious upper-end Category 3 or stronger hurricane, capable of delivering a storm surge of 20 feet (6 meters) or higher, had about a 1-in-10,000 year recurrence interval in the historical climate of 1980–2005, the scientists estimated. In other words, such a storm had a 0.01 percent chance of occurring in any given year, or a 0.3% chance when summed up over a 30-year period. However, in a business-as-usual global warming scenario, the six climate models showed that such a storm might become between four and fourteen times more likely by the end of the century—a 1-in-2,500 to 1-in-700 year event. Summed up over a 30-year time period, a 1-in-700 year event has a 4% chance of occurrence—something disaster planners should definitely think about. 

Tampa's "Category 6" hurricane: a mind-boggling 830 mb storm with 233 mph winds
The researchers found that extreme Category 5 hurricanes capable of delivering a storm surge of 26
36 feet (811 meters) to Tampa had an extremely low or negligible probabilities in the climate of the late 20th Century, but are projected to happen as 1-in-5,000 to 1-in-150,000-year events in the late twenty-first century. We might need to invent a "Category 6" designation for the 1-in-150,000 year storm that came up in their simulations – a run of the HADGEM climate model that showed an unimaginably intense hurricane with a central pressure of 830 mb, top sustained winds of 233 mph, traveling parallel to the coast along just the right track to generate a titanic 36-foot storm surge. Even accounting for the 15% reduction in winds that would occur due to friction over land, the winds from such a “Category 6” hurricane would be like those of the EF5 tornado that leveled Joplin Missour  except that EF4 to EF5 damage would be along a swath 22 miles wide, instead of a few hundred yards wide! A July 2016 paper by Columbia University hurricane scientist Adam Sobel and colleagues in Science, "Human influence on tropical cyclone intensity," stated that we should expect to see about a 2.2 mph (1 m/s) per decade increase in the winds of the strongest hurricanes, or about 19 mph by the year 2100. If we assume the 215 mph sustained winds of 2015’s Hurricane Patricia (off the Pacific coast of Mexico) as the current maximum potential intensity that a hurricane can reach, a 235 mph hurricane by the end of the century is definitely a possibility.

Other estimates of Tampa Bay's hurricane risk
Extreme "grey swan" hurricanes are difficult to model, since they are such rare and extreme events. Thus, we should consider all the estimates of the potential return periods of such storms as highly uncertain.

In 2010, the Tampa Bay Regional Planning Council put out the Tampa Bay Catastrophic Plan, a scenario where a Category 5 "Hurricane Phoenix" hits downtown Tampa with 160 mph winds and a 26-foot storm surge. The study projected that the city would see about 2,000 deaths and nearly $250 billion dollars in damage. 

Dr. Peter Sousounis, a meteorologist for risk-modeling company AIR Worldwide, told me in an email that their maximum loss
causing event for Tampa Bay is a Category 5 storm with sustained winds of 220 mph that hits Manatee County with a central pressure of 887 mb. This nightmare storm generates $220 billion in insured losses in a four-county region (Manatee, Pinellas, Pasco, and Hillsborough counties)  a level of loss for those counties that has a 1-in-10,000 year recurrence interval. Since uninsured losses from a hurricane strike are usually roughly as much as the insured losses, the total damage from this storm might top $400 billion dollars.

An August 2015 report by Karen Clark & Company, "Most Vulnerable US Cities to Storm Surge Flooding," cited Tampa/St. Petersburg as the most vulnerable metropolitan area in the U.S. to storm surge damage. Their 1-in-100 year storm 
 a strong Category 4 hurricane with 150 mph winds  could be expected to cause $175 billion in damage just from the storm surge.

Two mass evacuations in Tampa in the past 35 years
Two hurricanes have prompted mass evacuations of more than 300,000 people from the Tampa Bay area over the past 35 years. The first was Hurricane Elena of 1985, a Category 3 hurricane that stalled 80 miles offshore for two days on Labor Day weekend, bringing a 6
7 foot storm surge, wind gusts of 80 mph, and torrential rains. On August 13, 2004, another mass evacuation was ordered for Hurricane Charley. Thanks to a late track shift, Charley missed Tampa Bay, and instead hit well to the south in Port Charlotte as a Category 4 storm with 150 mph winds. More limited evacuations of low-lying areas and mobile homes in the 4-county Tampa Bay region were ordered for three other hurricanes in the past twenty years  Hurricane Georges of 1998, Hurricane Frances of 2004, and Hurricane Jeanne of 2004. 


Figure 4. A sensible hurricane awareness effort: Hillsborough County, Florida got a $30,000 grant to post 30 of these signs around the Tampa Bay area to show how high a storm surge from a major hurricane might reach. This sign by a McDonalds at 19th Ave and Highway 41 is thirteen feet above ground level. Image credit: photonews247.com.

Tampa Bay's vulnerability to hurricanes

When the 1921 hurricane hit Tampa Bay, there were 160,000 residents in the 4-county region, most of whom lived in communities on high ground. Today there are 2.8 million residents in the region, and that number is growing by about 50,000 people per year. Most of the population in the 4-county Tampa Bay region lives along the coast in low-lying areas; about 50% of the population lives at an elevation less than 10 feet. Over 800,000 people live in evacuation zones for a Category 1 hurricane, and 2 million people live in evacuation zones for a Category 5 hurricane, according to 
the 2010 Statewide Regional Evacuation Study for the Tampa Bay Region. Given that only 46% of the people in the evacuation zones for a Category 1 hurricane evacuated when an evacuation order was given when 2004's Category 4 Hurricane Charley threatened the region, the potential exists for hundreds or even thousands of people to die when the next major hurricane hits. 

References
Barnes, J., 1999, Florida’s Hurricane History. The University of North Carolina Press.

Weisberg, R.H, and L. Zheng, 2006, "Hurricane storm surge simulations for Tampa Bay," Estuaries and Coasts Vol 29, No. 6A, pp 899-913.

History of Pasco County: The 1921 Hurricane

A July 2016 paper in ScienceHuman influence on tropical cyclone intensity.

The 2010 Statewide Regional Evacuation Study for the Tampa Bay Region.

The Tampa Bay Catastrophic Plan for a Category 5 $250 billion hurricane.

My August 14, 2012, post, The odds of a hurricane spoiling the Republican National Convention in Tampa.

My February 2016 post, Hurricane Patricia's 215 mph Winds: A Warning Shot Across Our Bow.

My 2013 post, Hurricanes and Climate Change: Huge Dangers, Huge Unknowns.

Latest 2016 disaster planning info from the Tampa Bay Regional Planning Council.

Climate Central's interactive Risk Zone Map for sea level rise in the Tampa Bay area.


Video 1. A newscast I hope I never see the likes of: a frightening look at the potential effects of a catastrophic Category 5 hurricane making a direct landfall on the Tampa Bay metro area, as envisioned by the 2010 Tampa Bay Catastrophic Plan Hurricane Phoenix scenario. 

https://www.wunderground.com/blog/JeffMasters/extreme-grey-swan-hurricanes-in-tampa-bay-a-potential-future-catast.html

Wednesday, March 29, 2017

Jeff Masters: Trump’s Executive Order Threatens to Wreck Earth as a Livable Planet for Humans

by Dr. Jeff Masters, wunderground, March 29, 2017

Decades of progress on cleaning up our dirty air took a significant hit on Tuesday, along with hopes for a livable future climate, when President Trump issued his Energy Independence Executive Order. Most seriously, the order attacks the U.S. Environmental Protection Agency’s (EPA’s) Clean Power Plan, which requires a 32% reduction in CO2 emissions from existing power plants by 2030 (compared to 2005 emission rates). 

Tuesday’s blow was just the latest in a series of attacks that threaten our health and the planet’s health. On March 15, Trump also ordered the EPA to review tough air pollution rules for cars and light trucks that were set to kick in between 2022 and 2025. Trump’s proposed budget for fiscal year 2018, released earlier this month, slashed funding for the EPA by 31%, and eliminated money for renewable energy programs and energy efficiency efforts such as the Energy Star program. 

Trump’s war on clean air will potentially kill tens of thousands of people annually and have health costs in the ten of billions of dollars each year. Separate studies done in 2016 by the World Bank and by the Health Effects Institute (a U.S. non-profit corporation funded by the EPA and the auto industry) estimated that air pollution kills between 91,000 and 100,000 Americans each year—nearly double the number of U.S. combat deaths (58,000) in Vietnam, or over 30 times the death toll of the 9/11 terror attacks. The EPA estimated that tough air pollution regulations under the Clean Air Act that began in 1990 saved over 164,000 lives in the year 2010 alone. 

Damages from U.S. air pollution are extreme. The World Bank study estimated that, in the year 2013 alone, the U.S. suffered $473 billion in health-related damages from air pollution
about 2.9% of the GDP. Health care consumes one-quarter of the $3.7 trillion federal budget, and air pollution is a significant contributor to that bill.
 

Figure 1. Polling in 2016 by the Yale Program on Climate Change Communication revealed widespread support among Americans for the key provision of the EPA’s Clean Power Plan: setting strict CO2 limits on existing coal-fired power plants. Such limits were supported by 69% of Americans, including majorities in all 50 states and all 435 Congressional Districts; 75% of Americans supported regulating CO2 as a pollutant. Image credit: Yale Climate Opinion Maps.

Power plants are the single largest source of greenhouse gas emissions in the U.S.—about 31% of the total, and are also a significant source of deadly air pollution—about 26% of all air pollution deaths in the U.S. according to a 2013 MIT study. The authority for the Clean Power Plan comes from the EPA’s Clean Air Act, along with the Supreme Court’s 2007 decision requiring the EPA to regulate carbon dioxide as a pollutant. The Clean Power Plan is a key component of America’s commitment to reduce global warming under the 2015 Paris Climate Agreement, and there is broad public support for reducing emissions of CO2 from existing coal-fired power plants (69% of Americans, including majorities in all 50 states and all 435 Congressional Districts, see Figure 1). 


Figure 2. Weakening of U.S. air pollution regulations goes against widespread public support for clean air. A January 2017 poll by Reuters found that 39% of Americans would like to see the EPA "strengthened or expanded," 22% wanted it to "remain the same," and just 19% said they would like to see the agency "weakened or eliminated.” The rest said they "don't know." Image credit: John Mashey, desmogblog.com.

Benefits of the Clean Power Plan far exceed the costs


The EPA estimates that annual costs to industry of the Clean Power Plan will be $1.4-$2.5 billion in 2020, increasing to $5.1-$8.4 billion per year in 2030. These estimates factor in the costs of investments in transitioning to lower-carbon electricity options and the savings that result from investments in energy efficiency. Electricity bills are predicted to rise modestly by 2.4%-2.7% in 2020, but then decline by 2.7%-3.8% in 2025, and 7.0%-7.7% in 2030 as investments in energy efficiency pay off.

The public health and climate benefits of the Clean Power Plan are worth an estimated $34 billion to $54 billion per year in 2030, far outweighing the costs, the EPA estimates. Burning fewer fossil fuels will create less air pollution, and air pollution from the power generation industry will fall about 25% by 2030 if the Clean Power Plan is adopted. The EPA projects that the reduction in pollution will prevent up to 3,600 deaths, 1,700 heart attacks, 90,000 asthma attacks, and 300,000 missed work and school days per year by 2030 (note that a person who dies from air pollution-related causes typically dies about 12 years earlier than they otherwise might have, according to Caiazzo et al., 2013). For every dollar Americans spend on the Clean Power Plan, $4 worth of health benefits will result, says the EPA. The greatest benefits would come in the upper Ohio Valley and farther downwind, where pollution from power plants is highest: southeast Ohio, northwest West Virginia, and western Pennsylvania—areas Trump carried in the 2016 election, including two swing states that pushed him over the top.  


Figure 3. Levels of the deadliest pollutant, fine particles less than 2.5 microns in diameter (PM 2.5), have fallen by 37% and prevented tens of thousands of premature deaths since 2000, thanks to EPA Clean Air Act regulations. A peer-reviewed 1997 EPA Report to Congress reviewed the benefits of the Act from 1970 to 1990, and concluded that, in 1990 alone, pollution reductions under the Act prevented 205,000 early deaths—more than three times the number of U.S. combat deaths in Vietnam. However, this progress is now threatened by the pollution-friendly Trump administration. Image credit: U.S. EPA. 

Opposition to the Clean Power Plan
As one should expect, lobbying groups who receive money from the fossil fuel industry are unhappy with the Clean Power Plan, and criticize the plan’s complexity and large number of regulations. They have a point—it would have been far simpler and more effective to achieve the plan’s goals through a cap-and-trade system, or through a cap-and-dividend approach, or by having Congress adopt a simple carbon tax of $40 per ton (a version of which was proposed in February by a group of Reagan and Bush-era Republicans called the Climate Leadership Council). However, Congress failed to pass a cap-and-trade bill during Obama’s first term, and he was forced to use the regulatory power of the EPA to bring about the reduction in U.S. greenhouse gas emissions needed for the Paris Climate Agreement. 

Critics also dispute EPA’s cost estimates, saying the costs will be much higher. Several of these criticisms state only the costs, not the benefits, and also ignore the huge death toll of air pollution. And at least one study has found that the EPA underestimated the benefits and lives saved by the Clean Power Plan—an independent analysis by Energy Innovation: Policy and Technology LLC,  an energy and environmental policy firm. In a 2017 study, they estimated that the cumulative savings to the U.S. economy (in reduced capital, fuel, and operations and maintenance expenditures) of adopting the Clean Power Plan would exceed $100 billion by 2030, and reach almost $600 billion by 2050, assuming that pollution reductions continue to stay strong after 2030. Failure to adopt the Clean Power Plan would cause more than 40,000 premature deaths annually in 2030, and more than 120,000 per year by 2050. Energy Innovation came up with their estimates using the Energy Policy Simulator (EPS) open-source computer model.


Figure 4. Costs and benefits of the Clean Power Plan as estimated by the U.S. EPA. Image credit: U.S. EPA.

Repealing the Clean Power Plan won’t happen quickly
The Clean Power Plan will be difficult to undo quickly. The plan was finalized by EPA in 2015, and is currently being reviewed in the U.S. Court of Appeals for the District of Columbia Circuit. Under the new executive order, the Department of Justice will ask the court to suspend the case until the EPA can review and write a new version of the rule. (Before that happens, the court may still rule on the Plan as written, which will influence how the EPA can rewrite the rule.) Once the case is removed from the court, the EPA will have to legally withdraw the existing rule and propose a new rule to take its place, a process that could take years, as the new rule will have to be justified in court, and would likely be challenged in court by environmental groups, according to an in-depth analysis by Brad Plumer at vox.com. In the meantime, nothing prevents states from continuing to reduce emissions by implementing renewable energy standards, efficiency programs, or cap-and-trade programs like those that exist in California and the Northeast. Thus, some of the benefits of the Clean Power Plan will happen regardless of Trump’s orders, and 31 states are on track to be more than halfway toward their near-term Clean Power Plan emission reduction requirements (Figure 5). 


Figure 5. A 2015 Union of Concerned Scientists (UCS) analysis showed that existing clean energy commitments already place 31 states on track to be more than halfway toward their near-term Clean Power Plan emission reduction requirements, with 21 states set to surpass them. These commitments include carbon caps, mandatory renewable electricity and energy efficiency standards, announced coal plant retirements, and bringing on line nuclear power plants currently under construction.

New executive order attacks the “social cost of carbon”  
The “social cost of carbon” is an estimate of how much human emissions of carbon dioxide cost society via damage to the climate. In 2015, this number was set at $36 per ton of carbon dioxide pollution, and the social cost of carbon underpins at least 150 federal regulations. The “social cost of carbon” tries to answers the question, “how much should we be willing to pay to avert future climate damages?” This number is highly uncertain, but is definitely not zero. Trump’s executive order calls for a reassessment of the social cost of carbon, with the aim of reducing it or entirely circumventing it. Carbonbrief.org has an excellent explainer on the “social cost of carbon.”

Automobile fuel efficiency standards to be reviewed  
President Trump, speaking in Detroit on March 15 to a group of autoworkers, said the U.S. Environmental Protection Agency will take action to potentially relax tough air pollution rules for cars and light trucks that were set to kick in between 2022 and 2025. A review of the rules was completed in 2016, ahead of a deadline in 2018. “It was necessary (to resume the review) because the standards were set far into the future," Trump said. "If the standards threaten auto jobs, then common sense changes could have — and should have — been made." The review opens up the possibility that the strict fuel economy regulations for 2022-2025 will be significantly weakened; it is relatively easy for the EPA to undo the regulations, according to a New York Times analysis. Once the 2017 review is finished, the EPA can withdraw the current rule for post-2021 emissions and put forth an alternative set of standards within a year. The EPA may also withdraw a waiver that allows California (and other states that have joined it) to enforce stricter auto emissions standards than the federal government imposes. Air pollution from vehicles in the U.S. is responsible for about 26% of all U.S. air pollution deaths, so weakening of these regulations will likely result in thousands of premature deaths that would not have occurred otherwise—in addition to the thousands of deaths we can expect from a weakening of the Clean Power Plan.

U.S. Paris Climate Agreement commitments unlikely to be met  
Trump’s executive order and proposed budget make it clear that we can expect most of the efforts to reduce U.S. emissions of greenhouse gases under the Paris Climate Agreement to come under attack, and it is unlikely the U.S. pledge will be met. In that landmark agreement, the U.S. promised a 26%-28% reduction in U.S. greenhouse gas emissions by 2025, as its fair share of the effort to keep global warming no more than 2 °C above preindustrial levels (the generally accepted goal for avoiding dangerous impacts). According to an excellent analysis by vox.com, the Clean Power Plan accounts for roughly one quarter of all the emission reductions promised by the U.S. as part of the 2015 Paris Climate Agreement. The other three-quarters of the reductions were to come primarily from stricter fuel economy stands for vehicles, tighter emission standards for new coal- and gas-fired power plants, new regulations to curtail methane leaks and limit methane from agriculture, energy efficiency measures, and initiatives to curtail hydrofluorocarbons (another potent greenhouse gas). 

Taken altogether, the numbers from these efforts don’t quite add up to the promised 26%-28% reduction in greenhouse gases by 2025, said a 2015 World Resources Institute analysis—and thus additional actions beyond what Obama proposed would be needed. According to a 2016 paper, ”Assessment of the climate commitments and additional mitigation policies of the United States,” and the climateactiontracker.org web site, current U.S. policies, including the Clean Power Plan, would only reduce emissions by 9% below 2005 levels by 2025. A much more aggressive Clean Power Plan was being counted on, plus a whole host of "TBD" actions needed from President Obama’s successor. An excellent new analysis by the Rhodium Group predicts that Trump’s current executive orders and proposed budget will most likely result in a 14% reduction in U.S. greenhouse gas emissions below 2005 levels by 2025—far below the promised 26%-28% reduction of the Paris Climate Accord. The Rhodium Group’s worst-case scenario—if further efforts to weaken greenhouse gas regulations occur, such as a rollback of automobile emission standards for the 2022-2025 period—was a 9% reduction in U.S. greenhouse gas emissions by 2025; their best-case scenario was a 17% reduction. 


Figure 6. U.S. greenhouse gas emissions as projected in 2008 for a "business as usual" scenario (gray dotted line) and under the pledge made as part of the Paris Agreement (orange and green dotted lines). Image credit: Earth Institute/Columbia University.

Assault on methane emission rules  
Methane is also a major greenhouse gas, and Trump’s executive order directs efforts to reconsider and rewrite rules on methane emissions. This follows on the March 2, 2017, directive from the EPA to withdraw a 2016 Information Collection Request which directed existing oil and gas facilities to provide data needed to best reduce methane and other harmful emissions from the oil and natural gas industry. However, new methane rules will take years to rewrite and will have to suffer court challenges, and one state—California—voted on March 23 to approve new methane regulations that are the strictest ever adopted in the U.S.

More serious attacks on clean air and clean water likely coming  
Wunderground’s climate change blogger, Dr. Ricky Rood, in a 2017 editorial in EOS, warns that, “Following Trump’s rhetoric, we must be prepared to face efforts aimed at weakening the Clean Air Act itself. Also in the crosshairs are many other environmental statutes passed in the 1970s, such as the National Environmental Policy Act, the Clean Water Act, the Endangered Species Act, and the Safe Drinking Water Act. In terms of enduring impacts, weakening of these underlying statutes will be more consequential than scuttling the Clean Power Plan.” In an email to me, Dr. Rood said he believes that a rollback of auto-emission standards will ultimately end up being more consequential to air pollution and the climate than a rollback of the Clean Power Plan. This will be because market forces are making it likely that the power-generation industry will head towards renewable-energy sources, but market forces are not acting that way on the auto industry—external regulation is needed to force emission reductions. 

Links
The latest assault on climate science by House Republicans happens at 10 a.m. EDT, Wednesday, March 29, when the House Committee on Science, Space and Technology holds a 2-hour hearing titled, “Climate Science: Assumptions, Policy Implications, and the Scientific Method.” The Republicans have called three witnesses: Dr. Judith Curry, Dr. John Christy, and Dr. Roger Pielke, Jr., all of whom are unfriendly to climate science. The Democrats got to call one witness, Dr. Michael Mann of climate “hockeystick” fame. The hearing is being livestreamed here: https://www.youtube.com/watch?v=WM86Bl4jSEI. The Democratic press team will be using the hashtags #defendscience and #ActonClimate during the hearing.

Brad Plumer of vox.com has an excellent explainer on Trump’s executive order.

Follow the Climate Deregulation Tracker website to monitor efforts undertaken by the Trump administration to scale back or wholly eliminate federal climate mitigation and adaptation measures. 

March Madness: Trump Proposes 31% Cut to EPA and Big Cuts to Climate Change Programs, my March 16 post

EPA Chief Denies Basic Climate Science
, my March 10 post

Commentary
"Together we are going to start a new energy revolution," Trump said, upon signing Tuesday’s executive order. However, his order promotes dirty and deadly 19th Century coal technology, instead of clean 21st Century renewable energy solutions like wind and solar power, making his remarks sadly preposterous. The name of his order, the “Energy Independence Executive Order” is also preposterous, since the U.S. doesn’t import coal, and the stated primary aim of the new order is to revive the coal industry (coal miners were on hand for the signing ceremony). 

In his first speech to Congress, Trump promised that his administration would work to “promote clean air and clean water.” This promise has been exposed as a blatant falsehood by his executive orders and proposed budget, which move us sharply in the opposite direction. By itself, a U.S. failure to make its emission reduction targets of the Paris Climate Agreement will not doom the world to a dangerous rise in temperature above the 2  °C threshold. However, we’ll be lucky to hold global warming to an extremely dangerous 3°C above pre-industrial levels, even if all of the promises made by the 195 nations that signed the Paris Agreement are met. That agreement counted on strong additional actions and leadership by the biggest emitting nations to force additional cuts in greenhouse gas emissions. Lack of inspirational American leadership, as glaringly evident in Mr. Trump’s latest executive order, will hurt global efforts to meet even the grossly inadequate goal of keeping global warming below 3 °C, increasing the odds that humanity will have to resort to desperate geoengineering efforts to keep climate mayhem from wrecking Earth as a livable planet for humans. We must resist and protest Trump’s assault on clean air and a livable climate as if our lives depend upon it—because they do.

Contact your House Representative
Contact your Senator

Jeff Masters

https://www.wunderground.com/blog/JeffMasters/trumps-executive-order-threatens-to-wreck-earth-as-a-livable-planet

Sunday, March 13, 2016

February Smashes Earth's All-Time Global Heat Record by a Jaw-Dropping Margin

by Jeff Masters and Bob Henson, Wunderground, March 13, 2016

On Saturday, NASA dropped a bombshell of a climate report. February 2016 has soared past all rivals as the warmest seasonally adjusted month in more than a century of global record keeping. NASA’s analysis showed that February ran 1.35 °C (2.43 °F) above the 1951-1980 global average for the month, as can be seen in the list o fmonthly anomalies going back to 1880. The previous record was set just last month, as January 2016 came in 1.14 °C above the 1951-1980 average for the month. In other words, February has dispensed with this one-month-old record by a full 0.21 °C (0.38 °F) -- an extraordinary margin to beat a monthly world temperature record by. Perhaps even more remarkable is that February 2015 crushed the previous February record -- set in 1998 during the peak atmospheric influence of the 1997-98 “super” El Niño that’s comparable in strength to the current one -- by a massive 0.47 °C (0.85 °F).


Figure 1. Monthly global surface temperatures (land and ocean) from NASA for the period 1880 to February 2016, expressed in departures from the 1951-1980 average. The red line shows the 12-month running average. Image credit: Stephan Okhuijsen, datagraver.com, used with permission.

An ominous milestone in our march toward an ever-warmer planet
Because there is so much land in the Northern Hemisphere, and since land temperatures rise and fall more sharply with the seasons than ocean temperatures, global readings tend to average about 4 °C cooler in January and February than they do in July or August. Thus, February is not atop the pack in terms of absolute warmest global temperature: that record was set in July 2015. The real significance of the February record is in its departure from the seasonal norms that people, plants, animals, and the Earth system are accustomed to dealing with at a given time of year. Drawing from NASA’s graph of long-term temperature trends, if we add 0.2 °C as a conservative estimate of the amount of human-produced warming that occurred between the late 1800s and 1951-1980, then the February result winds up at 1.65 °C above average. If we use 0.4 °C as a higher-end estimate, then February sits at 1.85 °C above average. Either way, this result is a true shocker, and yet another reminder of the incessant long-term rise in global temperature resulting from human-produced greenhouse gases. Averaged on a yearly basis, global temperatures are now around 1.0 °C beyond where they stood in the late 19th century, when industrialization was ramping up. Michael Mann (Pennsylvania State University) notes that the human-induced warming is even greater if you reach back to the very start of the Industrial Revolution. Making matters worse, we are committed to at least 0.5 °C of additional atmospheric warming as heat stored in the ocean makes its way into the air, as recently emphasized by Jerry Meehl (National Center for Atmospheric Research). In short, we are now hurtling at a frightening pace toward the globally agreed maximum of 2.0 °C warming over preindustrial levels.

El Niño and La Niña are responsible for many of the one-year up-and-down spikes we see in global temperature. By spreading warm surface water across a large swath of the tropical Pacific, El Niño allows the global oceans to transfer heat more readily into the atmosphere. El Niño effects on global temperature typically peak several months after the highest temperatures occur in the Niño 3.4 region of the eastern tropical Pacific. The weekly Niño3.4 anomalies peaked in mid-November 2015 at a record +3.1 °C , so it’s possible that February 2016 will stand as the apex of the influence of the 2015-16 El Niño on global temperature, although the first half of March appears to be giving February a run for its money. We can expect the next several months to remain well above the long-term average, and it remains very possible (though not yet certain) that 2016 will top 2015 as the warmest year in global record-keeping.

Lower atmosphere also sets a record in February
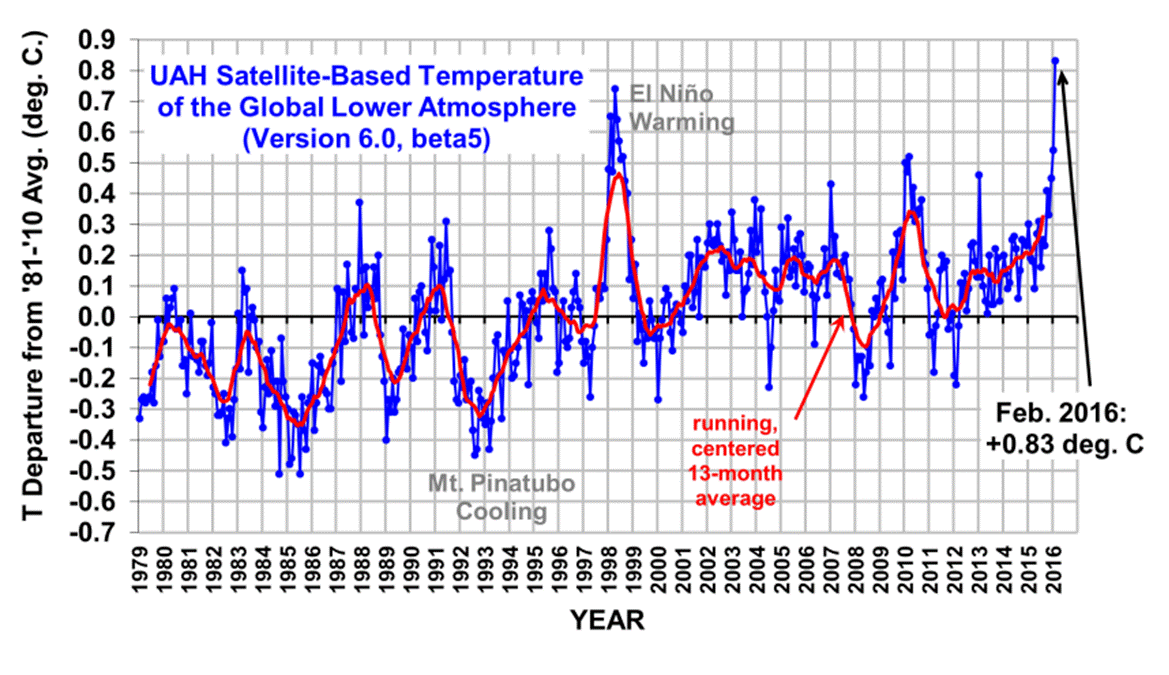
Satellite-based estimates of temperature in the lowest few miles of the atmosphere also set an impressive global record in February. Calculations from the University of Alabama in Huntsville show that February’s reading in the lower atmosphere marked the largest monthly anomaly since the UAH dataset began in late 1978. UAH's Dr. Roy Spencer, who considers himself a climate change skeptic, told Capital Weather Gang earlier this month, “There has been warming. The question is how much warming there’s been and how does that compare to what’s expected and what’s predicted.” The satellite readings apply to temperatures miles above Earth’s surface, rather than what is experienced at the ground, and a variety of adjustments and bias corrections in recent years (including an important one just this month) have brought satellite-based readings closer to the surface-observed trends.


Figure 2. Anomalies (departures from average) in surface temperature across the globe for February 2016, in degrees Centigrade, as analyzed by NASA’s Goddard Institute for Space Studies. Image credit: NASA/GISS.

Arctic leads the way
Figure 2 shows a big factor in the February result: a superheated Arctic. As shown by the darkest-red splotches in the figure, large parts of Alaska, Canada, eastern Europe, and Russia, as well as much of the Arctic Ocean, ran more than 4.0 °C (7.2 °F) above average for the month. This unusual warmth helped drive Arctic sea ice to its lowest February extent on record in February 2016. The tremendous Arctic warmth was probably related to interactions among warm air streaming into the Arctic, warm water extending poleward from the far northeast Atlantic, and the record-low extent of Arctic sea ice. Ground Zero for this pattern was the Barents and Kara Seas, north of Scandinavia and western Russia, where sea ice extent was far below average in February. Typically, the Norwegian archipelago of Svalbard -- which includes the northernmost civilian settlements on Earth -- is largely surrounded by ice from early winter into spring. This winter, the edge of the persistent ice has stayed mostly to the north of Svalbard, which has helped an absurd level of mildness to persist over the islands for months. Air temperatures at the Longyearbyen airport (latitude 78° N) have been close to 10 °C (18 °F) above average over the past three-plus months. This is the single most astounding season-long anomaly we’ve seen for any station anywhere on Earth. (If anyone can beat it, please let us know and we’ll add it here!)


Figure 3. Daily temperatures (in Celsius, °C) for the past year at the Longyearbyen Airport, Svalbard, Norway, located at latitude 78° N. The black line shows the seasonal average; blue and red traces show the day-to-day readings. The darker blue and red line shows the 30-day running average, which was 10.2 °C (18.4 °F) above normal in February. Thus far in March, the anomaly (not shown here) has been even larger, close to 12 °C (22 °F). Image credit: Norwegian Meteorological Institute.

February's heat had severe impacts
It has long been agreed upon in international climate negotiations that a 2v°C warming of the Earth above modern pre-industrial levels represents a "dangerous" level of warming that the nations of the world should work diligently to avoid. The December 2015 Paris Climate Accord, signed by 195 nations, included language on this, and the Accord recommend that we should keep our planet from warming more than 1.5 °C, if possible. Although the science of attributing extreme weather events to a warming climate is still evolving (more on this in an upcoming post), February 2016 gave us a number of extreme weather events that were made more probable by a warmer climate, giving us an excellent example of how a 2 °C warming of the climate can potentially lead to dangerous impacts. And, as we have been repeatedly warned might likely be the case, these impacts came primarily in less developed nations -- the ones with the least resources available to deal with dangerous climate change. According to the February 2016 Catastrophe Report from insurance broker Aon Benfield, three nations suffered extreme weather disasters in February 2016 that cost at least 4% of their GDP -- roughly the equivalent of what in the U.S. would be five simultaneous Hurricane Katrinas. According to EM-DAT, the International Disaster Database, these disasters set records for the all-time most expensive weather-related disaster in their nations' history. For comparison, nine nations had their most expensive weather-related natural disasters in history in all of 2015, and only one did so in 2014. Here are the nations that have set records in February 2016 for their most expensive weather-related natural disaster in history:


Vietnam has suffered $6.7 billion in damage from its 2016 drought, which has hit farmers especially hard in the crucial southern Mekong Delta. This cost is approximately 4% of Vietnam's GDP, and beats the $785 million cost (2009 USD) of Typhoon Ketsana of September 28, 2009, for most expensive disaster in their history. In this image, we see a boy holding his brother walking across a drought-hit rice field in Long Phu district, southern delta province of Soc Trang on March 2, 2016. Image credit: STR/AFP/Getty Images.


Zimbabwe has suffered $1.6 billion in damage from its 2016 drought. This is approximately 12% of their GDP, and beats the $200 million cost (2003 USD) of a February 2003 flood for most expensive disaster in their history. Zimbabwe's President Robert Mugabe on February 5, 2016, declared a 'state of disaster' in many rural areas hit by a severe drought, with more than a quarter of the population facing food shortages. This photo taken on February 7, 2016, shows the fast-drying catchment area of the Umzingwani dam in Matabeleland, Southwestern Zimbabwe. Image credit: Ziniyange Auntony/AFP/Getty Images.


Fiji suffered $470 million in damage from Category 5 Cyclone Winston's impact in February. This is approximately 10% of their GDP. The previous costliest disaster in Fiji was Tropical Cyclone Kina in January 1993, at $182 million (2016 USD) in damage. In this image, we see how Category 5 winds can completely flatten human-built structures: Fiji's Koro Island received a direct hit from Winston when the storm was at peak strength with 185 mph winds. Image credit: My Fijian Images and Jah Ray.

One other severe impact from February's record heat is the on-going global coral bleaching episode, just the third such event in recorded history (1998 and 2010 were the others). NOAA's Coral Reef Watch has placed portions of Australia's Great Barrier Reef under their "Alert Level 1," meaning that widespread coral bleaching capable of causing coral death is likely to occur. Widespread but minor bleaching has already been reported on the reef, and the coming month will be critical for determining whether or not the reef will experience its third major mass bleaching event on record.


Figure 4. Annual mean carbon dioxide growth rates for Mauna Loa, Hawaii. In the graph, decadal averages of the growth rate are also plotted, as horizontal lines for 1960 through 1969, 1970 through 1979, and so on. The highest one-year growth in CO2 was in 2015, at 3.05 ppm. The El Niño year of 1998 was a close second. The estimated uncertainty in the Mauna Loa annual mean growth rate is 0.11 ppm/yr. Image credit: NOAA’s Greenhouse Gas Reference Network.

Last year saw Earth’s highest-ever increase in carbon dioxide
Despite efforts to slow down human emissions of carbon dioxide, 2015 saw the biggest yearly jump in global CO2 levels ever measured, said NOAA last week. The annual growth rate of atmospheric carbon dioxide measured at NOAA’s Mauna Loa Observatory in Hawaii jumped by 3.05 parts per million during 2015, the largest year-to-year increase since measurements began there in 1958. In another first, 2015 was the fourth consecutive year that CO2 grew more than 2 ppm, said Pieter Tans, lead scientist of NOAA's Global Greenhouse Gas Reference Network. “Carbon dioxide levels are increasing faster than they have in hundreds of thousands of years,” Tans said. “It’s explosive compared to natural processes.” The last time the Earth experienced such a sustained CO2 increase was between 17,000 and 11,000 years ago, when CO2 levels increased by 80 ppm. Today’s rate of increase is 200 times faster, said Tans. In February 2016, the average global atmospheric CO2 level stood at 402.59 ppm. Prior to 1800, atmospheric CO2 averaged about 280 ppm.

The big jump in CO2 in 2015 is partially due to the current El Niño weather pattern, as forests, plant life and other terrestrial systems responded to changes in weather, precipitation and drought. In particular, El Niño-driven drought and massive wildfires in Indonesia were a huge source of CO2 to the atmosphere in 2015. The largest previous global increase in CO2 levels occurred in 1998, which was also a strong El Niño year. However, continued high emissions from human-caused burning of fossil fuels are driving the underlying growth rate. We are now approaching the annual peak in global CO2 levels that occurs during northern spring, after which the value will dip by several ppm. It is quite possible that the annual minimum in late 2015 will for the first time fail to get below 400 ppm, as predicted by Ralph Keeling (Scripps Institution of Oceanography) last October. To track CO2 concentrations at Mauna Loa and global CO2 concentrations, visit NOAA’s Greenhouse Gas Reference Network and the Keeling Curve website (Scripps).

For more on Saturday’s bombshell report, check out the coverage from Andrew Freedman (Mashable), Eric Holthaus (Slate), and Tom Yulsman (Scientific American/ImaGeo). We’ll have a follow-up post later this week on NOAA’s global climate report for February and for the Dec-Feb period, along with a roundup of all-time records set in February at major stations around the world.


https://www.wunderground.com/blog/JeffMasters/comment.html?entrynum=3264