Blog Archive

Showing posts with label Northwest Passage. Show all posts

Tuesday, September 25, 2012

Jeff Masters, Angela Fritz: Earth's attic is on fire -- Arctic sea ice bottoms out at new record low

by Jeff Masters and Angela Fritz, WunderBlog, September 20, 2012


The extraordinary decline in Arctic sea ice during 2012 is finally over. Sea ice extent bottomed out on September 16, announced scientists at the National Snow and Ice Data Center (NSIDC) on Wednesday. The sea ice extent fell to 3.41 million square kilometers, breaking the previous all-time low set in 2007 by 18% --despite the fact that this year's weather was cloudier and cooler than in 2007. Nearly half (49%) of the icecap was gone during this year's minimum, compared to the average minimum for the years 1979-2000. This is an area approximately 43% of the size of the Contiguous United States. And, for the fifth consecutive year -- and fifth time in recorded history -- ice-free navigation was possible in the Arctic along the coast of Canada (the Northwest Passage) and along the coast of Russia (the Northeast Passage or Northern Sea Route). "We are now in uncharted territory," said NSIDC Director Mark Serreze. "While we've long known that as the planet warms up, changes would be seen first and be most pronounced in the Arctic, few of us were prepared for how rapidly the changes would actually occur. While lots of people talk about opening of the Northwest Passage through the Canadian Arctic islands and the Northern Sea Route along the Russian coast, twenty years from now from now in August you might be able to take a ship right across the Arctic Ocean."


Figure 1. Arctic sea ice reached its minimum on September 16, 2012, and was at its lowest extent since satellite records began in 1979. Image credit: National Snow and Ice Data Center (NSIDC).

When was the last time the Arctic was this ice-free?
We can be confident that the Arctic did not see the kind of melting observed in 2012 going back over a century, as we have detailed ice edge records from ships (Walsh & Chapman, 2001). It is very unlikely the Northwest Passage was open between 1497 and 1900, since this spanned a cold period in the northern latitudes known as "The Little Ice Age." Ships periodically attempted the Passage and were foiled during this period. Research by Kinnard et al. (2011) shows that the Arctic ice melt in the past few decades is unprecedented for at least the past 1,450 years. We may have to go back to at least 4000 B.C. to find the last time so little summer ice was present in the Arctic. Funder and Kjaer (2007) found extensive systems of wave generated beach ridges along the North Greenland coast, which suggested the Arctic Ocean was ice-free in the summer for over 1,000 years between 6,000-8,500 years ago, when Earth's orbital variations brought more sunlight to the Arctic in summer than at present. Prior to that, the next likely time was during the last inter-glacial period, 120,000 years ago. Arctic temperatures then were 2-3 °C higher than present-day temperatures, and sea levels were 4-6 meters higher. 


Figure 2. Year-averaged and 3-month averaged Northern Hemisphere sea ice extent from Chapman and Walsh (2001), as updated by the University of Illinois Cryosphere Today. I've updated their graph to include 2011 plus the first 9 months of 2012. 


Figure 3. Late summer Arctic sea ice extent over the past 1,450 years reconstructed from proxy data by Kinnard et al.'s 2011 paper "Reconstructed changes in Arctic sea ice over the past 1,450 years." The solid pink line is a smoothed 40-year average, and the light pink areas shows a 95% confidence interval.  Note that the modern observational data in this figure extend through 2008, though the extent is not as low as the current annual data due to the 40-year smoothing. More commentary on this graph is available at skepticalscience.com.

When will the Arctic be ice-free in summer?
So, when will Santa's Workshop need to be retrofitted with pontoons to avoid sinking to the bottom of the Arctic Ocean in summer? It's hard to say, since there is a large amount of natural variability in Arctic weather patterns. Day et al. (2012) found that 5-31% of the changes in Arctic sea ice could be due to natural causes. However, the sea ice at the summer minimum has been declining at a rate of 12% per decade, far in excess of the worst-case scenario predicted in the 2007 IPCC report. Forecasts of an ice-free Arctic range from 20-30 years from now to much sooner. Just this week, Dr. Peter Wadhams of Cambridge University predicted that the Arctic will be ice-free in summer within four years. A study by Stroeve et al. (2012), using the updated models being run for the 2014 IPCC report, found that "a seasonally ice-free Arctic Ocean within the next few decades is a distinct possibility." Of the 21 models considered, 2022 was the earliest date that complete Arctic sea ice occurred in September.


Video 1. A powerful storm wreaked havoc on the Arctic sea ice cover in August 2012. This visualization shows the strength and direction of the winds and their impact on the ice: the red vectors represent the fastest winds, while blue vectors stand for slower winds. According to NSIDC, the storm sped up the loss of the thin ice that appears to have been already on the verge of melting completely. Video credit: NASA.

But Antarctic sea ice is growing!
It's a sure thing that when Arctic sea ice hits new record lows, global warming contrarians will attempt to draw attention away from the Arctic by talking about sea ice around Antarctica. A case in point is an article that appeared in Forbes on Wednesday by James Taylor [a noted minion of denial think tanks]. Mr. Taylor wrote, "Antarctic sea ice set another record this past week, with the most amount of ice ever recorded on day 256 of the calendar year (September 12 of this leap year)...Amusingly, page after page of Google News results for Antarctic sea ice record show links to news articles breathlessly spreading fear and warning of calamity because Arctic sea ice recently set a 33-year low. Sea ice around one pole is shrinking while sea ice around another pole is growing. This sure sounds like a global warming crisis to me."

This analysis is highly misleading, as it ignores the fact that Antarctica has actually been warming in recent years. In fact, the oceans surrounding Antarctica have warmed faster than the global trend, and there has been accelerated melting of ocean-terminating Antarctic glaciers in recent years as a result of warmer waters eating away the glaciers. There is great concern among scientists about the stability of two glaciers in West Antarctica (the Pine Island and Thwaites Glaciers) due the increase in ocean temperatures. These glaciers may suffer rapid retreats that will contribute significantly to global sea level rise. 

Despite the warming going on in Antarctica, there has been a modest long-term increase in Antarctic sea ice in recent decades. So, how can more sea ice form on warmer ocean waters? As explained in an excellent article at skepticalscience.com, the reasons are complex. One reason is that the Southern Ocean consists of a layer of cold water near the surface and a layer of warmer water below. Water from the warmer layer rises up to the surface, melting sea ice. However, as air temperatures warm, the amount of rain and snowfall also increases. This freshens the surface waters, leading to a surface layer less dense than the saltier, warmer water below. The layers become more stratified and mix less. Less heat is transported upwards from the deeper, warmer layer. Hence less sea ice is melted (Zhang, 2007). As the planet continues to warm, climate models predict that the growth in Antarctic sea ice will reverse, as the waters become too warm to support so much sea ice.


Figure 4. Surface air temperature over the ice-covered areas of the Southern Ocean surrounding Antarctica (top) and sea ice extent, observed by satellite (bottom). Image credit: (Zhang, 2007).

Commentary: Earth's attic is on fire
To me, seeing the record Arctic sea ice loss of 2012 is like discovering a growing fire burning in Earth's attic. It is an emergency that requires immediate urgent attention. If you remove an area of sea ice 43% the size of the contiguous U.S. from the ocean, it is guaranteed to have a significant impact on weather and climate. The extra heat and moisture added to the atmosphere as a result of all that open water over the pole may already be altering jet stream patterns in fall and winter, bringing an increase in extreme weather events. This year's record sea ice loss also contributed to an unprecedented melting event in Greenland. Continued sea ice loss will further increase melting from Greenland, contributing to sea level rise and storm surge damages. Global warming doubters tell us to pay attention to Earth's basement -- the Antarctic -- pointing out (incorrectly) that there is no fire burning there. But shouldn't we be paying attention to the steadily growing fire in our attic? The house all of humanity lives on is on fire. The fire is certain to spread, since we've ignored it for too long. It is capable of becoming a raging fire that will burn down our house, crippling civilization, unless we take swift and urgent action to combat it.

References
Funder, S. and K. H. Kjaer, 2007. A sea-ice free Arctic Ocean?, Geophys. Res. Abstr., 9 (2007) 07815.

Kinnard et al., 2011. Reconstructed changes in Arctic sea ice over the past 1,450 years, Nature.

Walsh, J. E and W. L.Chapman, 2001. Twentieth-century sea ice variations from observational data, Annals of Glaciology33(1) (January 2001) 444-448.

Related info
Half of the polar ice cap is missing: Arctic sea ice hits a new record low. September 6, 2012, blog post
Wunderground's Sea Ice page.


http://www.wunderground.com/blog/JeffMasters/comment.html?entrynum=2237

Tuesday, September 18, 2012

NSIDC Arctic Sea Ice Report of September 17, 2012: Arctic sea ice extent near the minimum


On September 17, 2012, Arctic sea ice extent was 3.41 million square kilometers. Within the next couple of days, we expect to announce that the minimum extent has been reached for the year.


Overview of conditions


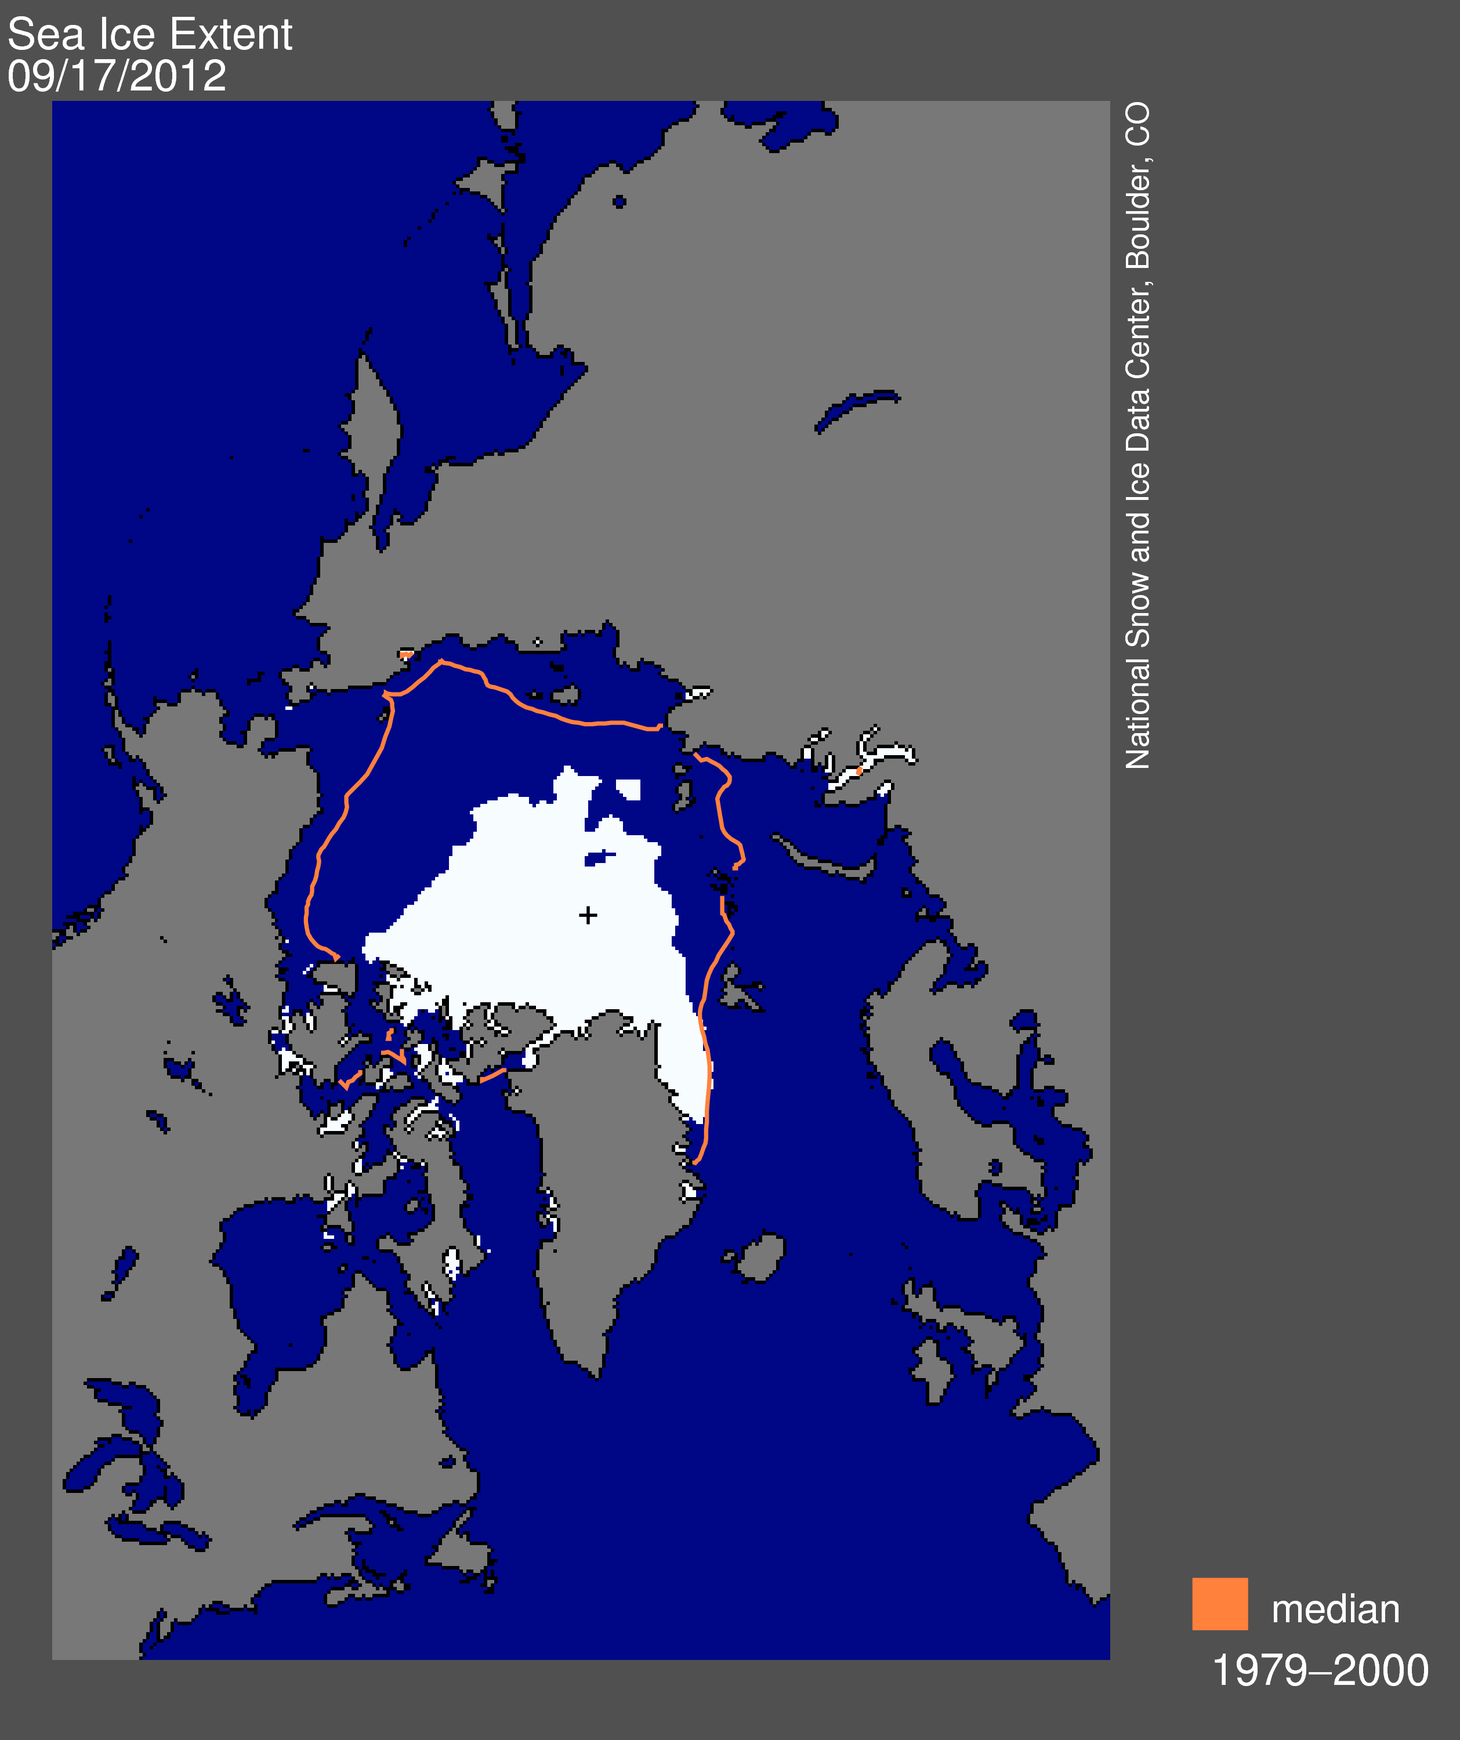
Figure 1. Arctic sea ice extent for September 17, 2012 was 3.41 million square kilometers (1.32 million square miles). The orange line shows the 1979 to 2000 median extent for that day. The black cross indicates the geographic North Pole. Sea Ice Indexdata. About the data. Credit: National Snow and Ice Data Center. High-resolution image
Sea ice extent for September 17 was 3.41 million square kilometers (1.32 million square miles). Weather conditions near the ice edge heavily influence the timing of the minimum, which has occurred as late as September 23. We are now five days past the 1979-2000 average minimum date of September 13. The decline has slowed in recent days and the minimum will likely be confirmed any day now.
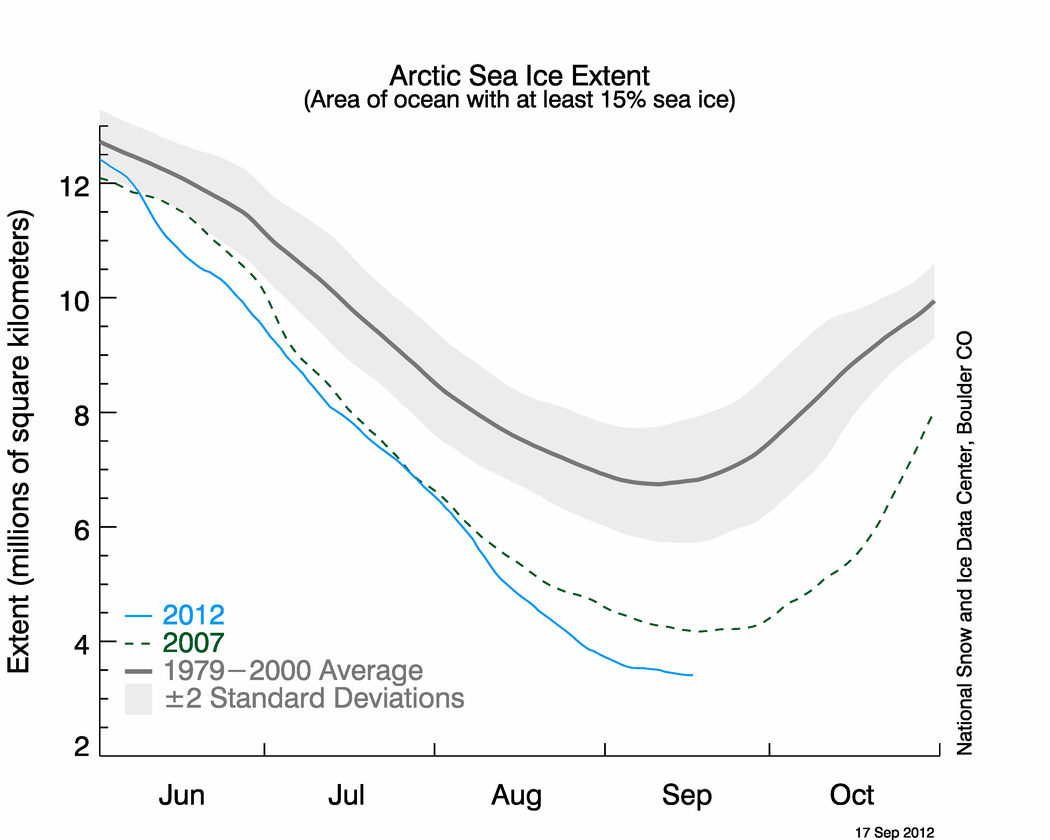
The current extent is 760,000 square kilometers (293,000 square miles) below the previous record minimum extent in the satellite record (4.17 million square kilometers or 1.61 million square miles) which occurred on September 18, 2007. This difference is larger than the size of the state of Texas. The ice extent currently tracks nearly 50% below the 1979-2000 average minimum extent.

Conditions in context


Figure 2. The graph above shows Arctic sea ice extent as of September 17, 2012, along with daily ice extent data for 2007. 2012 is shown in blue and 2007 in green. The gray area around the average line shows the two standard deviation range of the data. Sea Ice Index data. Credit: National Snow and Ice Data Center. High-resolution image
Since September 1, extent declined 316,000 square kilometers (122,000 square miles), or 19,800 square kilometers (7,600 square miles) per day. Freeze up has begun over the high latitude Arctic areas, such as the North Pole, and extent has started to increase in the Beaufort Sea region. However, extent is still decreasing on the Atlantic side of the Arctic, leading to the continued overall decline in recent days. The Northern Sea Route along the coast of Siberia has been largely free of ice since mid August. This is in contrast with 2007, when a persistent tongue of ice reaching the coast of the Laptev Sea clogged the Northern Sea Route.

The Northwest Passage


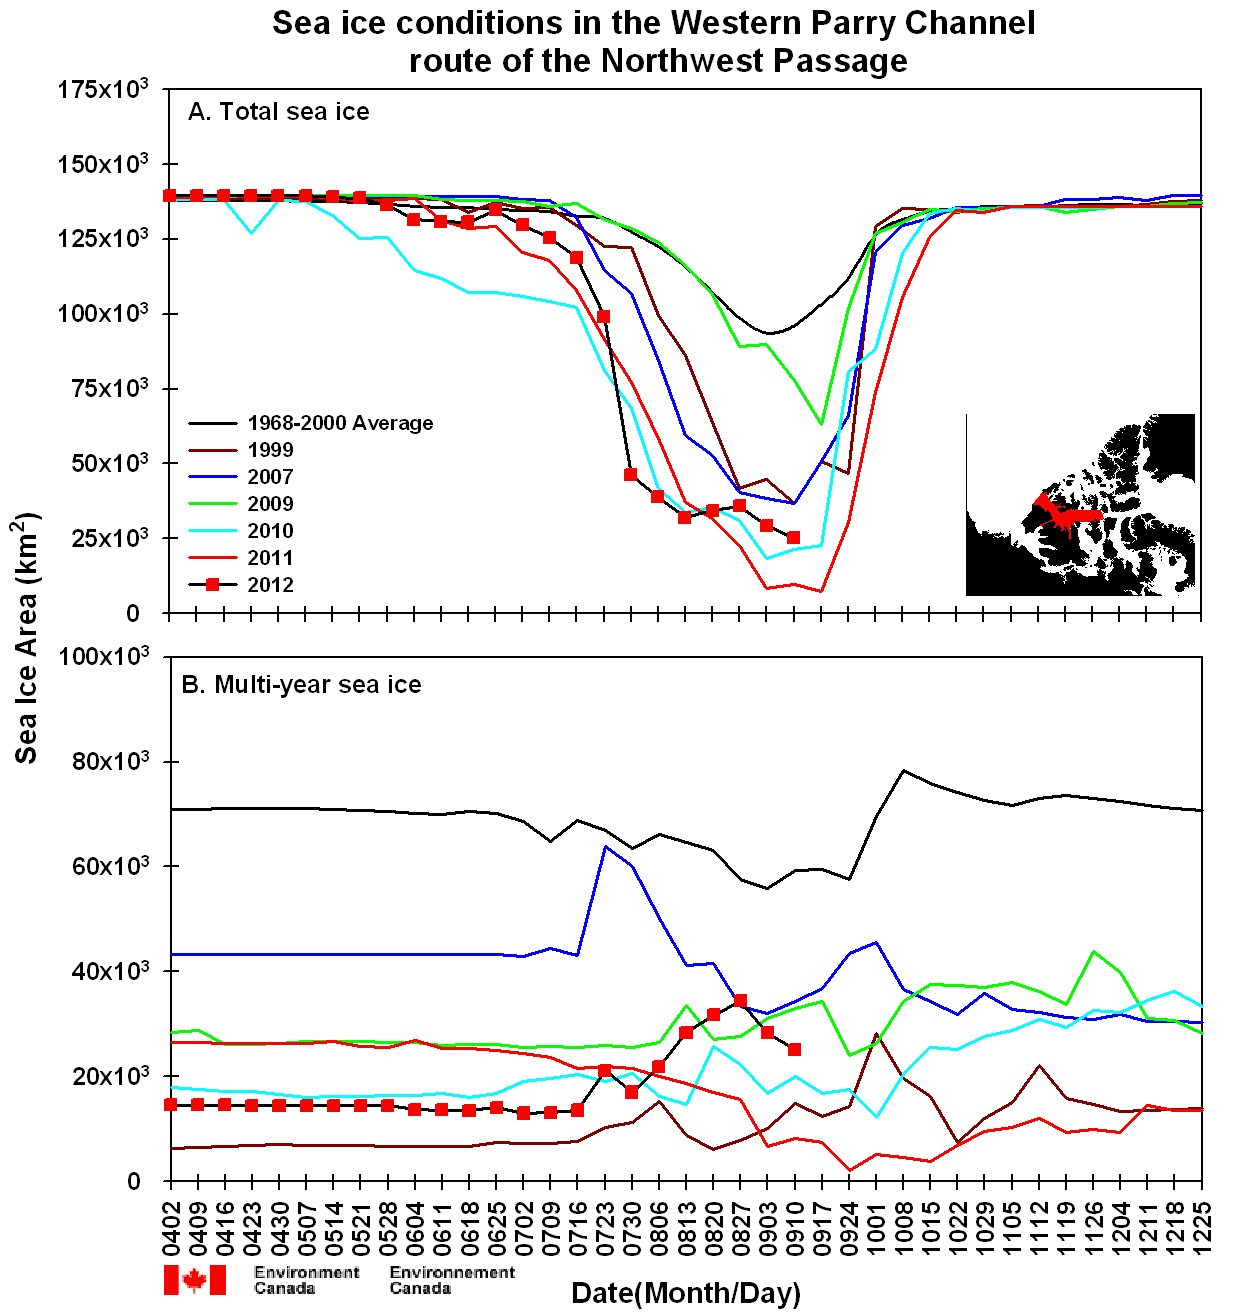
Figure 3. This time series shows total sea ice area (top) and multiyear ice area (bottom) for selected years within the Western Parry Channel route of the Northwest Passage. The black line with red dots shows 2012, and other colors show ice conditions in different years. Credit: NSIDC courtesy Stephen Howell, Environment Canada, from Canadian Ice Service data. High-resolution image
The situation in the Northwest Passage this year also contrasts with 2007. Both the narrow and shallow southern route used by the late polar explorer Roald Amundsen and the wide and deep northern route through the Parry Channel opened in 2007. This year only the southern route has opened. According to Stephen Howell of the Canadian Ice Service, rapid ice loss occurred in the Parry Channel in July. However, due in part to the August storm, a subsequent influx of multiyear ice from the north has kept at least some of the channel blocked.
These different patterns of ice loss in the sea routes between 2007 and 2012 highlight how a focus on overall total extent can overshadow regional aspects that have important implications. That 2007 was a record low extent at the time meant nothing to a ship trying to traverse the Northern Sea Route; likewise, the new record this year was meaningless to a ship trying to navigate through the Parry Channel.
Conditions in the Chukchi Sea, where Shell has started to drill for oil, provide another example. Shell’s operations were delayed in part because of greater than expected ice cover in the early summer. In the late summer, although passive microwave data showed that the Chukchi Sea was nearly ice-free, small floes of ice threatened Shell’s drilling platform, forcing the company to temporarily cease operations in the Arctic.

A report from the field


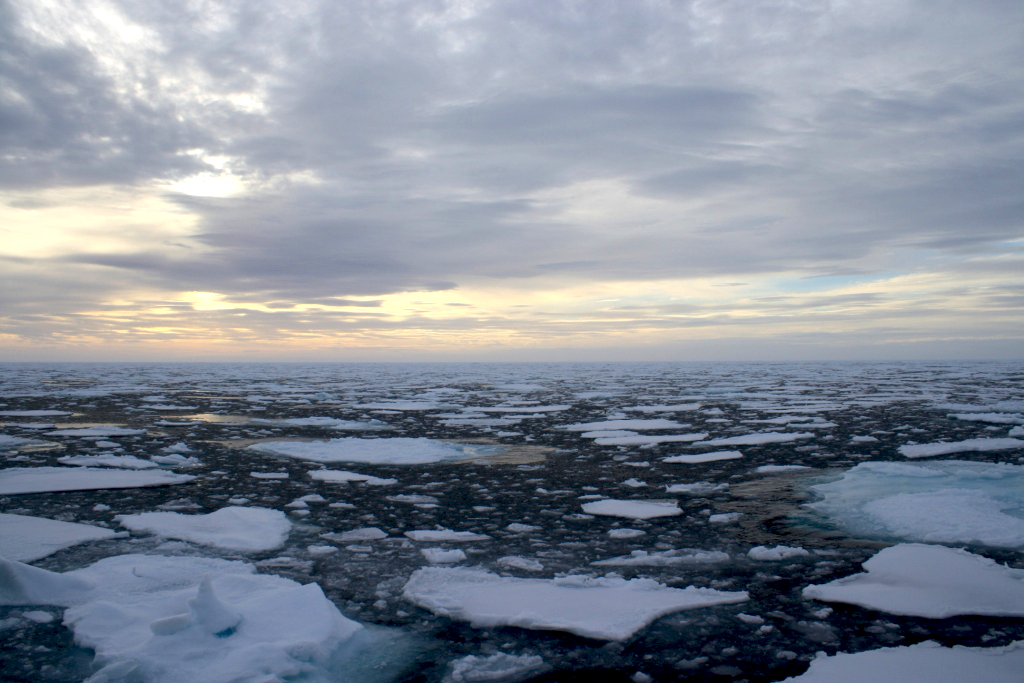
Figure 4. Above are photos of varying sea ice conditions north of Svalbard. The top photo shows shows denser ice cover, around 90% concentration, with a mixture of small floes and brash ice (i.e., slushy ice remnants of melt). The bottom photo shows lower concentrations of small ice floes with considerable open water.  Credit: National Snow and Ice Data Center, Julienne Stroeve
NSIDC scientist Julienne Stroeve has been traveling in the Arctic by ship, taking sea ice and temperature measurements on the Atlantic side of the Arctic Ocean. Her reports also show the regional variability of the ice cover. She reached the ice edge on September 10 at roughly 82 degrees North latitude, 15 degrees East longitude (essentially due north of Svalbard). Concentrations were quite high (around 90%) at the ice edge, but as the ship cruised north, concentration dropped to about 40% with considerable regions of open water.
Since entering the ice, Stroeve has encountered an average of up to 65% ice concentration primarily consisting of small floes (20-50 meters, or 66-164 feet) of mostly first-year ice. These floes are too small and thin to safely embark on to take measurements. However, the ship eventually found larger floes and Stroeve took ice thickness measurements indicating thicknessess of around 2 meters (6.5 feet). So far, air temperatures have remained above freezing and Stroeve has not observed any ice formation. The surface measurements taken by Stroeve and other scientists on board the ship are useful for validating satellite data and will provide more detail on the state of the sea ice cover. Stroeve sighted several polar bears, including a mother and her cub.

Saturday, August 28, 2010

NOAA's NSIDC Arctic Report, August 17, 2010

Dear Readers, The Northwest and Northeast Passages are both open at the same time for the third time in recorded history (August 27, 2010).  The NSIDC report below has a good description of the factors involved, even though this report dates from August 17.

North by Northwest


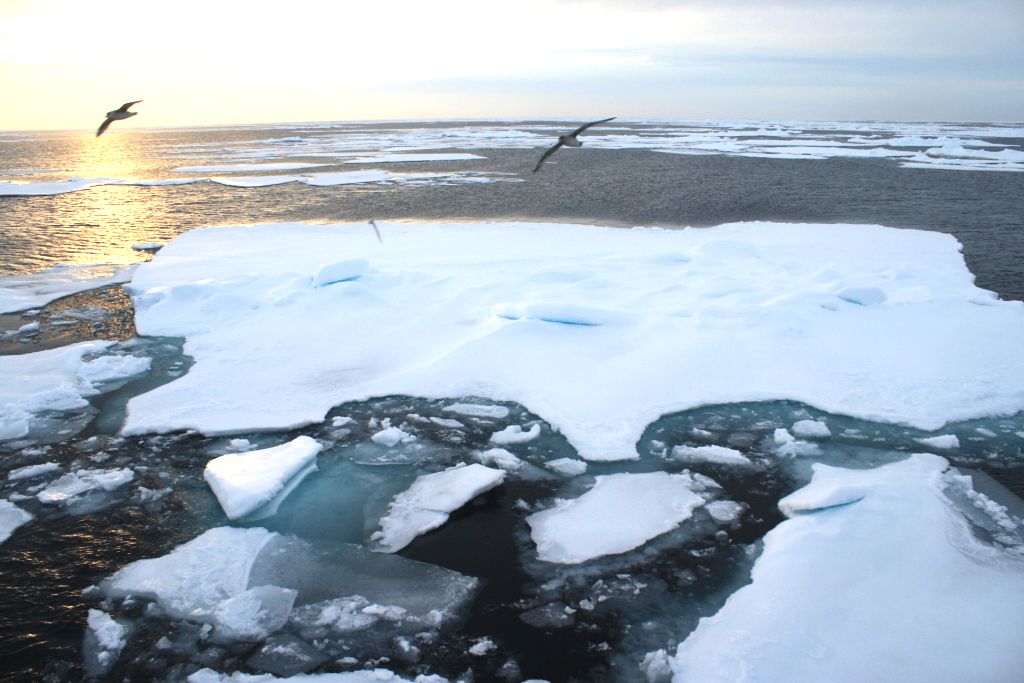
The end of summer is approaching in the Arctic; temperatures are dropping and melt is ending in the high latitudes. Yet summer is not quite over in the lower latitudes of the Arctic Ocean, where sea ice extent continues to decline. Sea ice has melted out extensively in the northern route of the Northwest Passage, but the passage is not completely open.
Meanwhile, in the Antarctic, sea ice extent continues to be well above normal, largely because of atmospheric circulation patterns set up by a high Antarctic Oscillation mode.
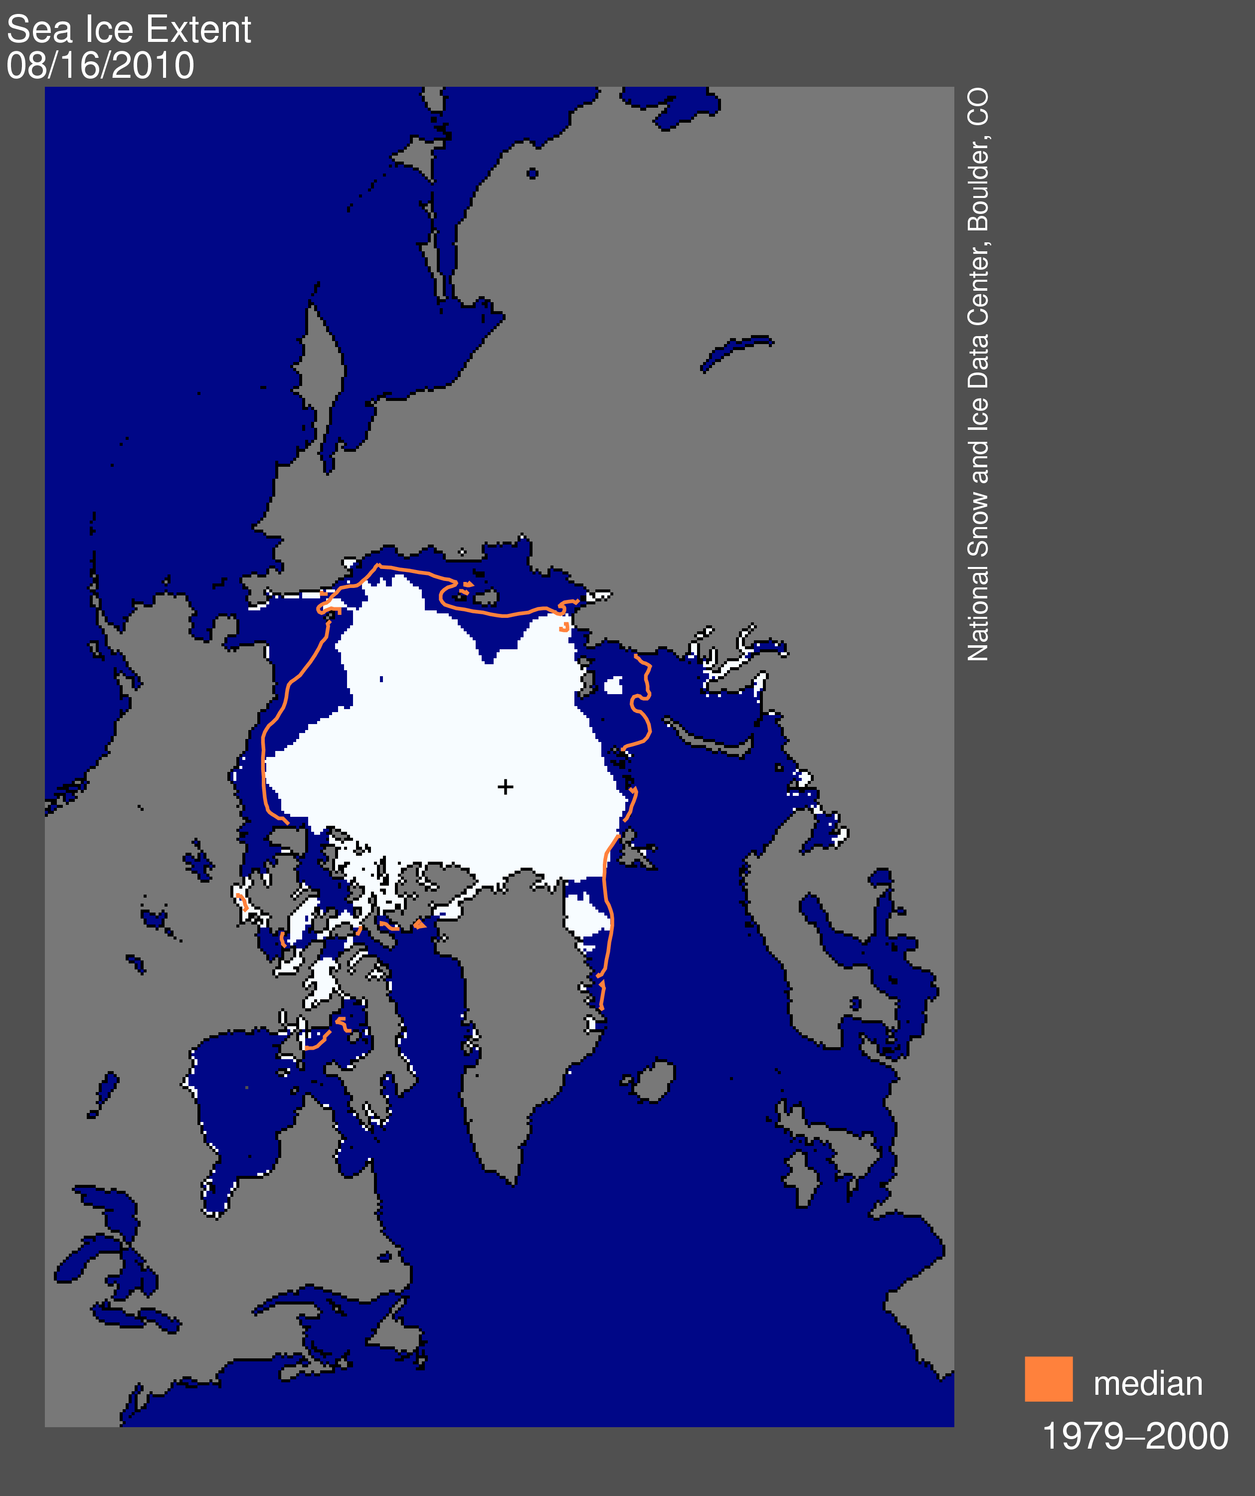
map from space showing sea ice extent, continentsFigure 1. Daily Arctic sea ice extent on August 16 was 5.95 million square kilometers (2.30 million square miles). The orange line shows the 1979 to 2000 median extent for that day. The black cross indicates the geographic North Pole.Sea Ice Index dataAbout the data—Credit: National Snow and Ice Data Center High-resolution image
Overview of conditions
As of August 16, 2010, Arctic ice extent was 5.95 million square kilometers (2.30 million square miles),1.68 million square kilometers (649,000 square miles) below the 1979 to 2000 average.
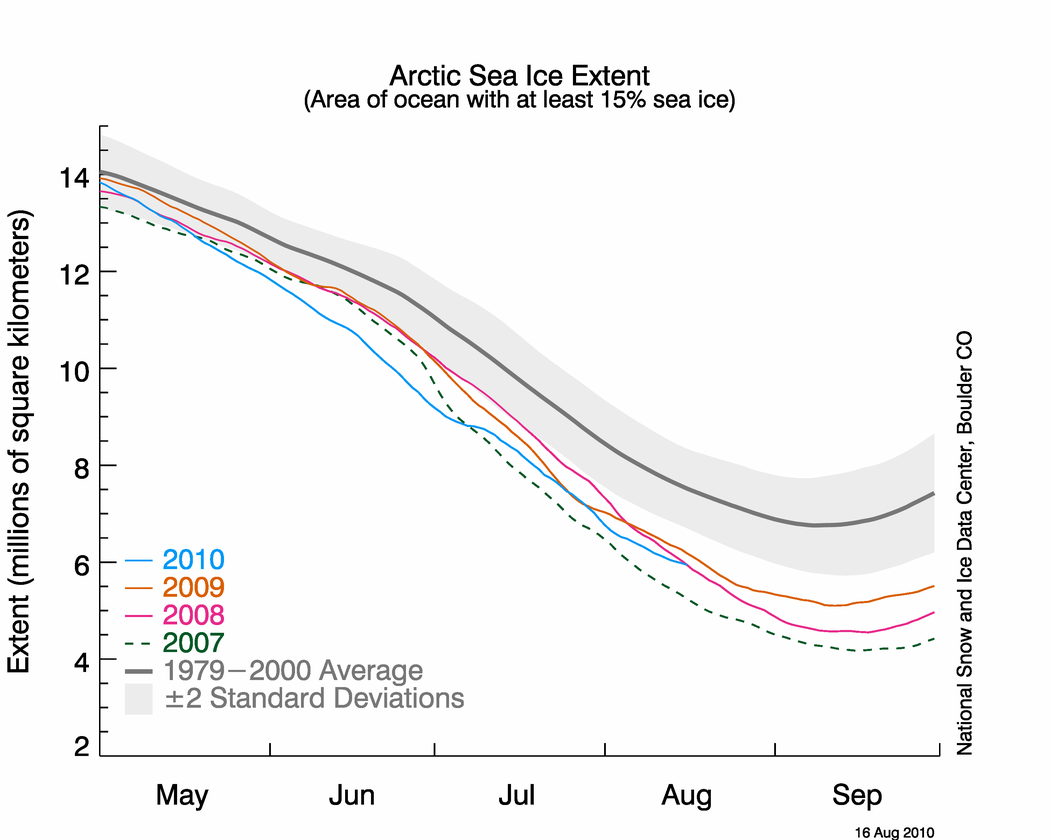
graph with months on x axis and extent on y axisFigure 2. The graph above shows daily Arctic sea ice extent as of August 16, 2010. The solid light blue line indicates 2010; dashed green shows 2007; solid pink shows 2008; solid orange shows 2009; and solid gray indicates average extent from 1979 to 2000. The gray area around the average line shows the two standard deviation range of the data. Sea Ice Index data.
—Credit: National Snow and Ice Data CenterHigh-resolution image
Conditions in context
As of August 16, only 2007 and 2008 had lower extent. Approximately one month remains in the melt season.
High pressure has moved in over the central Arctic Ocean, replacing stormier, lower-pressure conditions that persisted during July. Paired with lower pressure on the Siberian side, this pattern generates winds that push the ice northward and reduce the total ice extent, especially since much of the ice pack is spread out.
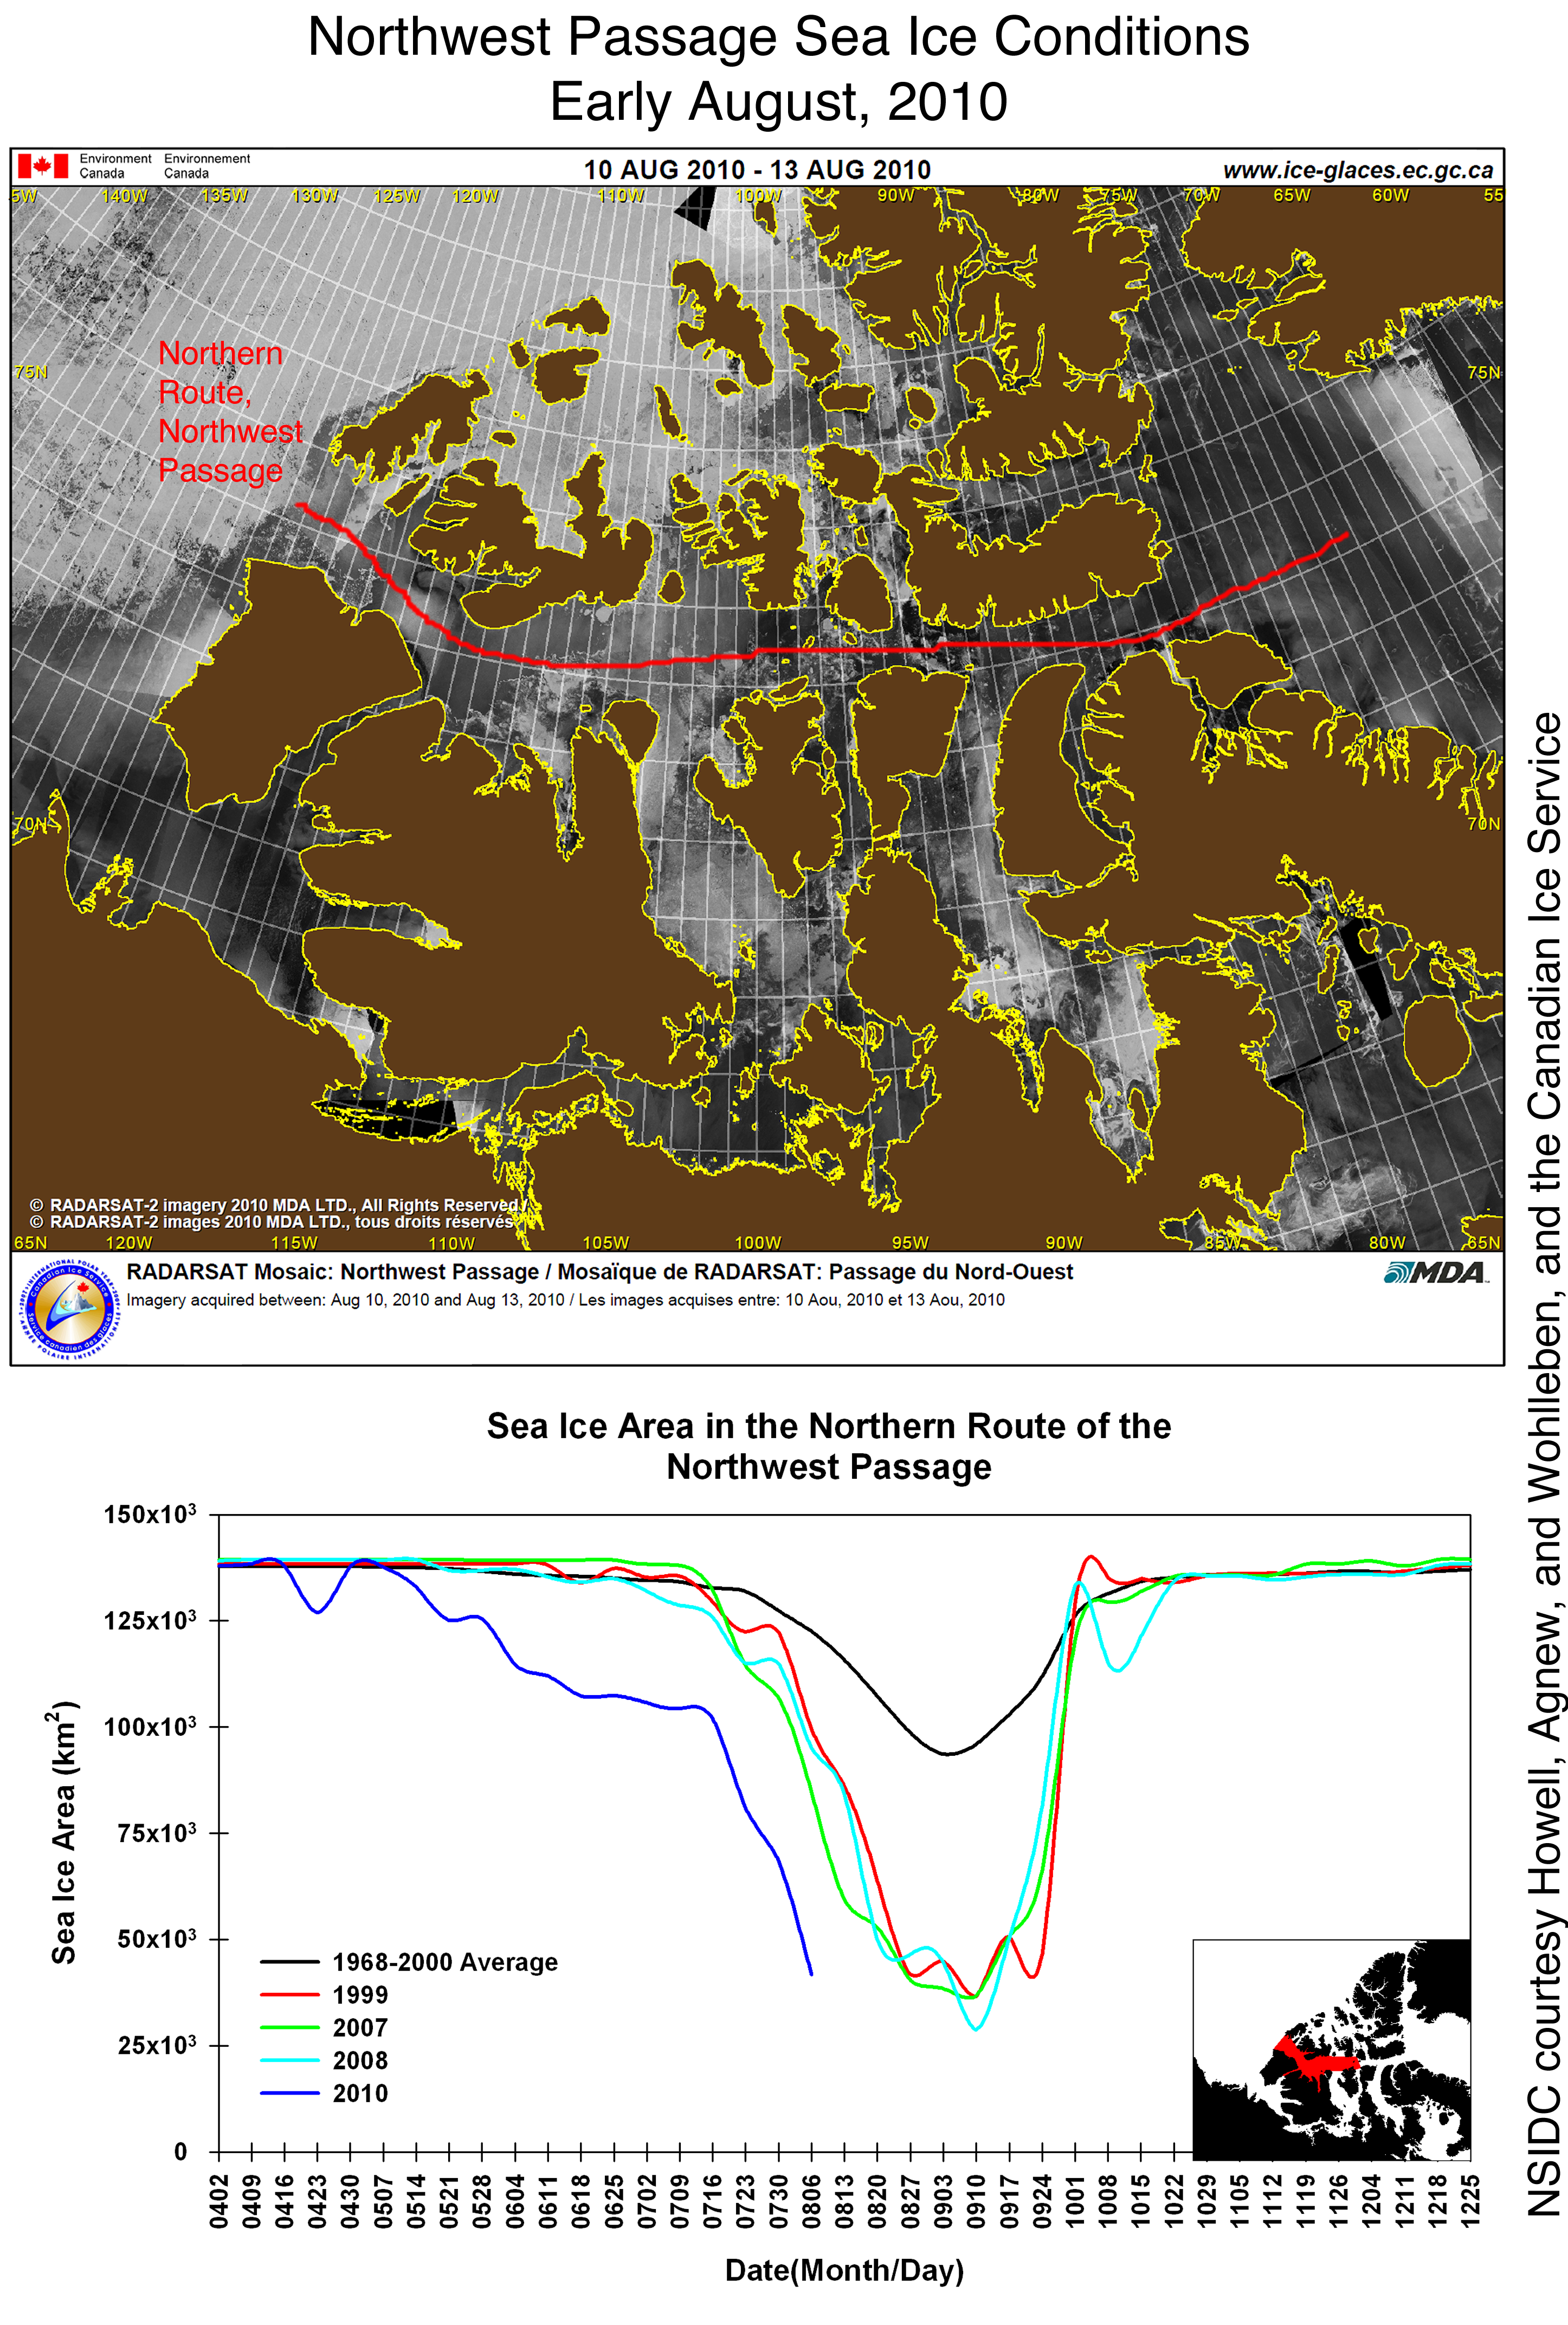
map showing nw passage and current ice conditionsFigure 3. Top: This image, from the Canadian Space Agency's RADARSAT-2 satellite, shows the northern route of the Northwest Passage this August; although the passage is not completely open, sea ice cover is light. Bright, circular and other sharply defined shapes are sea ice; dark grey indicates calm ocean; white smudged regions are areas of ocean that have been roughened by winds. Bottom: The graph of ice area in the northern route of the Northwest Passage shows that ice retreated earlier than normal. The blue line tracks the area of sea ice for 2010, compared to average and to previous low ice years.
—Credit: NSIDC courtesy Howell, Agnew, Wohlleben, and the Canadian Ice Service 
High-resolution image

Early clearing in the Northwest Passage
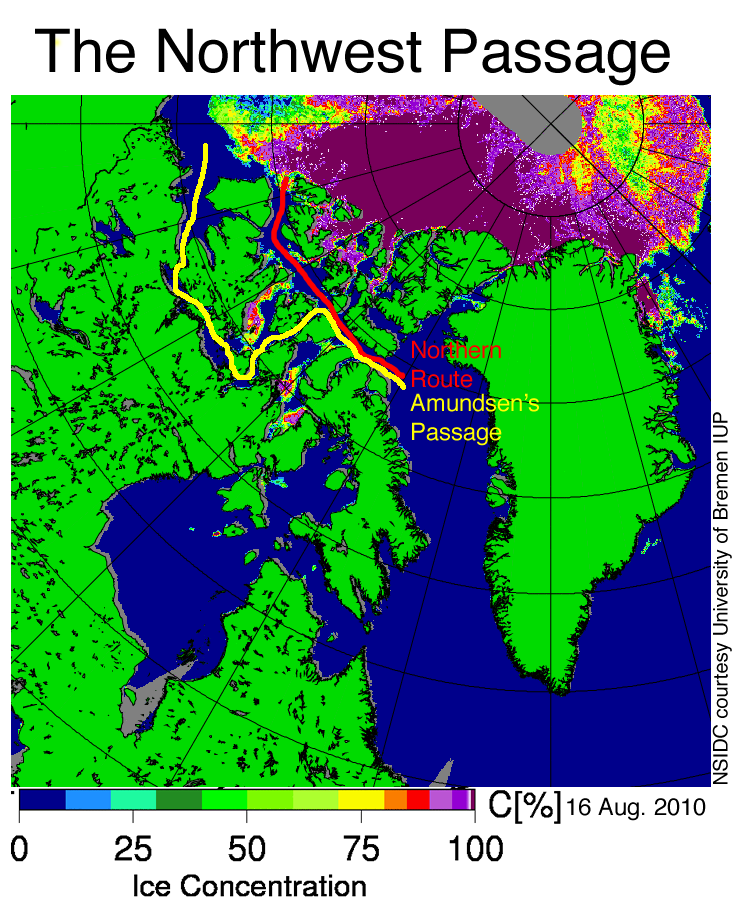
Stephen Howell, Tom Agnew, and Trudy Wohlleben from Environment Canada report that sea ice conditions in the Northwest Passage are very light. Ice is still present at the mouth of the M’Clure Strait, in central Viscount-Melville Sound, and in Larsen Sound, as of early August. As a result, neither the northern route (Western Parry Channel) nor the southern route (Amundsen’s Passage) through the Northwest Passage are completely clear of ice. Sea ice area within the northern route is currently well below the 1968-2000 average and almost a month ahead of the clearing that was observed in 2007, according to ice chart data from the Canadian Ice Service. In the southern route, there is still a substantial amount of ice.
This year’s early clearing of sea ice probably resulted from record warm temperatures this past spring over the Western Canadian Arctic, as well as the decline in older, multiyear ice in the channel over recent years. Spring 2010 was the warmest in the region since 1948: some regions of the Western Canadian Arctic were more than 6 °C (11 °F) above normal. These warm conditions helped break the ice up early in the northern route. If winds push sea ice away from the entrance to M’Clure Strait, the northern route of the Northwest Passage could open completely this year. However, even scattered sea ice remains a significant threat to navigation.
figure 4: ice concentrationFigure 4. This map shows ice concentration on August 16, 2010, from the NASA AMSR-E sensor on the Aqua satellite. Lines mark two well-known routes through the Northwest Passage: Amundsen's route is yellow, and the northern route is red. —Credit: NSIDC courtesy University of Bremen IUP
High-resolution image
History of the Northwest Passage
Conditions in the Northwest Passage are quite variable and do not necessarily reflect overall conditions in the Arctic. However, today’s conditions in the Northwest Passage would likely astonish 19th century explorers such as McClure, Franklin, and Amundsen. In upcoming decades, the passage will be increasingly likely to open during summer.
Last month, Canadian investigators located the wreckage of the HMS Investigator, which sank on an expedition led by Captain Robert McClure in the 1850s. The McClure expedition had set out to rescue the Franklin Expedition, which had gone missing after leaving Baffin Bay for the Northwest Passage in 1845. McClure attempted to enter the passage from the west through what is now called M’Clure Strait, but quickly became trapped in the ice. They remained trapped through two winters before being rescued by another ship. The Franklin Expedition was not so fortunate: all 128 men perished. It was another fifty years before Norwegian Roald Amundsen and a small crew successfully navigated the passage. Their trek, by the southern route, took over two years.
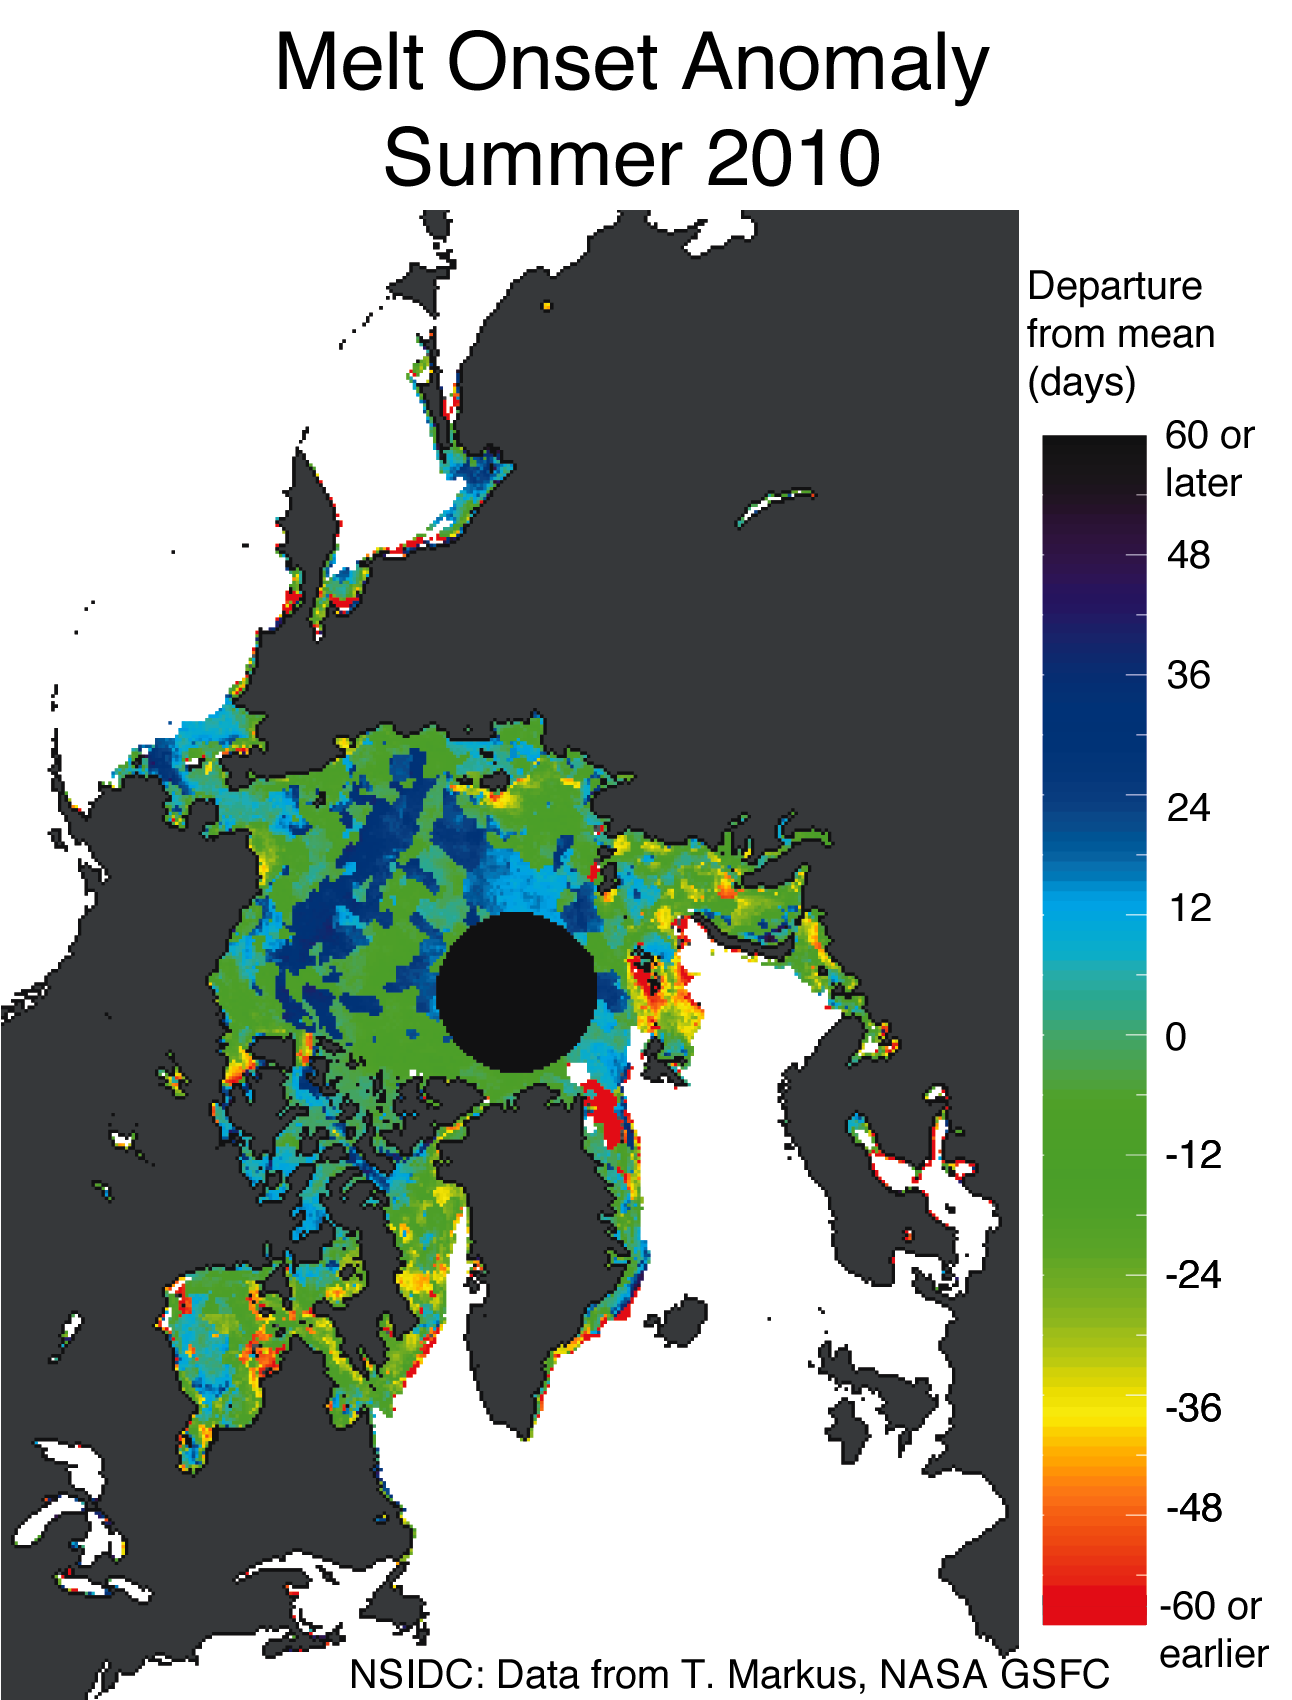
figure 4: ice concentrationFigure 5. This image shows melt onset anomalies in the Arctic Ocean for 2010, compared to the 1979 to 2000 average. Green, red, and yellow indicate areas of earlier melt onset, while blue and violet show regions of later melt onset. White and black indicate regions with no data.
—Credit: NSIDC courtesy Thorsten Markus, NASA GSFC/data from DMSP SSM/I and NASA AMSR-E   High-resolution image

The Northwest and Northeast Passages are open. Northwest Passage opens for 4th year in a row, 4th time in recorded history -- Jeff Masters' Wunderblog

The Northwest and Northeast Passages are open


Northwest Passage opens 4th year in a row


by Dr. Jeff Masters, Wunderblog, August 27, 2010

The Northwest Passage--the legendary shipping route through ice-choked Canadian waters at the top of the world--melted free of ice last week, and is now open for navigation, according to satellite mosaics available from the National Snow and Ice Data Center and The University of Illinois Cryosphere Today. This summer marks the fourth consecutive year -- and fourth time in recorded history -- that the fabled passage has opened for navigation. Over the past four days, warm temperatures and southerly winds over Siberia have also led to intermittent opening of the Northeast Passage, the shipping route along the north coast of Russia through the Arctic Ocean. It is now possible to completely circumnavigate the Arctic Ocean in ice-free waters, and this will probably be the case for at least a month. This year marks the third consecutive year -- and the third time in recorded history -- that both the Northwest Passage and Northeast Passage have melted free, according to the National Snow and Ice Data Center. The Northeast Passage opened for the first time in recorded history in 2005, and the Northwest Passage in 2007. It now appears that the opening of one or both of these northern passages is the new norm, and business interests are taking note--commercial shipping in the Arctic is on the increase, and there is increasing interest in oil drilling. The great polar explorers of past centuries would be astounded at how the Arctic has changed in the 21st century.


Figure 4. Arctic sea ice extent image for August 24, 2010, as compiled by The University of Illinois Cryosphere Today. The northern route (Western Parry Channel) through the Northwest Passage was completely clear of ice, as was the Northeast Passage. The southern route through the Northwest Passage was still partially blocked.

What caused the opening of the Northwest and Northeast Passages?
The remarkable thinning of Arctic sea ice in recent years has left behind a very thin layer of mostly 1-year old ice in the Arctic, highly vulnerable to rapid melting. As I describe in detail in wunderground's sea ice page, this thinning was mostly due to natural wind pattern in the 1990s, much warmer than average ocean waters invading the Arctic from both the Pacific and Atlantic Oceans, very warm air temperatures, and deposition of black soot from fires used to clear agricultural land in Europe and air pollution originating in industrialized regions of the Northern Hemisphere. This year, Canada experienced its warmest winter in history, and record warm temperatures were observed during spring over the Western Canadian Arctic. Spring 2010 was the warmest in the region since 1948; some regions of the Western Canadian Arctic were more than 6 °C (11 °F) above average. These warm conditions helped break the ice up early in the Northwest Passage. Warm conditions continued this summer over both the Northwest and Northeast Passages, with temperatures averaging 1-2 °C above average over the majority of the region. As observed in previous years, contributing to this year's melt was the presence of much warmer than average ocean waters invading the Arctic from both the Pacific and Atlantic Oceans, and the deposition of black soot on the ice, which absorbs sunlight and heats up the ice. Lack of sunshine and natural wind patterns this summer helped counteract the melting, though, compared to the record melt year of 2007. Still, 2010 is on track come in 2nd or 3rd place for the lowest summertime Arctic sea ice extent on record. The past six years have had the six lowest Arctic ice extents on record, and this summer's melting season took a huge toll on the amount of thick, multi-year old ice, according to the National Snow and Ice Data Center. Modeling results from the University of Washington Polar Science Center (Figure 5) suggest that the volume of Arctic sea ice is at a record low for this time of year. The loss of so much old, thick ice this year makes it increasing likely that Arctic sea ice will suffer a record retreat that surpasses 2007's, sometime in the next ten years. We are still on track to see the Arctic sea ice completely disappear in summer by 2030, as predicted by a number of Arctic sea ice experts.


Figure 5. Arctic sea ice volume as computed by the PIOMAS model of the University of Washington Polar Science Center.

When was the last time the Northwest and Northeast Passages melted free 3 consecutive years?
The first recorded attempt to find and sail the Northwest Passage occurred in 1497, and ended in failure. The thick ice choking the waterways thwarted all attempts at passage for the next four centuries. While we cannot say for certain the Northwest Passage did not open between 1497 and 1900, it is highly unlikely that a string of three consecutive summers where both the Northwest and Northeast Passage opened would have escaped the notice of early mariners and whalers, who were very active in northern waters. We can be sure the Northern Passages were never open between 1900-2005, as we have detailed ice edge records from ships (Walsh & Chapman, 2001). A very cold period dominated northern latitudes during the 1600s, 1700s, and 1800s, known as "The Little Ice Age", further arguing against an opening of the Northern Passages during those centuries. The Northern Passages may have been open at some period during the Medieval Warm Period, between 900 and 1300 AD. Temperatures in Europe were similar, though probably a little cooler, than present-day temperatures. However, the Medieval Warm Period warmth was not global, and it is questionable whether or not sections of the Northern Passages along the Alaskan, Canadian, and Russian shores shared in the warmth of the Medieval Warm Period. So, a better candidate for the last previous multi-year opening of the Northern Passages was the period 6,000-8,500 years ago, when the Earth's orbital variations brought more sunlight to the Arctic in summer than at present. Funder and Kjaer (2007) found extensive systems of wave generated beach ridges along the North Greenland coast that suggested the Arctic Ocean was ice-free in the summer for over 1,000 years during that period. Prior to that, the next likely time the Northern Passages were open was during the last inter-glacial period, 120,000 years ago. Arctic temperatures then were 2-3 °C higher than present-day temperatures, and sea levels were 4-6 meters higher. It is possible we'll know better soon. A new technique that examines organic compounds left behind in Arctic sediments by diatoms that live in sea ice give hope that a detailed record of sea ice extent extending back to the end of the Ice Age 12,000 years ago may be possible (Belt et al., 2007). The researchers are studying sediments along the Northwest Passage in hopes of being able to determine when the Passage was last open.

But Antarctic sea ice is at a record high!
Climate change contrarians like to diminish the importance of Arctic sea ice loss by pointing out that in recent years, Antarctic sea ice extent has hit several record highs, including in July of 2010. They fail to mention, though, the fact that ocean temperatures in the Antarctic sea ice region have warmed significantly in recent decades--and faster than the global average temperature rise! So how can sea ice increase when ocean temperatures are warming so dramatically? This topic is discussed in detail by one of my favorite bloggers, physicist John Cook over at skepticalscience.com. In his words:

"There are several contributing factors. One is the drop in ozone levels over Antarctica. The hole in the ozone layer above the South Pole has caused cooling in the stratosphere (Gillet 2003). A side-effect is a strengthening of the cyclonic winds that circle the Antarctic continent (Thompson 2002). The wind pushes sea ice around, creating areas of open water known as polynyas. More polynyas leads to increased sea ice production (Turner 2009).

Another contributor is changes in ocean circulation. The Southern Ocean consists of a layer of cold water near the surface and a layer of warmer water below. Water from the warmer layer rises up to the surface, melting sea ice. However, as air temperatures warm, the amount of rain and snowfall also increases. This freshens the surface waters, leading to a surface layer less dense than the saltier, warmer water below. The layers become more stratified and mix less. Less heat is transported upwards from the deeper, warmer layer. Hence less sea ice is melted (Zhang 2007). "


This counter-intuitive result shows how complicated our climate system is. Climate change contrarians are masters at obscuring the truth by taking counter-intuitive climate events like this out of context, and twisting them into a warped but believable non-scientific narrative. Lawmakers tend to hear a lot of these narratives, since the lobbying wings of the oil and gas industry spent $175 million last year to help convince Congress not to regulate their industry. This number does not include the tens of millions more spent by the U.S. Chamber of Commerce, National Association of Manufacturers, coal industry, and other business interests intent upon stymying legislation that might cut into profits of the oil, coal, and gas industry. For comparison, the lobbying money spent by environmental groups in 2009 was approximately $22.5 million. Spending for PR efforts aimed at influencing opinion on climate change issues probably has a similar disparity. This is a major reason why you may have heard, "Hey, Antarctic sea ice is increasing, so why worry about Arctic sea ice loss?"

Commentary
Diminishing the importance of Arctic sea ice loss by calling attention to Antarctic sea ice gain is like telling someone to ignore the fire smoldering in their attic, and instead go appreciate the coolness of the basement, because there is no fire there. Planet Earth's attic is on fire. This fire is almost certain to grow much worse. When the summertime Arctic sea ice starts melting completely a few years or decades hence, the Arctic will warm rapidly, potentially leading to large releases of methane gas stored in permafrost and in undersea "methane ice" deposits. Methane is 20-25 times more potent than CO2 at warming the climate, meaning that the fire in Earth's attic will inexorably spread to the rest of the globe. To deny that the fire exists, or that the fire is natural, or that the fire is too expensive to fight are all falsehoods. This fire requires our immediate and urgent attention. Volunteer efforts to fight the fire by burning less coal, oil, and gas are laudable, but insufficient. It's like trying to fight a 3-alarm blaze with a garden hose. Every time you reduce your use of oil, gas, or coal, you make the price of those fuels cheaper, encouraging someone else to burn them. Global warming will not slow down until Big Government puts a price on oil, coal and gas--a price that starts out low but increases every year. This can be done via emissions trading, a "fee and dividend" approach, or other means. People are rightfully mistrustful of the ability of Big Government to solve problems, but we don't have a choice. The alternative is to geoengineer our climate--an extremely risky solution. It is time to pay the big bucks and send out the fire engines, before the conflagration gets totally out of control. Consider the Great Russian Heat Wave of 2010 and the Pakistani floods of 2010 a warning. These sorts of extreme events will grow far more common in the decades to come, because of human-caused climate change.


Link:  http://www.wunderground.com/blog/JeffMasters/comment.html?entrynum=1589

Friday, August 27, 2010

Northwest and Northeast Passages are now really, really open -- is this now a big snooze or something?

Northwest and Northeast Passages are now really, really open -- is this now a big snooze or something?

h/t to Killian O'Brien
Click on image to enlarge the details. 

Monday, August 2, 2010

Ok, so are we gonna call the Northwest Passage open, or not?

Ok, so are we gonna call the Northwest Passage open, or not?

Sorry, folks, the site where I get these images did not provide any for the last days of July, but now don't you think we can call it open?

Image from August 2, 2010 (click on image to enlarge):

Tuesday, July 13, 2010

Will the Northwest Passage be open in July 2010?

Will the Northwest Passage be open in July 2010?

It is nearly unbelievable, but have a look at this graphic from today, July 13, 2010 (please click on the image to see the details):