Blog Archive

Showing posts with label 2011 temperatures. Show all posts

Tuesday, March 20, 2012

Met Office: World warmed even more in last ten years than previously thought when Arctic data added. 2010 now hottest year

Met Office: World warmed even more in last ten years than previously thought when Arctic data added


The world warmed more in the last ten years than previously thought, according to a new global temperature series updated by the Met Office


The controversial record of climate change, put together by the Met Office Hadley Centre and the University of East Anglia, is one of only a handful of global temperature data sets stretching back since the end of the 19th century.
The temperature series was at the centre of the Climategate scandal in 2009, after hacked emails from the University of East Anglia showed scientist were unwilling to release original data.
Critics claimed that the whole argument for global warming could not be trusted if the data set was questioned.
However a series of inquiries found the science was correct, although the University of East Anglia was criticised for failing to share information.
Now a new analysis of land and sea temperatures, that includes new data from weather stations in the Arctic, has found the world is warming even more than previously thought.
Between 1998 and 2010, temperatures rose by 0.11C, 0.04C more than previously estimated.
The new data set also shifts around the hottest years on record, so that the new temperature series, known as HadCRUT4, is more in line with other global records held by NASA and NOAA in the US. The American series had already added Arctic temperatures from extrapolated information.
Before it was thought the hottest years were 1998 followed by 2010, 2005, 2003 and 2002. The updated series puts 2010 as the hottest year on record followed by 2005, 1998, 2003 and 2006.
The main conclusions of the new temperature series remains the same – that overall warming since 1850 has been around 0.75C and the 10 warmest years on record all occurred in the last 14 years.
All the data that that HadCRUT4 is based on will be publicly available online in the coming days.
Professor Phil Jones, director of CRU, who was at the heart of the Climategate scandal, said the temperature series is slightly warmer because it includes the new data from the Arctic, where the world is warming faster.
Most of the new data came from weather stations controlled by Russian scientists.
"HadCRUT is underpinned by observations and we’ve previously been clear it may not be fully capturing changes in the Arctic because we have had so little data from the area," he said.
"For the latest version we have included observations from more than 400 stations across the Arctic, Russia and Canada. This has led to better representation of what's going on in the large geographical region,” said Prof Jones.
Dr Peter Stott, Head of Climate Monitoring and Attribution at the Met Office, said the new series is "yet another piece of evidence that the world is warming".
“The scientific evidence is really strong that we are warming,” he said.

Friday, January 27, 2012

NASA Video Illustrates 130 Years of Global Warming, Hansen Expects New Global Temperature Record Within 3 Years

NASA Video Illustrates 130 Years of Global Warming, Hansen Expects New Global Temperature Record Within 3 Years


In 1880, when modern global temperature records began, atmospheric carbon dioxide levels were at 285 parts per million. In 2011, they are were over 390 parts per million. That has trapped a lot of extra energy on earth — see “The Radiative Forcing of the CO2 Humans Have Put in the Air Equals 1 Million Hiroshima Bombs a Day.”
As we’ve spewed greenhouse gas emissions into the atmosphere at at a faster pace, global temperatures have accelerated upward, particularly since the 1970s. To illustrate this rise, NASA’s Goddard Institute for Space Studies released this fascinating video of 131 years of temperature records edited into a 30-second video.
“We know the planet is absorbing more energy than it is emitting,” said GISS Director James E. Hansen. “So we are continuing to see a trend toward higher temperatures. Even with the cooling effects of a strong La Niña influence and low solar activity for the past several years, 2011 was one of the 10 warmest years on record.”
Hansen said he expects record-breaking global average temperature in the next two to three years….  “It’s always dangerous to make predictions about El Niño, but it’s safe to say we’ll see one in the next three years,” Hansen said. “It won’t take a very strong El Niño to push temperatures above 2010.”
http://thinkprogress.org/romm/2012/01/27/413227/nasa-video-global-warming/ 

Friday, January 20, 2012

2011: The 9th hottest year on record

2011: The 9th hottest year on record

by Phil Plait, Bad Astronomy blog, Discover Magazine, January 20, 2012
If anyone tells you the Earth isn’t warming up…
… tell them they’re full of it.
2011 was the ninth hottest year on record, and those records go back 130 years.
And then they might say, well, sure, but that could be coincidence. Then you look them straight in the eye, and you say:
Nine of the ten hottest years on record have been since 2000.
The map above shows changes from average (where the average is from 1951 to 1980). You see clearly that temperatures over land have increased almost universally. Most of the ocean temperatures have gone up as well; the one big cooler region in the eastern Pacific is due to the La Niña last year, so it’s a temporary effect. Even with La Niña dropping temperatures, the overall effect is an increase in temperature. I’ll note that sunspot numbers were low last year as well,which (if anything) should result in a (very) slight cooling effect, too.
Climate change deniers will gnash and froth — I expect the comments to this post to reflect that, as they always do — but the bottom line is this. The Earth is getting hotter. Human beings are at least partly to blame, and the evidence has piled up that we are mostly to blame. Not the Sun, not cosmic rays, not orbital oscillations. Humans.
As I’ve said before, here are the facts:
The Earth is warming up. The rate of warming has increased in the past century or so. This corresponds to the time of the Industrial Revolution, when we started dumping greenhouse gases into the atmosphere. Greenhouse gases warm the planet (hence the name) — if they didn’t we’d have an average temperature below the freezing point of water. Carbon dioxide is a greenhouse gas which is dumped into the atmosphere by humans to the tune of 30 billion tons per year, 100 times the amount from volcanoes. And finally, approximately 97% of climatologists who actually study climate agree that global warming is real, and caused by humans.
Given the vast amount of evidence supporting all this, denying it is fantasy. Again, that won’t stop deniers: they will obfuscate, blow smoke, and nitpick details to make them seem important. But what they’re doing is fiddling while Earth burns.

Thursday, January 19, 2012

Global Temperature in 2011, Trends, and Prospects by James Hansen, Reto Ruedy, Makiko Sato and Ken Lo

Global Temperature in 2011, Trends, and Prospects

http://www.columbia.edu/~jeh1/mailings/2012/20120119_Temperature.pdf 

This may be my final e-mail.  Last year, in a moment of temporary insanity, I agreed to participate in Chesapeake Climate Action Network's annual polar bear plunge this Saturday.  One of my sisters claims that a padded wagon is on the way.  If I catch pneumonia Anniek may shoot me.  If you want to join the fun (it can't really be all that bad, and it's for a good organization), info can be found by clicking here


~Jim

Excerpt:  


Oklahoma-Texas-Northern Mexico in 2011 and the Moscow region in 2010 provide examples of summer heat anomalies that exceeded 3σ relative to the 1951-1980 climatology.  In the 1951-1980 period of climatology the area with temperature anomaly exceeding +3σ was only a few 
tenths of one percent.  However, the area covered by such extreme anomalies has increased with global warming.  +3σ anomalies covered 7% of the area with observations in Jun-Jul-Aug 2009, 13% in 2010, and 9% in 2011 (Hansen et al., 2012).  Increased occurrence of such extreme anomalies as a result of global warming, by more than a factor of 10, implies that we can attribute such recent extreme anomalies, including that in Texas and Oklahoma, to global warming.

Friday, January 13, 2012

Jeff Masters: Extreme temperatures of 2011: 7 national all-time heat records; 1 cold record


The year 2011 was the tenth warmest year on record for the globe, but the warmest year on record when a La Niña event was present (Ricky Rood has a discussion of this in his lastest post). Seven nations and one territory broke all-time hottest temperature records. This is a far cry from 2010 (which tied for the warmest year on record), when twenty nations (plus one UK territory) set all-time hottest temperature records. One all-time coldest temperature record was set in 2011; this was the first time since 2009 one of these records was set. The all-time cold record occurred in Zambia, which ironically also set an all-time hottest temperature record in 2011. Here, then, are the most most notable extreme temperatures globally in 2011, courtesy of weather records researcher Maximiliano Herrera:

Hottest temperature in the world in 2011: 53.3 °C (127.9 °F) in Mitrabah, Kuwait, August 3


Coldest temperature in the world in 2011: -80.2 °C (-112.4 °F) at Dome Fuji, Antarctica, September 18


Hottest temperature in the Southern Hemisphere: 49.4 °C (120.9 °F) at Roebourne, Australia, on December 21


Coldest temperature in the Northern Hemisphere: -67.2 °C (-89 °F) at Summit, Greenland, March 18. This is also the coldest March temperature ever recorded in the Northern Hemisphere.


Hottest undisputed 24-hour minimum temperature in world history: A minimum temperature of 41.7 °C (107 °F) measured at Khasab Airport in Oman on June 27


Figure 1. Seven countries and one territory set all-time hottest temperature records in 2011, and one nation set an all-time coldest temperature record. Image credit: Ilissa Ocko, Princeton University.

New country hottest temperature records set in 2011
Iraq recorded its hottest temperature on record on August 3, 2011, in Tallil (Ali military airbase), when the mercury hit 53 °C (127.4 °F). The previous record was 52.3 °C recorded at Diwanya FOB airbase a few days before.

Armenia recorded its hottest temperature on record on July 31 in Meghri, when the mercury hit 43.7 °C (110.7 °F). The previous record was 43.1 °C in Meghri on July 17, 2005.

Iran recorded its hottest temperature in its history on July 28, 2011, when the mercury hit 53 °C (127.4 °F) at Dehloran. The previous previous record was set just one day earlier at Omidieh and Shoshtar, when the mercury hit 52.6 °C (126.6 °F). Older hotter temperatures have been measured in Iran using automated stations, but these temperatures have been found to be overestimated.

Kuwait recorded its hottest temperature on record on August 3, 2011, when the mercury hit 53.3 °C (127.9 °F) at Mitrabah. The previous record was 53.1 °C in Sulaibiya on June 15, 2010. The Kuwait Meteorological Center confirmed the reading as authentic, though the temperature sensor had problems between 2009 and July 2010. Some temperatures as high as 53.5 °C measured at the Kuwait City Airport during 2011 were in error. The 53.3 °C (127.9 °F) at Mitrabah thus represents:

1) The hottest temperature measured on Earth in 2011
2) New official national record for Kuwait
3) Second highest (undisputed) temperature ever recorded in Asia
4) Highest temperature ever recorded in an Arabic country
5) Third hottest location in the planet together with Lake Havasu City, AZ (after Death
Valley, CA, and Moenjodaro, Pakistan)
6) A new world record for August

China broke its national heat record for both uninhabited and inhabited locations on July 14, 2011, when the temperature soared to 50.2 °C (122.4 °F) at a automatic station near Adyngkol Lake (just south of Turfan), and 49.4 °C (120.9 °F) at the town of Tuyoq. A higher reading of 50.7 °C at Aydingkol Mirabilite on 23 July 1986 has not been verified as official by the Chinese.

Republic of the Congo set a new all-time extreme heat record on March 8, 2011, when the temperature hit 39.2 °C (102.6 °F) at M'Pouya. Congo's previous all-time hottest temperature was 39. 0 °C (102.2 °F) at Impfondo on May 14, 2005.

Zambia set an all-time national heat record of 109.0 °F (42.8 °C) at Mfuwe, on October 26, 2011, breaking the previous national record of 108.1 °F (42.3 °C) also set at Mfuwe, on November 17, 2010. A no longer functioning station at Lusitu, Zambia, measured a higher temperature in November 1990, but surrounding stations were all about 10 °C cooler, so the Lusitu 1990 reading is considered unreliable.

The French Southern and Antarctic Lands Territory tied its all-time hottest temperature record when Europa Island recorded 35.6 °C (96.1 °F) on November 12, 2011. The previous record was set at Juan de Nova Island on March 31, 1997.

New country coldest temperature records set in 2011 
For the first time since 2009, a new national extreme cold temperature record was set. Zambia set an all-time national cold record of -9 °C (16 °F) at Choma on June 27, 2011, breaking the previous national record of -8 °C (18 °F), set on July 10, 1898, at Nalisa Western Province.

Special mention: 
Russia had its hottest temperature on record at a regular synoptic reporting staion on July 30, 2011, when the mercury hit 44.3 °C (111.7 °F) at Divnoe in Russia's Kalmykia Republic. Three hotter temperatures have been recorded at automated stations: 45.4 °C in 2010 at a hydrological station at Utta, plus readings of 45 °C at El'ton and 44.5 °C at Verhjnky Baskunkak in August 1940.

Weather records researcher Maximiliano Herrera is the primary source of the weather records listed here and has worked tremendously hard to research them. He maintains a comprehensive list of extreme temperature records for every nation in the world on his website. If you reproduce this list of extremes, please cite Maximiliano Herrera as the primary source of the weather records.

Other posts looking back at the remarkable weather events of 2011
U.S. weather in 2011: unprecedented rains and wet/dry extremes
Top ten global weather events of 2011
2011: Year of the Tornado
Deadliest weather disaster of 2011: the East African drought
Tropical Storm Lee's flood in Binghamton: was global warming the final straw?
Wettest year on record in Philadelphia; 2011 sets record for wet/dry extremes in U.S.
Hurricane Irene: New York City dodges a potential storm surge mega-disaster


Figure 2. Portlight volunteers help distribute bottled water in the aftermath of Hurricane Irene in Raleigh, North Carolina.

Weather Underground renews as National Sponsor of Portlight Disaster Relief
This week, wunderground put out a press release in concert with Portlight Strategies, Inc. -- a national grassroots non-profit organization -- that Weather Underground, Inc., will again be a National Sponsor of Portlight Disaster Relief.

Hundreds of members of the wunderground.com blog community have teamed with Portlight Strategies, Inc., throughout the last three and a half years to provide much needed relief services and supplies to victims and survivors of several natural disasters, both domestically and internationally.

These relief efforts focused on helping people with disabilities, as well as people in small towns and rural areas often marginalized by the larger institutional relief infrastructure.

Portlight Strategies, Inc., has committed to building on the stunning success of this collaborative, grassroots initiative.

"Weather Underground stepping up to be one of our National Sponsors again in 2012 is a huge honor," said Paul Timmons, Jr., Portlight Strategies, Inc., Board Chair.

"We are very pleased to continue our support of Portlight Strategies because they make a real difference to otherwise neglected communities that are affected by weather-related disasters around the globe," added Alan Steremberg, President and co-founder of Weather Underground.

Visit the Portlight blog on wunderground to learn more. Donations are always welcome.


http://www.wunderground.com/blog/JeffMasters/comment.html?entrynum=2013

Tom Smerling: 2011′s wettest and driest, in technicolor

2011′s wettest and driest, in technicolor

 
As the earth warms,  “the wet get wetter and the dry get drier.”
Over half the country suffered either drought (orange) or deluge (blue/fuschia) in 2011. 
Dr. Jeff Masters’ WunderBlog (12/12/11) summed it up:
“The combined fraction of the country experiencing either severe drought or extremely wet conditions was 56% averaged over the January-November period–the highest in a century of record keeping.
Map courtesy of NOAA, via Jeff Masters and Heidi Cullen. (Climate communicators: Note how the artful use of color draws the viewer in and makes the key information — areas of drought or deluge — jump out.)
And the climate take-away?
“Climate change science predicts that if the Earth continues to warm as expected,wet areas will tend to get wetter, and dry areas will tend to get drier–so this year’s side-by-side extremes of very wet and very dry conditions should grow increasingly common in the coming decades.”
In a warming world, earth’s water cycle speeds up (see “Drought & deluge: It’s the Water, Stupid!“). Drought devastates agriculture; just ask Texas cattle ranchers.
After fast evaporation parches the South, prevailing winds blow the moisture-laden air northeastward. The result for Northeastern states: “When it rains, it pours.
Masters cites 2011 as “the wettest year in nearly 200 years of record keeping in Philadelphia, Pennsylvania.” Philadelphia wasn’t alone. Weather.com adds that “at least 20 locations from the Ohio Valley to New England have set a new record wet year.” Their report includes interactive maps of towns that set new records for wet or dry conditions.
Masters summed it up this way: “If you weren’t washing away in a flood, you were baking in a drought in 2011.”
Was 2011 a “sneak preview” of our climate future?
Update 1/11/11: Vive la difference! For contrast, consider this more traditional map, also from NOAA (NESDIS). It also uses color. But which one catches your eye and makes you want to dive in and swim around?

Sunday, January 8, 2012

South Pole Records Warmest Temperature on Record, December 25, 2011

South Pole Records Warmest Temperature on Record

by Christopher C. Burt, weather historian, wunderground.com, December 27, 2011


On Christmas Day, December 25th, 2011, the temperature at the Amundsen-Scott South Pole site soared to an all-time record high of 9.9 °F (-12.3 °C) at 3:50 p.m. local time, eclipsing the former record of 7.5 °F (-13.6 °C) set on December 27, 1978. The low temperature on December 25th was a mild (relatively!) 0 °F (-17.8 °C). Records at the site began in January 1957. Its elevation is 9,301 feet (2,835 meters).

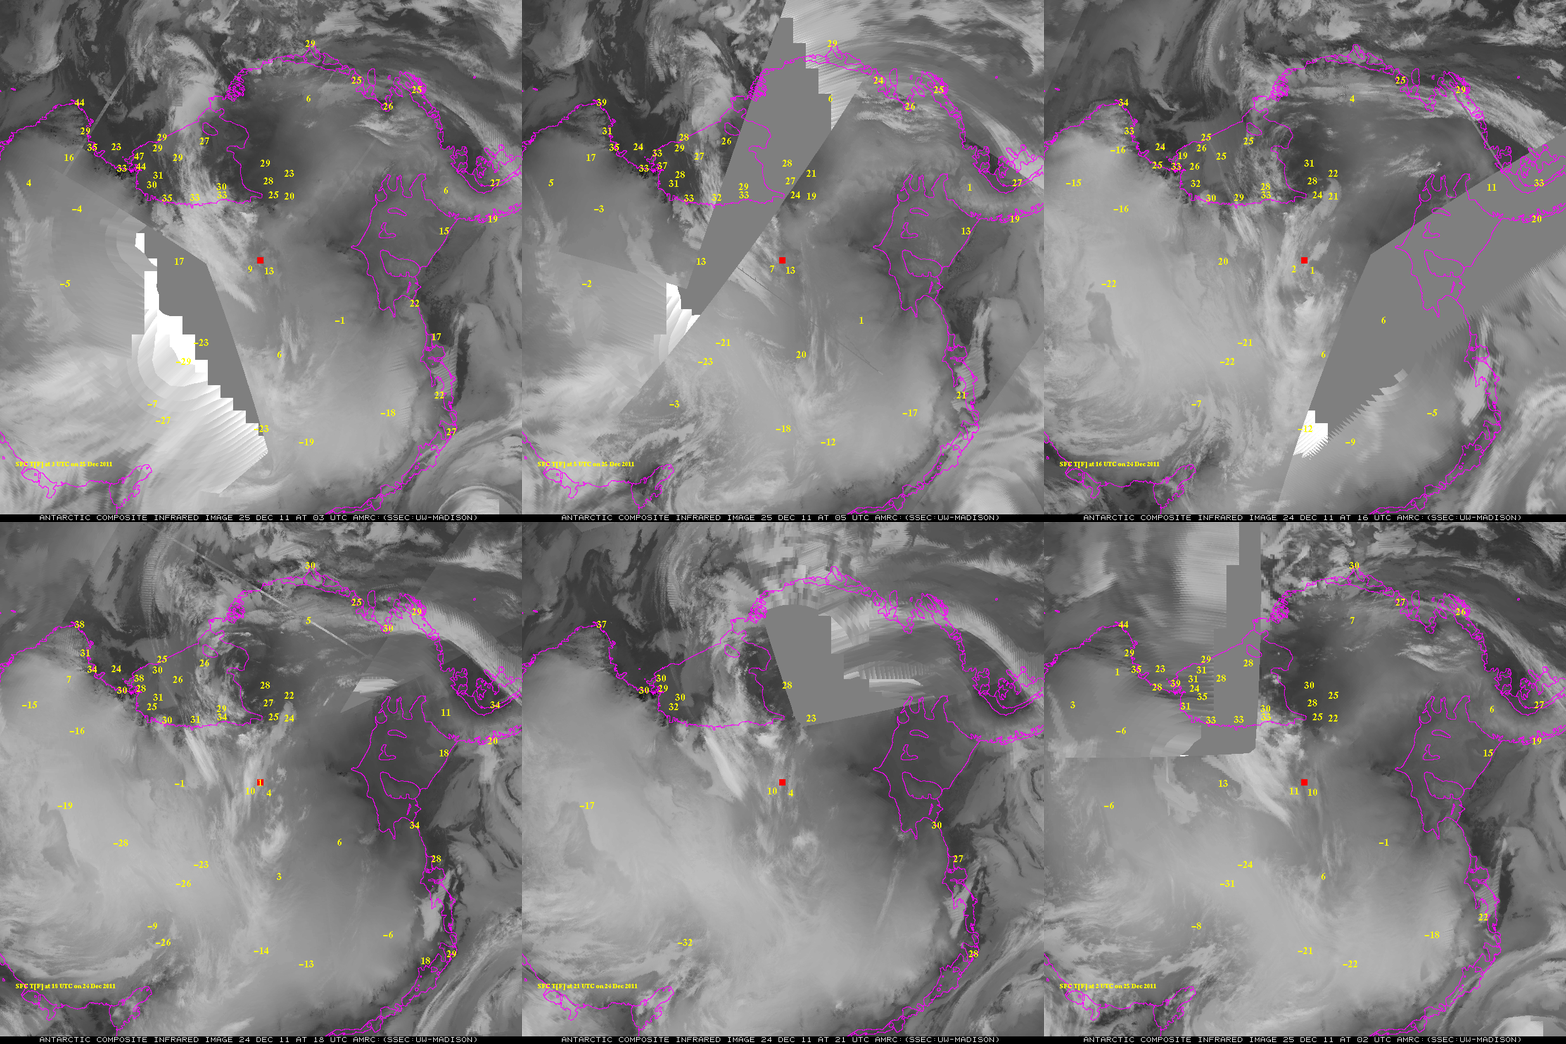
This infrared satellite animation [see end of this postshows how a tongue of relatively warm air intruded inland over the Antarctic continent to the South Pole (identified by the red square). Temperatures in degrees Fahrenheit are displayed for the time period of the animation (from December 24th through December 25th). Two other AWS sites near the South Pole (100 kilometers to the north—along the prime meridian-and east of the pole) also broke their all-time heat records with Nico and Henry AWS sites reporting 17.2 °F (-8.2 °C) and 16.0 °F (-8.9 °C) respectively.

The normal high temperature for December at the South Pole is -15.7 °F (-26.5 °C).


Table of annual average and extreme temperatures for the Amundsen-Scott South Pole site. Table graphic from Wikipedia.

The coldest temperature on record for the South Pole site is -117.0 °F (-82.8 °C) set on June 23, 1982. The pole is one of the driest places on earth with an estimated total annual precipitation of just 0.20” (4.5 mm) although blowing snow contributes to about an 8-inch snow accumulation each year.


An old, but beautiful, photograph of the South Pole station. The dome pictured here was dismantled in 2010. Photo by Galen Rowell. Galen was one of the greatest nature photographers ever (and a dear friend of mine), he died in a plane crash, along with his wife Barbara, in Bishop, California, in 2002. His book 'Poles Apart: Parallel Visions of the Arctic and Antarctic' (Univ. of California Press, 1995) is a must view for those interested in the 'top and bottom' of our planet. This photo was taken back in the early 1990s.

The month of December has been average temperature-wise so far, in spite of the recent record warmth. This is because the first half of the month was colder than the normal -18 °F (-27.8 °C) daily mean. The low for the month was -29 °F (-33.9 °C) on December 10th and 13th.


Graphics for temperature and wind at the Amundsen-Scott South Pole site during this month of December. From wunderground.com (temperatures based on METARS so they may not illustrate the actual daily minimums and maximums).

Antarctica’s all-time continental temperature extremes range from a low (world record) of -128.6 °F (-89.2 °C) at the Russian Vostok Station on July 21, 1983, to 59.0 °F (15.0 °C) at Vanda Station on January 5, 1974. Warmer temperatures have been measured on islands that are technically part of Antarctica but, of course, not part of the mainland. The warmest being 67.6 °F (19.8 °C) at the United Kingdom base on Signy Island, South Orkney, on January 30, 1982.

REF: See for more details on the event.


http://www.wunderground.com/blog/weatherhistorian/comment.html?entrynum=55


Satellite animation with temperatures…

This animation has preliminary reports of temperatures from the Antarctic Automatic Weather Station  (AWS) (and other staffed stations) before, during and after the record set at South Pole (marked in red) and nearby AWS sites.
This animation has preliminary reports of temperatures from the Antarctic Automatic Weather Station (AWS) (and other staffed stations) before, during and after the record set at South Pole (marked in red) and nearby AWS sites.
http://amrc.ssec.wisc.edu/blog/2011/12/28/preliminary-report-record-temperatures-at-south-pole-and-nearby-aws-sites/record-temp/