Blog Archive

Showing posts with label Insurers. Show all posts

Monday, January 22, 2018

Lenders' Guide for Considering Climate Risk in Infrastructure Investments, January 2018

AcclimatiseClimate Finance Advisors (CFA), and Four Twenty Seven have released a new guidance document to increase the climate resilience of large infrastructure investments. The “Lenders’ Guide for Considering Climate Risk in Infrastructure Investments” clearly breaks down the ways in which physical climate risks might affect key financial aspects of prospective infrastructure investments. 

This guide provides a framework for questioning how revenues, costs, and assets can be linked to potential project vulnerability arising from climate hazards and draws attention to the potential opportunities emerging from resilience-oriented investments in infrastructure.

Ten sub-sectors, including airports, marine ports, gas and oil transport and storage, power transmission and distribution, wind-based power generation, data centers, telecommunications, commercial real estate, healthcare, and sports and entertainment, are analysed and illustrated with topical examples.

To learn more about this document, please visit our website and download the publication here.

Download the guide at this link:

http://www.acclimatise.uk.com/wp-content/uploads/2018/01/Lenders_Guide_for_Considering_Climate_Risk_in_Infrastructure_Investments.pdf

Wednesday, January 17, 2018

2017’s costly climate change-fueled disasters are the ‘new normal,’ warns major reinsurer Munich Re

“We have a new normal” thanks to climate change, explains leading reinsurer.


by Joe Romm, Climate Progress, January 4, 2018


Hurricane Harvey Impacts. CREDIT: Getty Images
HURRICANE HARVEY IMPACTS. CREDIT: GETTY IMAGES


It turns out 2017 was a uniquely disastrous year in more ways than one, evidenced by German reinsurer Munich Re’s recently released review of the year’s global catastrophes.
Led by massive, climate change-fueled hurricanes Harvey, Irma, and Maria, 2017’s natural disasters will cost insurers a record $135 billion. Adding in uninsured losses brings the total global damages to $330 billion, which is second only to 2011.
“We have a new normal,” Munich Re’s Ernst Rauch told Reuters. Rauch, who runs the group tracking climate change risks, pointed out that “2017 was not an outlier” in having more than $100 billion in insured losses (see chart below). “We must have on our radar the trend of new magnitudes,” Rauch said.
The big reinsurers like Munich Re make their money by insuring the companies that directly insure your property. Those smaller companies are often required by law to buy reinsurance because they lack the capital resources to pay out if there is a major disaster, like superstorm Harvey for instance.
Since the reinsurers must pay out billions and billions of dollars for such mega-disasters, they have a unique incentive to understand and predict trends in mega-disasters. That’s why companies like Munich Re and Swiss Re have been at the forefront of warning businesses and the public about the rise in extreme weather events due to climate change.
Indeed, back in September 2010, another year of stunning warming-driven extreme weather events, Munich Re issued a release noting it had analyzed its catastrophe database, “the most comprehensive of its kind in the world,” and concluded, “the only plausible explanation for the rise in weather-related catastrophes is climate change.” 
Then in October 2012, the company released a massive 274-page report, “Severe weather in North America,” analyzing weather catastrophes and related losses since 1980 to understand trends and their causes, including man-made climate change.
Munich Re found that the number of weather-related loss disasters has been rising much faster in North America than anywhere else, and concluded, “Climate-driven changes are already evident over the last few decades for severe thunderstorms, for heavy precipitation and flash flooding, for hurricane activity, and for heatwave, drought and wild­fire dynamics in parts of North America.”
Prof. Peter Höppe, who heads Munich Re’s Geo Risks Research unit, said at the time, “In all likelihood, we have to regard this finding as an initial climate-change footprint in our U.S. loss data from the last four decades.”
And last April, Munich Re published an article on “rapid attribution,” which explained that we can now rapidly determine how much intensity or frequency of some extreme weather events is affected by man-made climate change. Learning that, for instance, climate change has sharply increased the chances of individual extreme rain and flooding events – such as devastating August 2016 deluge and flooding of Baton Rouge, Louisiana – allows communities to do better planning and Munich Re to do better risk management.
The latest annual report amplifies the message that humans are changing the climate, boosting the intensity and frequency of extreme weather events, and that the longer we dawdle, the higher the costs we will incur. The only question is, is anyone listening?

Thursday, January 4, 2018

Climate risk: going mainstream

The governor of the Bank of England and ExxonMobil shareholders are just some of those changing the narrative on climate risk, says Dylan Tanner
Once climate change becomes a defining issue for financial stability, it may already be too late
by Dylan Tanner, The Actuary, September 7, 2017
In June this year, the Financial Stability Board’s (FSB’s)Task Force on Climate-related Financial Disclosures (TCFD) published its recommendations on how the corporate sector should disclose climate risk to investors. The FSB apparently regards climate change as a systemic financial risk, as articulated in a speech by the governor of the Bank of England, Mark Carney, in 2015. Meanwhile, at ExxonMobil’s annual general meeting in May this year, a majority of shareholders demanded that the oil and gas giant discloses its thinking on climate risk more clearly.
Data, analysis and advice on climate risk to portfolios have been around and available to investors for at least 20 years. By the late 1990s, the UN Environment Program (UNEP) Financial Initiative was messaging regularly on the risk of climate-change-induced weather events to the insurance sector and hence the wider markets.
In 2000, the investor-enabled Climate Disclosure Project (CDP) began collecting and aggregating carbon emissions information from thousands of companies around the globe. Financial data sets such as MSCI, Thomson Reuters Eikon and Bloomberg create and sell climate-related metrics on companies as part of their environment, social and governance (ESG) offering.
These observations beg two questions. Is climate risk now going mainstream in portfolio assessment? If so, what has changed? 
The answer to the first question is almost certainly yes, given the mainstream remit of the FSB and the universal nature of ExxonMobil’s shareholder base. The answer to the second is more complex. A key reason that climate risk analysis has not been widely accepted by financial analysts until now is that the messengers have largely come from the climate change and sustainability communities. The UNEP’s remit is to solve environmental issues, not advise on financial risk. Data sets such as CDP and the ESG metrics are regarded as originating in the sustainability agenda, and are used by investors mostly to satisfy sustainable investment commitments rather than inform mainstream risk strategy.
A more significant reason is captured by Carney in his 2015 ‘Tragedy of the Horizons’ speech, where he notes the disconnect between time horizons for current financial risk assessment and manifestation of the effects of climate change.

Predictions come to pass

Two decades have passed since the CDP and UNEP initiatives began, and some of the early indicators of these risks are now appearing. One of these relates to the fossil-fuel production sector, where groups such as the Carbon Tracker Initiative have predicted that a variety of climate-induced pressures could threaten the value of the reserves of oil, gas and coal on balance sheets. In November 2016, Shell shocked the market by estimating that oil demand could peak in as little as 5 years, “driven by efficiency and substitution,” according to then chief financial officer Simon Henry.
A 2016 report from think tank InfluenceMap showed the disparity between the predictions of global electric vehicle (EV) proliferation by the oil companies and those of the automakers and regulators. Toyota predicts 100% EVs and hybrids by 2050 in its sales. France pledges to ban petroleum-powered cars by 2040, and India has a goal of selling only EVs by 2030. Yet, the report notes, ExxonMobil forecasts that EVs will account for “less than 10% of new-car sales globally in 2040.” For a company that probably derives more than 30% of its revenues from petroleum-related transport, this disconnect is a concern. Shareholders are correct to demand further disclosure on the climate risk scenarios it is working with.
Other sectors on investors’ radar when it comes to climate risk and its disclosure include utilities. Reputational, financial and regulatory pressure on the use of coal for power generation is growing, while incentives for the scale-up of renewables is similarly accelerating. Bloomberg New Energy Finance estimates new power generation capacity will be mostly solar and wind by 2040, leaving gas, and especially coal generation and related value chains, as niche businesses. The power sector is one with long-term horizons and multi-decade plant life cycles, so understanding management strategy on future scenarios is essential for investors.

Funds flex their muscle

Pension funds are an important part of the global financial system, with the top 6,000 funds holding around $26trn (£20trn) of capital market assets. They have the ability to create market trends, and account for a significant portion of revenue generated by the financial sector as a whole. 
One of the largest such funds is Norway’s Government Pension Fund Global, with close to $1trn in assets. It adopted criteria in late 2015, allowing it to “exclude companies whose conduct to an unacceptable degree entails greenhouse gas emissions.” In June this year, the smaller but still substantial AP7 pension fund of Sweden announced it was divesting from ExxonMobil and five other companies for violation of the Paris climate agreement. Many other such funds may follow this trend. Such divestment and exclusion actions may be the last resort in an engagement chain, or intended as a signal on acceptable corporate governance. In the case of the Norwegian fund, its managers have a direct remit from the country’s parliament to consider global climate change risk in its management.

Change in data needs

While climate risk is now mainstream, the data needs of the investment community have shifted. For one thing, they are now highly sector-specific. Certain industries, such as energy and power generation and energy-intensive sectors like cement, are the focus, and investors want to understand management thinking on climate issues. To this end, the FSB recommendations stress disclosure by companies on the “resilience of an organisation’s strategy under climate-related scenarios, including a 2 °C or lower scenario” and the regulatory, market, technology and other changes these will bring.
Crucially, the FSB also extends its recommendations to the financial sector, and urges asset owners to test the resilience of the portfolio under the same scenarios. This approach necessitates a focus on forward-looking corporate behavioural metrics and analysis, as well as the carbon emissions accounting approach. For example, investors need to understand the capital asset allocation strategy of an electricity utility, and how this relates to regulatory trends. Likewise, they need to understand whether an oil/gas company’s business model is based on expecting to continue to be able to suppress climate-motivated regulations, and likely scenarios should the political climate shift suddenly.

Mainstream methods apply

Disclosures in line with the TCFD’s recommendations do not feed into any legally binding financial disclosure processes, such as those of the U.S. Securities And Exchange Commission. As a result, achieving universal participation – especially by the most at-risk companies –remains a challenge. 
The TCFD and other disclosure systems aside, mainstream analysis of corporations by investors involves reliance on other sources of information, such as discussions with senior management and third-party investigations.
In the climate risk context, this process will spur the financial research and data sectors to acquire expertise, and perhaps to form unusual alliances with climate specialists in the NGO, academic and technology sectors, to better understand the nuances of portfolio, sector and company risk.

Dylan Tanner is executive director at InfluenceMap

Sunday, December 3, 2017

Moody's: Climate change is forecast to heighten US exposure to economic loss placing short- and long-term credit pressure on US states and local governments

Climate change is forecast to heighten US exposure to economic loss placing short- and long-term credit pressure on US states and local governments

Moody's, Global Credit Research, November 28, 2017

New York -- The growing effects of climate change, including climbing global temperatures, and rising sea levels, are forecast to have an increasing economic impact on US state and local issuers. This will be a growing negative credit factor for issuers without sufficient adaptation and mitigation strategies, Moody's Investors Service says in a new report.

The report differentiates between climate trends, which are a longer-term shift in the climate over several decades, versus climate shock, defined as extreme weather events like natural disasters, floods, and droughts which are exacerbated by climate trends. Our credit analysis considers the effects of climate change when we believe a meaningful credit impact is highly likely to occur and not be mitigated by issuer actions, even if this is a number of years in the future.

Climate shocks or extreme weather events have sharp, immediate and observable impacts on an issuer's infrastructure, economy and revenue base, and environment. As such, we factor these impacts into our analysis of an issuer's economy, fiscal position and capital infrastructure, as well as management's ability to marshal resources and implement strategies to drive recovery.

Extreme weather patterns exacerbated by changing climate trends include higher rates of coastal storm damage, more frequent droughts, and severe heat waves. These events can also cause economic challenges like smaller crop yields, infrastructure damage, higher energy demands, and escalated recovery costs.

"While we anticipate states and municipalities will adopt mitigation strategies for these events, costs to employ them could also become an ongoing credit challenge," Michael Wertz (a Moody's Vice President) says. 

"Our analysis of economic strength and diversity, access to liquidity and levers to raise additional revenue are also key to our assessment of climate risks as is evaluating asset management and governance."

One example of climate shock driving rating change was when Hurricane Katrina struck the City of New Orleans (A3 stable). In addition to widespread infrastructure damage, the city's revenue declined significantly and a large percentage of its population permanently left New Orleans.

"US issuer resilience to extreme climate events is enhanced by a variety of local, state and federal tools to improve immediate response and long-term recovery from climate shocks," Wertz says.

For issuers, the availability of state and federal resources is an important element that broadens the response capabilities of local governments and their ability to mitigate credit impacts. As well, all municipalities can benefit from the deployment of broader state and federal aid, particularly disaster aid from the Federal Emergency Management Agency (FEMA) to help with economic recovery.

Moody's analysts weigh the impact of climate risks with states and municipalities' preparedness and planning for these changes when we are analyzing credit ratings. Analysts for municipal issuers with higher exposure to climate risks will also focus on current and future mitigation steps and how these steps will impact the issuer's overall profile when assigning ratings.

The report "Environmental Risks -- Evaluating the impact of climate change on US state and local issuers," is available to Moody's subscribers at:
http://www.moodys.com/researchdocumentcontentpage.aspx?docid=PBM_1071949.

******************************************************************
NOTE TO JOURNALISTS ONLY: For more information, please call one of our global press information hotlines: 
New York +1-212-553-0376
London +44-20-7772-5456 
Tokyo +813-5408-4110
Hong Kong +852-3758-1350 
Sydney +61-2-9270-8141
Mexico City 001-888-779-5833 
São Paulo 0800-891-2518
Buenos Aires 0800-666-3506 

You can also email us at mediarelations@moodys.com or visit our web site at www.moodys.com.

This publication does not announce a credit rating action. For any credit ratings referenced in this publication, please see the ratings tab on the issuer/entity page on www.moodys.com for the most updated credit rating action information and rating history.

Kenneth Kurtz, Senior Vice President, Public Finance Group
Moody's Investors Service, Inc.
One Front Street, Suite 1900
San Francisco, CA 94111
3-1653

Michael Wertz, Vice President - Senior Analyst, Public Finance Group

JOURNALISTS: 1 (212) 553-0376
Client Service: 1 (212) 553-1653


Releasing Office:
Moody's Investors Service, Inc.
250 Greenwich Street
New York, NY 10007
3-1653

https://www.moodys.com/research/Moodys-Climate-change-is-forecast-to-heighten-US-exposure-to--PR_376056

Friday, June 2, 2017

Joe Romm: Trump falsely claims Paris deal has a minimal impact on warming; It may be time to sell your coastal property


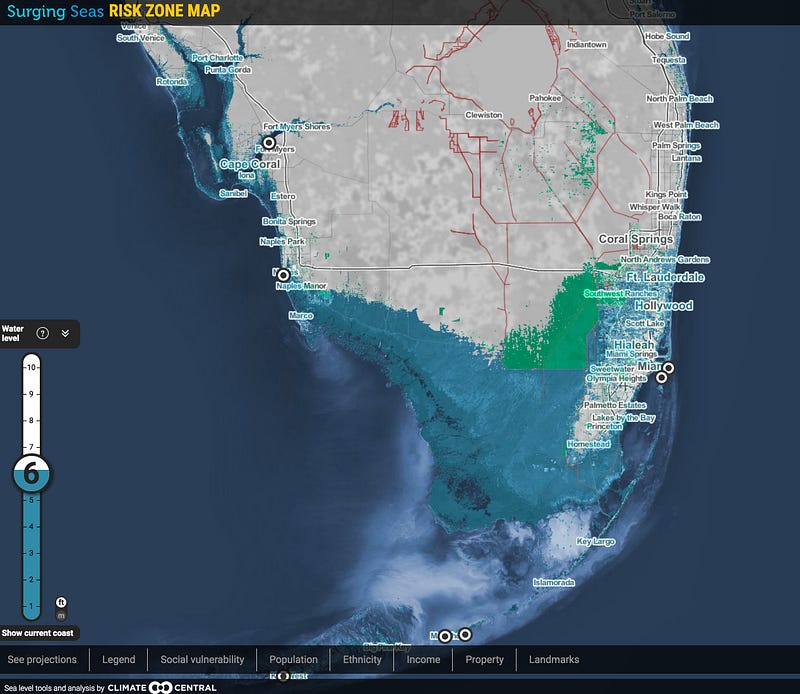
By exiting the Paris climate deal, President Donald Trump has made this future for South Florida and “Miami Island” all but unstoppable. CREDIT: Climate Central.

by Joe Romm, Climate Progress, June 1, 2017

President Donald Trump announced Thursday that the United States will withdraw from the Paris climate accord. In doing so, he has made the worst-case impacts of climate change on America vastly more likely.
In a speech from the White House Rose Garden filled with thorny lies and misleading statements, one pricks the most: Trump claimed that the Paris climate deal would only reduce future warming in 2100 by a mere 0.2 °C. White House talking points further assert that “according to researchers at MIT, if all member nations met their obligations, the impact on the climate would be negligible… less than 0.2 degrees Celsius in 2100.”
The Director of MIT’s System Dynamics Group, John Sterman, and his partner at Climate Interactive, Andrew Jones, quickly emailed ThinkProgress to explain, “We are not these researchers and this is not our finding.”
They point out that “our business as usual, reference scenario leads to expected warming by 2100 of 4.2 °C. Full implementation of current Paris pledges plus all announced mid-century strategies would reduce expected warming by 2100 to 3.3 °C, a difference of 0.9 °C [1.6 °F].”
The 0.2 °C estimate used by Trump may be from another MIT group; the Joint Program on the Science and Policy of Global Change did have such an estimate in early 2015, before all of the Paris pledges were in. But, their post-Paris 2016 analysis also concluded the impact of the full pledges was closer to 1 °C.
In their analysis, Sterman and Jones “take all nations at their word that they will fully meet their national commitments. If nations increase their ambition and set future pledges, as is outlined in the agreement, then the positive impact would be even larger.”
This point is key. The Paris commitments not only help the globe avoid the worst-case scenario for total warming and related climate impacts, they keep the best-case scenario open. Indeed, the Paris pledges buy us another decade close to the 2 °C (3.6 °F) path.
Keeping the option of beating the 2 °C target — which is widely seen by scientists as the point at which climate impacts start to become dangerously unmanageable by humans — is a key objective of the Paris deal.
Earth has already warmed 1 °C from carbon pollution, and the latest science says the globe is already approaching many tipping points. Among the most imminent and consequential for America and the world involves sea level rise.
The disintegration of the Greenland and Antarctic ice sheets is speeding up, providing more evidence we are headed for the worst-case scenario of sea level rise — three to six feet (or more) by 2100 — unless total warming is limited to “well below 2 °C,” as Paris envisions.
And Trump is not merely working to thwart both domestic and global climate action, he slashes funding for coastal adaptation in his latest budget.
But this is not just South Florida’s problem. The entire country is facing a trillion-dollar bubble in coastal property values.
So when will the bubble burst? In short, when sellers outnumber buyers, and banks become reluctant to write 30-year mortgages for doomed property, and insurance rates soar, then the coastal property bubble will slow, peak, and crash. The process speeds up when a large fraction of the financial community — mortgage bankers and opinion-makers, along with a smaller but substantial fraction of the public — realize that it is too late to stop catastrophic sea level rise.
With Trump withdrawing the U.S. from the Paris agreement, that moment would appear to be at hand, which leaves one final question: Who will be the smart money that sells their coastal property early — and who will be the other kind of money?

Sunday, April 2, 2017

Climate Code Red: Climate change pushing floods, cyclones to new extremes, with worse to come

by David Spratt, Climate Code Red, April 1, 2017


With Australia experiencing the aftermath of Cyclone Debbie and record-breaking rains and severe flooding in southeast Queensland and along the north coast of New South Wales, here’s a look at how global warming has, and will, push floods and cyclones to new extremes.

Flooding extremes

Warm air can be more humid than cold air, that is, it can hold more water vapour in absolute terms. And atmospheric water vapour content increases 7% for each 1-degree-Celsius increase in global average temperature, establishing the conditions for more intense rainfall events. 

Flash floods are likely to sweep across the Australian landscape with increasing intensity, particularly in urban or residential areas. Peak rainfall is predicted to soar with rising surface temperatures as Australia experiences ever greater extremes of heat.  

The frequency of major flood events (defined as events which caused extensive flooding within 50 kilometres of the coast, or inundation that extended 20 kilometres along the coast) along Australia's eastern seaboard has doubled in last 150 years, with climate change one of the possible factors, senior Bureau of Meteorology researchers say. 

Record-breaking heavy rainfall and a clear upward trend in downpours over the last 30 years fits in with global temperature rise caused by greenhouse gases. Statistical analysis of rainfall data from 1901 to 2010 around the globe, shows that from 1980 to 2010 there were 12% more of these intense events than would be expected in a climate without global warming. Wet regions generally saw a bigger increase in deluges and drier regions a smaller one. In southeast Asia, the observed increase in record-breaking rainfall events is as high as 56%.

Giant air streams pushing new extremes: The increase of devastating weather extremes in summer, including floods, is likely linked to human-made climate change, mounting evidence shows, with the recent discovery of giant airstreams circling the Earth, waving up and down between the Arctic and the tropics. These planetary waves transport heat and moisture. When these planetary waves stall, droughts or floods can occur. Warming caused by greenhouse-gases from fossil fuels creates favourable conditions for such events.

 “The unprecedented 2016 California drought, the 2011 U.S. heatwave and 2010 Pakistan flood, as well as the 2003 European hot spell, all belong to a most worrying series of extremes,” says Michael Mann, a lead author of the study. “The increased incidence of these events exceeds what we would expect from the direct effects of global warming alone, so there must be an additional climate change effect. In data from computer simulations as well as observations, we identify changes that favour unusually persistent, extreme meanders of the jet stream that support such extreme weather events. Human activity has been suspected of contributing to this pattern before, but now we uncover a clear fingerprint of human activity.”

Attribution studies show how the risk of a particular event may have changed due to the human influence on climate. Some attribution results surveyed by the World Meteorological Organisation include:

  • The US National Oceanic and Atmospheric Administration determined that human-caused climate change increased chances of the fatal and record rains in Louisiana by at least 40% and could have nearly doubled the odds of such a storm.
  • A scientific analysis of devastating 2014 floods in the United Kingdom, which cost an estimated $646 million in insurance losses, found that human-caused climate change has increased the chance of the extreme rain event by 43%.
  • In May–June 2016, portions of northeast France received 6 full weeks of rain in 24 hours. A formal attribution study released June 9, 2016, found that such extreme rains are at least 40%—and as much as 90%—more likely in some areas of France.
Cyclone extremes

Cyclones, in part, draw their energy from the temperature of the ocean's surface waters, so a warming climate and ocean puts more energy into storms, including cyclones, loading them with more rainfall, and stronger winds pushing more of a storm surge.
The recent Climate Council brief notes, “Increasing temperature of the surface ocean affects the intensity of cyclones, both maximum wind speeds and in the intensity of rainfall that occurs in association with the cyclone.”  The force exerted on buildings and structures when cyclones make landfall increases disproportionately with wind speed.

The Council also notes that: “Tropical cyclones form most readily when there are very warm conditions at the ocean surface and when the vertical temperature gradient through the atmosphere is strong. As this vertical gradient weakens as the climate continues to warm, it is likely that fewer tropical cyclones will form.”

Whilst the best evidence scientists have suggests cyclones are unlikely to increase in number, a 2013 study challenges the status quo, suggesting they will occur more frequently, as well becoming more intense. 

In 2013, researchers reported that the stronger hurricanes in the North Atlantic, the South Pacific, and South Indian Oceans have become more intense.  The same year, the UN meteorological agency concluded that climate change is making super typhoons worse. 

In 2015, an international research team found that a warming planet is already stoking the intensity of tropical cyclones in the northwest Pacific, and their ferocity will continue to increase even with moderate climate change over this century.

More broadly, a 2010 study found that "future projections based on theory and high-resolution dynamical models consistently indicate that greenhouse warming will cause the globally averaged intensity of tropical cyclones to shift towards stronger storms, with intensity increases of 2–11% by 2100...higher resolution modelling studies typically project substantial increases in the frequency of the most intense cyclones, and increases of the order of 20% in the precipitation rate within 100 km of the storm centre.

Recent records

With sustained wind speeds of more than 310 kilometres per hour, Typhoon Haiyan in the Philippines in November 2013 was the most powerful tropical cyclone to make landfall in recorded history. The previous record was held by Hurricane Camille, which in 1969 hit the state of Mississippi with wind speeds of just over 300 km/h. Data compiled from the US National Oceanic and Atmospheric Administration shows sea temperatures were about 0.5
1.0 degree Celsius above normal in the waters to the east of the Philippines as Haiyan began forming. The waters cooled in the storm's wake, an indication of how the storm sucked up energy.   

Hurricane Patricia which hit Mexico in October 2015 achieved a record peak intensity with maximum sustained winds 345 km/h, making it the most intense tropical cyclone on record in the Western Hemisphere, and the strongest globally in terms of 1-minute maximum sustained winds. Cyclone Winston in February 2016 was the strongest tropical cyclone to make landfall in Fiji and the South Pacific Basin in recorded history.

Attribution studies 

  • Superstorm Sandy which hit the northeast coast of the USA with devastating effect in October 2012 was made worse by unusually warm waters which increased the hurricane’s intensity. As well, human-caused sea level rise added to the storm surge, and on the stretch of the Atlantic Coast that spans from Norfolk to Boston, sea levels have been rising four times faster than the global average. Researchers say that “It is possible that subways and tunnels may not have been flooded without the warming-induced increases in sea level and storm intensity and size.”  More broadly, the authors say that “‘snowmaggedon’ in February 2010, superstorm Sandy in October 2012 , supertyphoon Haiyan in November 2013, and the Boulder floods of September 2013 were all influenced by high sea-surface temperatures that had a discernible human component.
  • The Climate Council reported that climate change exacerbated the damage caused by Cyclone Pam, which left a trail of destruction across Vanuatu in 2015.
Damage 

Reinsurance giant, MunichRe, says that "nowhere in the world are weather risks changing faster than in Eastern Asia," and concludes that "as a result of climate change... the intensity of typhoons will increase" in Eastern Asia.  On 11 November 2013, in the aftermath of super-typhoon Haiyan, MunichRe surveyed losses:

Eastern Asia has been hard hit by weather-related loss events in the past three decades. Their number has increased by more than a factor of four, causing overall losses from weather-related events of some US$ 700bn during this period. The insured losses of US$ 76bn amounted to only around 10% of overall losses, with 62% of these attributable to Japan. Floods caused 56% of the overall losses in Eastern Asia, but only 30% of insured losses. The number of floods has increased strongly and is expected to increase further in the coming decades. With insured losses of US$ 16bn, the 2011 Thailand floods caused the biggest-ever weather-related insured loss in the region. After floods, it is typhoons that cause the greatest weather-related losses. New analyses indicate a clear cycle of activity for typhoons, and increased typhoon activity is expected over the coming years..."
And in Australia, The Age reports that new modelling has shown that a cyclone the size of Debbie could have catastrophic consequences on the Gold Coast and as far as Brisbane, with winds of 260km/h, in areas where many homes and towers do not meet cyclonic safety standards. As climate change pushes cyclones further south, tens of billions of dollars worth of infrastructure is at risk. Actuaries, who predict and model scenarios for banks and insurers, have warned properties could become "uninsurable" as premiums rise up to 250% to meet this global warming challenge.

http://www.climatecodered.org/2017/04/climate-change-pushing-floods-cyclones.html

Thursday, March 3, 2016

EXTREME TORNADO OUTBREAKS HAVE BECOME MORE COMMON, SAYS STUDY


NEWS FROM
The Earth Institute
COLUMBIA UNIVERSITY

FOR IMMEDIATE RELEASE, MARCH 2, 2016


EXTREME TORNADO OUTBREAKS HAVE BECOME MORE COMMON, SAYS STUDY
Climate Could Be Implicated, But Answers Are So Far Unclear

Most death and destruction inflicted by tornadoes in North America occurs during outbreaks—large-scale weather events that can last one to three days and span huge regions. The largest ever recorded happened in 2011. It spawned 363 tornadoes across the United States and Canada, killing more than 350 people and causing $11 billion in damage.

Now, a new study shows that the average number of tornadoes in these outbreaks has risen since 1954, and that the chance of extreme outbreaks —tornado factories like the one in 2011—has also increased.

The study’s authors said they do not know what is driving the changes. “The science is still open,” said lead author Michael Tippett, a climate and weather researcher at Columbia University’s School of Applied Science and Engineering and Columbia’s Data Science Institute. “It could be global warming, but our usual tools, the observational record and computer models, are not up to the task of answering this question yet.” Tippett points out that many scientists expect the frequency of atmospheric conditions favorable to tornadoes to increase in a warmer climate—but even today, the right conditions don’t guarantee a tornado will occur. In any case, he said, “When it comes to tornadoes, almost everything terrible that happens, happens in outbreaks. If outbreaks contain more tornadoes on average, then the likelihood they’ll cause damage somewhere increases.”

The results are expected to help insurance and reinsurance companies better understand the risks posed by outbreaks, which can also generate damaging hail and straight-line winds. Over the last 10 years, the industry has covered an average of $12.5 billion in insured losses each year, according to Willis Re, a global reinsurance advisor that helped sponsor the research. The article appears this week in the journal Nature Communications.

Every year, North America sees dozens of tornado outbreaks. Some are small and may give rise to only a few twisters; others, such as the so-called “super outbreaks” of 1974 and 2011, can generate hundreds. In the simplest terms, the intensity of each tornado is ranked on a zero-to-five scale, with other descriptive terms thrown in. The lower gradations cause only light damage, while the top ones, like a twister that tore through Joplin, Missouri, in 2011 can tear the bark off trees, rip houses from their foundations, and turn cars into missiles.

For this study, the authors calculated the mean number of tornadoes per outbreak for each year as well as the variance, or scatter, around this mean. They found that while the total number of tornadoes rated F/EF1 and higher each year hasn’t increased, the average number per outbreak has, rising from about 10 to about 15 since the 1950s.

The study was coauthored by Joel Cohen, director of the Laboratory of Populations, which is based jointly at Rockefeller University and Columbia’s Earth Institute. Cohen called the results “truly remarkable.”

“The analysis showed that as the mean number of tornadoes per outbreak rose, the variance around that mean rose four times faster. While the mean rose by a factor of 1.5 over the last 60 years, the variance rose by a factor of more than 5, or 1.5 x 1.5 x 1.5 x 1.5. This kind of relationship between variance and mean has a name in statistics: Taylor’s power law of scaling.

“We have seen [Taylor’s power law] in the distribution of stars in a galaxy, in death rates in countries, the population density of Norway, securities trading, oak trees in New York and many other cases,” Cohen says. “But this is the first time anyone has shown that it applies to scaling in tornado statistics.”

The exponent in Taylor’s law number—in this case, the exponent was 4-- can be a measure of clustering, Cohen says. If there’s no clustering—if tornadoes occur just randomly--then Taylor’s law has an exponent of 1. If there’s clustering, then it’s greater than 1. “In most ecological applications, the Taylor exponent seldom exceeds 2. To have an exponent of 4 is truly exceptional. It means that when it rains, it really, really, really pours,” says Cohen.

Extreme outbreaks have become more frequent because of two factors, Tippett said. First, the average number of tornadoes per outbreak has gone up; second, the rapidly increasing variance, or variability, means that numbers well above the average are more common.

Tippett was concerned that the findings could be artifacts of tornado observational data, which are based on eyewitness accounts and known to have problems with consistency and accuracy. To get around this, he re-ran his calculations after substituting the historical tornado data with environmental proxies for tornado occurrence and number of tornadoes per occurrence. These provide an independent—albeit imperfect—measure of tornado activity. The results were very nearly identical.

As for whether the climate is the cause, Tippett said, “The scientific community has thought a great deal about how the frequency of future weather and climate extremes may change in a warming climate. The simplest change to understand is a shift of the entire distribution, but increases in variability, or variance, are possible as well. With tornadoes, we’re seeing both of those mechanisms at play.”

“This paper helps begin to answer one of the fundamental questions to which I’d like to know the answer,” says Harold Brooks of the U.S. National Oceanic and Atmospheric Administration’s National Severe Storms Laboratory. “If tornadoes are being concentrated into more big days, what effect does that have on their impacts compared to when they were less concentrated?“

“The findings are very relevant to insurance companies that are writing business in multiple states, especially in the Midwest,” says Prasad Gunturi, senior vice president at Willis Re, who leads the company’s catastrophe model research and evaluation activities for North America. “Overall growth in the economy means more buildings and infrastructure are in harm’s way,” said Gunturi. “When you combine this increased exposure because outbreaks are generating more tornadoes across state lines and the outbreaks could be getting more extreme in general, it means more loss to the economy and to insurance portfolios.”

Insurance companies have contracts with reinsurance companies, and these contracts look similar to the ones people have for home and car insurance, though for much higher amounts.  The new results will help companies ensure that contracts are written at an appropriate level and that the risks posed by outbreaks are better characterized, said Brooks.

“One big question raised by this work, and one we’re working on now, is what in the climate system has been behind this increase in outbreak severity,” said Tippett.


The paper, “Tornado outbreak variability follows Taylor’s power law of fluctuation scaling and increases dramatically with severity,” is available from the authors.

Scientist contacts:
Michael Tippett  212-851-5936  mkt14@columbia.edu

More information: Kevin Krajick, Senior editor, science news, The Earth Institute: kkrajick@ei.columbia.edu 212-854-9729

The Earth Institute, Columbia University mobilizes the sciences, education and public policy to achieve a sustainable earth. www.earth.columbia.edu.


Friday, November 27, 2015

90% of disasters are now weather-related, COP 21: New study informs Paris summit delegates that extreme weather in the last two decades has claimed well over half a million lives and cost trillions of dollars

by Tim Radford, Climate News Network, November 27, 2015

LONDON – In the 20 years since the first UN conference on climate change, weather-related disasters have claimed 606,000 human lives, damaged or destroyed 87 million homes, and injured, displaced or left helpless a total of 4.1 billion people.

A new study from the UN Office for Disaster Risk Reduction (UNISDR) demonstrates that 90% of all disasters are now weather-related. And the average of 335 weather-related disasters per year in the last 10 years is twice that recorded between 1985 and 1995

The report, "The Human Cost of Weather-Related Disasters 19952015," is intended to focus attention during the UN climate change conference – which opens in Paris on Monday − on the damage already inflicted by global warming as a consequence of rising levels of greenhouse gases in the atmosphere, in turn as a consequence of the human combustion of fossil fuels and the destruction of the planet’s forests.


Development cost

As world leaders head for the summit, referred to as COP21, the numbers alone tell the story. In the last 20 years, there have been 6,457 floods, storms, heatwaves, droughts and other climatic events that meet the UN definition of a disaster − that is, they killed people, displaced communities, or caused damage calculated in millions.

But there are figures nobody can assess. One of these is the true economic cost, especially in terms of economic development.

The UN’s Centre for Research on the Epidemiology of Disasters, based at the Catholic University of Louvain in Belgium, puts the tally at US$1.891 trillion over the last 20 years.

However, that accounts for about only 71% of all losses attributable to natural hazards. The true figure for disasters – including earthquakes and tsunamis – could be between $250bn and $300bn a year, which would mean a total of up to $6 trillion just for the last decade.

In terms of numbers, the US was hit most often, with 472 recorded tornadoes, ice storms, hurricanes, floods, heatwaves, droughts and other events. China followed with 441, India with 228, the Philippines with 274, and Indonesia with 263.

The greatest loss of lives was in Asia, where 332,000 people died and 3.7 billion were affected. Cyclone Nargis, which hit Myanmar in 2008, claimed 138,000 lives.

Floods accounted for 47% of all weather-related disasters in the 20 years, affecting 2.3 billion people and killing 157,000. Storms accounted for 242,000 deaths, or 40% of the total. Almost 90% of these deaths were in the lower-income nations.

Paradoxically, higher-income countries felt the impact of temperature extremes. Of the 164,000 who perished when the thermometer dropped or climbed to catastrophic levels, 148,000 died during heat waves, and 90% of these deaths were in Europe.

Greater extremes

But drought hit Africa more than any other continent, with 136 arid spells between 1995 and 2015, and 77 of these were in East Africa.

Researchers have repeatedly given warnings that global warming is likely to be accompanied by greater extremes.

“In the long term, an agreement in Paris at COP21 on reducing greenhouse gas emissions will be a significant contribution to reducing damage and loss from disasters, which are partly driven by a warming globe and rising sea levels,” says Margareta Wahlström, head of UNISDR.

“For now, there is a need to reduce existing levels of risk and avoid creating new risk by ensuring that public and private investments are risk-informed and do not increase the exposure of people and economic assets to natural hazards on flood plains, vulnerable low-lying coastlines, and other locations unsuited for human settlement.”