The idea that global warming has “stopped” has long been a contrarian talking point. This framing has found entry into the scientific literature and there are now numerous articles that address a presumed recent “pause” or “hiatus” in global warming. Moreover, the “hiatus” also featured as an accepted fact in the latest IPCC report (AR5).
Notwithstanding its widespread use in public and apparent acceptance in the scientific community, there are reasons to be skeptical of the existence of a “hiatus” or “pause” in global warming [Ed: see also this previous post]. We have examined this issue in a series of three recent papers, which have converged on the conclusion that there is not now, and there never has been, a hiatus or pause in global warming.
We are not alone in coming to this conclusion; evidence for this has also been reported by Cahill and colleagues in a recent statistical change point analysis, which failed to identify a slowing in warming at any point in time during the last four decades.
But because this conclusion is potentially controversial, it requires a careful analysis of the conceptual landscape of research on temperature variation over the recent period.
To date, research on the “pause” has addressed at least 4 distinct questions:
- Is there a “pause” or “hiatus” in warming?
- Has warming slowed compared to the long-term warming trend?
- Has warming lagged behind model-derived expectations?
- What physical mechanisms underlie the “hiatus”?
Those questions are not only conceptually distinct, they also involve different aspects of the data and entail different statistical hypotheses. Nonetheless, those questions have frequently been conflated in the literature, and by using a single blanket term such as “pause” or “hiatus” for distinctly different phenomena and research questions, unnecessary confusion has resulted.
To reduce this confusion, our recent work has been exclusively concerned with the first question: Is there, or has there recently been, a “pause” or “hiatus” in warming? It is this question—and only this question—that we answer with “no,” based on multiple lines of evidence:
In an article published in BAMS this year (Lewandowsky et al., 2015), we reported on the results of a blind expert test by professional economists. Blind tests are the methodological gold standard in many fields of enquiry, from pharmaceutical research to cognitive science. The economists in our sample were shown the global temperature data (NASA’s GISTEMP) but it was labeled as “world agricultural output” as shown in the figure below.
The experts had to evaluate a statement accompanying the graph which read: “A prominent Australian critic of conventional economics, Mr. X., publicly stated in 2006, that ‘There IS a problem with the growth in world agricultural output—it stopped in 1998.’ A few months ago, Mr. X. reiterated that ‘…. there’s no trend, 2010 is not significantly more productive in any way than 1998.’ ” This statement was an exact translation, into economic terms, of a series of public statements by an Australian contrarian (Bob Carter) claiming that global warming had stopped.
The experts in our sample clearly disagreed with the notion of a pause or hiatus:
Experts rejected the idea that the data confirmed the statement and they instead found the data to contradict the accompanying statement. The experts also found the statement to be misleading and ill-informed. And nearly two thirds of our experts endorsed the possibility that the claim of a pause or hiatus might be fraudulent in light of the data.
In a second article, just published in Scientific Reports (Lewandowsky et al., 2015b), we followed up on this experimental test with a formal statistical analysis that buttressed the conclusions of the blind expert test. We began by considering a corpus of 40 peer-reviewed articles that have addressed the pause and inferred from those publications what those authors considered to be the onset year of the pause. Did the pause commence in 1998? 2001? Or some other year? We found that there was considerable variation, shown by the blue histogram in the figure below, which shows the distribution of presumed onset times together with global temperatures during the modern record of global warming.
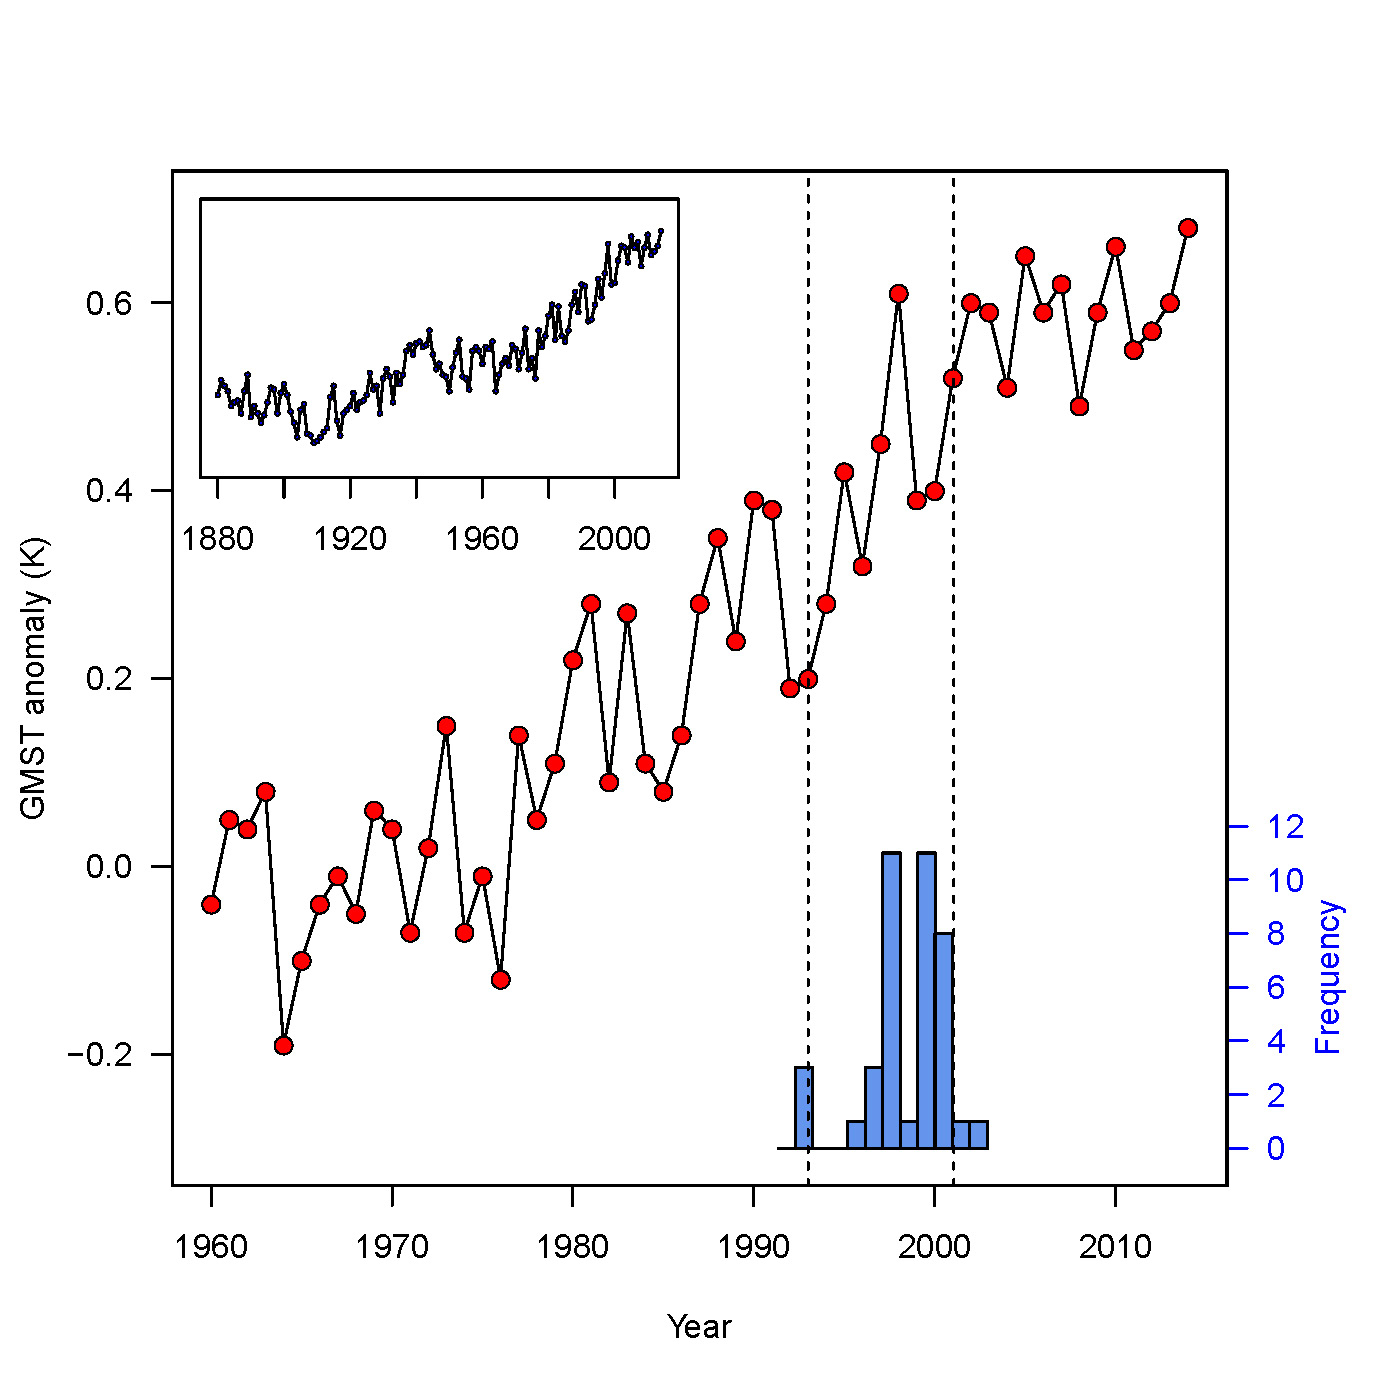
The histogram shows that the presumed onset of the pause spanned an entire decade (1993–2003). The mean presumed duration of the pause across the 40 articles was 13.5 years. We next took the onset and duration of the pause reported by each article and compared the associated decadal temperature trends against the distribution of all possible trends of equal duration during the last few decades. If there were a pause, we would expect the distribution of trends in the literature to differ considerably from the distribution of all trends of equivalent duration.
Because there is some disagreement about the onset of modern global warming, we used three reference dates for our comparison involving all possible trends: the year 1951, used by the IPCC in AR5, and 1964 and 1976, which are 2 standard deviations below and above and below the mean estimate of the year of onset of modern global warming derived by the Cahill et al. change-point analysis.
The results are shown in the 3 histograms below, with onset times 1951, 1964, and 1976, from left to right. The vertical red lines in each panel represent the long-term trend (1951–2012) used by the IPCC in the AR5. The solid line is for the GISS dataset analyzed here, and the dashed line is the long-term trend for the same period (0.12 K/decade) in the UK Met Office’s HadCRUT4 data set.
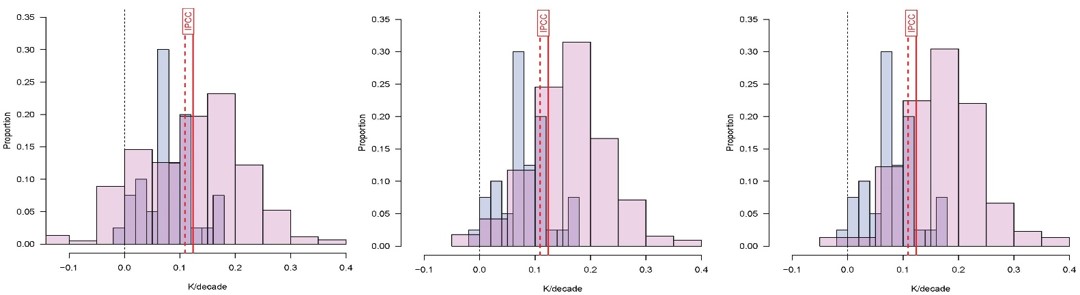
This analysis shows that the distribution of warming trends labeled as the pause by the literature is indistinguishable from the overall distribution of trends that have been observed from the middle of the 20th century onward. When 1964 or 1976 are instead used as onset of warming, then the distribution of trends labeled as a pause does sit at the lower end of the overall distribution, but it is still by no means consistently extreme or unusual.
Additionally, virtually all articles on the pause referred to a time period during which the decadal warming trend exceeded zero (the black vertical line). This is incompatible with standard dictionary definitions of a pause or hiatus, which cite a process that has been suspended or stopped. Periods in which warming continued (>0 K/decade), by definition, cannot be a pause or a hiatus.
For the notion of a hiatus in warming to be scientifically well-founded, there must either be a demonstrable and statistically-relevant absence of any trend in global temperatures or, minimally, the observed trend must differ in a statistically identifiable way from the historical record. With conventional frequentist statistics, the absence of a trend is difficult to establish, and results can be affected by vantage point. That is, different results may arise depending on when one chooses to look backward in time, not because anything notable has happened but because natural variability can override a long-term trend if only brief periods of time are considered and if the end points of the trend are varied.
We therefore compared the alleged pause against all possible historical trends once more, but this time across all possible historical vantage points during the last three decades. From each vantage point, we look backward in time a varying number of years and determine the magnitude and significance of the trend. The results are shown below using GISTEMP:

The top panel (A) shows the warming trends that were observable at any vantage point between 1984 and 2014 (horizontal axis). For each vantage point, between 3 and 25 years were included in the trend calculation (vertical axis). So, for example, looking backward from 2014, no matter how many years were included in the trend, all trends were positive. When 15 years are included, then the trend becomes statistically significant (hence the dot in the cell at latitude 15 for the last column). By contrast, in 2000, the most recent 3 or 4 years exhibited cooling, but by the time 15 years were included the trend was again significant. The bottom panel of the figure (B) presents the same data using a ternary classification of p-values for the linear trend into non-informative (p > 0.10; beige), partially informative but not conventionally significant (0.10 > p > 0.05; gray), and significant (p < 0.05; terracotta). This panel also includes three diagonal lines that identify the earliest calendar year included in the analysis. Any observation to the below and to the right of the line labeled “1975” only includes observations later than that, and so on for the other two lines. The observations above and to the left of the 1965 line go back to 1960 (top-left corner; looking back 25 years from 1984 inclusive).
The figure shows that at every year during the past 30 years of modern global warming, the immediately preceding warming trend was always significant when 17 years (or more) were included in the calculation. In a number of cases—including in 2014—fewer years were required to reach significance, but never more than 17. This result should not be surprising: Significance requires statistical power to be detected, and the more observations are considered the greater the power of the analysis. The fact that a trend fails to reach significance with, say, only 5 or 10 years of data is therefore non-informative: no matter how robust the warming trend, once natural variability is superimposed on the trend, it will escape statistical detection with a small sample. To conclude from that that global warming has “stopped” is unwarranted. Nevertheless, a number of papers in the peer-reviewed literature have done just that. That is, they concluded that there was a pause in warming using a time period that was too short to achieve conventional statistical significance.
To illustrate, we used the definitions of the pause found in our corpus of articles (mean duration 13.5 years), and asked how often the null hypothesis of no warming would fail to be rejected during the last 30 years. It turns out that during those 3 decades, the 14-year trend escaped significance 10 times and the 13-year trend 13 times, suggesting either that global surface warming “paused” between 30% and 43% of a time period during which the Earth warmed 0.6 K overall, or that global surface warming never paused and what we have been observing are routine fluctuations superimposed on a warming trend.
Taken together, the statistical and behavioral evidence demonstrate that the notion of a pause or hiatus—as commonly understood—is incorrect. The evidence from the blind expert test suggests that it is also misleading.
The question of a recent pause in warming is distinct from the matter of fluctuations in warming rates over any particular time period of interest. It is uncontroversial that the climate system is highly variable and, as our analysis shows, there have been many fluctuations, both positive and negative, as compared to the longer term warming trend. It is a valuable research endeavor to examine why these fluctuations occur, and to what extent models and observations may on occasion diverge. Such research has the potential to improve our overall understanding of the climate system.
This brings us to our final issue: If there is no pause and there was no pause, why did the recent period attract so much research attention? We can suggest a number of reasons. One is a matter of semantics. Many articles on the pause addressed not the absence of warming but were concerned with a presumed discrepancy between models and observations. We do not believe that those articles should have been framed in the language of a “pause,” but that does not mean their method or findings are compromised.
A second reason is that owing to the incessant challenge of climate science by highly-vocal contrarians and well-organized Merchants of Doubt, scientists may have become not only reticent in reporting the full spectrum of risk they are concerned about for the future (see for example Brysse et al., 2013), but have also subtly changed the way in which they approach their science. We explored the possible underlying mechanisms for this in an article earlier this year (Lewandowsky et al., 2015c). In a nutshell, we argue that scientists have unwittingly been influenced by a linguistic frame that demonstrably originated outside the scientific community, and that by accepting the word “pause,” scientists have subtly framed their research in ways that our statistical and behavioral analysis has revealed to be inappropriate.
When scientists use the terms “pause” or “hiatus” they may indeed know—and their colleagues may understand—that they do not mean to imply that global warming has stopped. The problem is that words such as “pause” or “hiatus” have vernacular meanings, and when scientists use a term from the public vernacular to describe a feature of science, confusion results when the vernacular term is an inappropriate description of that feature. Scientists might tacitly understand that global warming continues notwithstanding the “pause,” or they may intend “pause” to refer to differences between observed temperatures and model-derived expectations, but the public is not privy to that tacit understanding.
References
- N. Cahill, S. Rahmstorf, and A.C. Parnell, "Change points of global temperature," Environ. Res. Lett., 10 (2015) 084002. http://dx.doi.org/10.1088/1748-9326/10/8/084002
- S. Lewandowsky, J.S. Risbey, and N. Oreskes, "The “Pause” in Global Warming: Turning a Routine Fluctuation into a Problem for Science," Bull. Amer. Meteor. Soc., (2015) 150914120309001. http://dx.doi.org/10.1175/BAMS-D-14-00106.1
- S. Lewandowsky, J.S. Risbey, and N. Oreskes, "On the definition and identifiability of the alleged “hiatus” in global warming," Sci. Rep., 5 (2015) 16784. http://dx.doi.org/10.1038/srep16784
- K. Brysse, N. Oreskes, J. O’Reilly, and M. Oppenheimer, "Climate change prediction: Erring on the side of least drama?", Global Environmental Change, 23 (2013) 327-337. http://dx.doi.org/10.1016/j.gloenvcha.2012.10.008
- S. Lewandowsky, N. Oreskes, J.S. Risbey, B.R. Newell, and M. Smithson, "Seepage: Climate change denial and its effect on the scientific community," Global Environmental Change, 33 (2015) 1-13. http://dx.doi.org/10.1016/j.gloenvcha.2015.02.013


No comments:
Post a Comment