The current (#lamarlysenko) climate denial witch hunt being conducted by Lamar Smith and the House Science Committee was triggered by the publication of several new papers which have put to rest one of denial-dom’s favorite nonsense memes – that “temperatures have not been rising” for x years.
In particular, the paper by Thomas Karl and colleagues at NOAA has been a target, so it’s worth reviewing what the NOAA group wrote about. In a nutshell – they tapped into some more reliable data.
Significant recent media and political attention has been focused on the newNOAA temperature record, which shows considerably more warming than their prior record during the period from 1998 to present. The main factor behind these changes is the correction in ocean temperatures to account for the transition from ship engine room intake measurement to buoy-based measurements and a calibration of differences across ships using nighttime marine air temperatures (NMAT). Here we seek to evaluate the changes to the NOAA ocean temperature record by constructing a new buoy-only sea surface temperature record. We find that a record using only buoys (and requiring no adjustments) is effectively identical in trend to the new NOAA record and significantly higher than the old one.
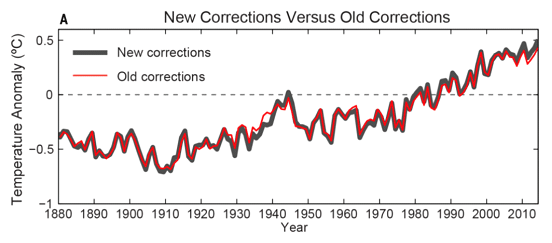
The changes to the prior NOAA global land/ocean temperature series are shown in Figure 1. There are some large changes in the 1930s that are interesting but have little impact on century-scale trends. The new NOAA record also increases temperatures in recent years, resulting a in a record where the period subsequent to 1998 has a trend identical to the period from 1950-1997 (and giving rise to the common claim that the paper was “busting” the recent slowdown in warming).
The paper that presented the revised record, Karl et al., didn’t actually do much that was new. Rather, they put together two previously published records: an update to the NOAA sea surface temperature record (called ERSST) from version 3 to version 4, and the incorporation of a new land record from the International Surface Temperature Initiative (ISTI) that makes use of around 32,000 land stations rather than the 7,000 or so GHCN-Monthly stations previously utilized. The new land record is quite similar to that produced by Berkeley Earth, though it has relatively little impact on the temperature trend vis-à-vis the old land record, particularly during the recent 1998-present period.
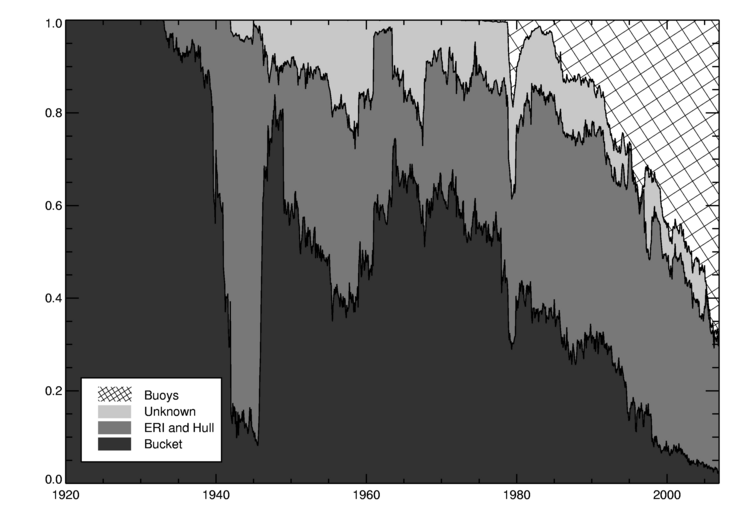
The slowdown-busting nature of the Karl et al paper relies almost entirely on the update from ERSST v3b to v4. During the post 1998 period, this is primarily due to a revised treatment of buoys and ship engine room intake (ERI) measurements and an improved calibration of differences across ships. During the past few decades the number of automated SST measurement buoys has expanded rapidly from effectively zero before 1980 to over 70% of all SST measurements today as shown in the figure below. Buoys are appealing measurement platforms, as they are not restricted to shipping routes and often have fully automated reporting via satellite uplink.
Figure 2. Share of SST observations by instrument type from Kennedy et al., 2011. Note that this figure ends in 2006; since then buoys have continued to grow in observation share.
NOAA argues that the transition to buoys introduced a spurious cooling bias into the record. ERIs tend to warm the water a bit before measuring it (ship engine rooms being rather hot), whereas buoys do not. They identify a bias of around 0.1 C between buoys and ERIs and remove it by adjusting buoy records up to match ERI records in ERSST v4, as well as use NMAT readings to calibrate the differences across ships. These adjustments had not been done in the priorERSST v3b. As an aside, the decision to adjust buoys up to ERIs or ERIs down to buoys should nominally be trend neutral. Indeed, in their work on HadSST3 Kennedy and colleagues explicitly tested this, and found “no appreciable difference” on trends.
However, there is a rather straightforward way for us to test if the adjustments done in ERSST v4 are proper or not: compare their adjusted record to a record made only from buoys. The buoy records are from purpose built instruments which are largely standardized, resulting in much more homogeneous record [details]. On the other hand, the buoy record is short, and has limited coverage in the early 1990s.
The buoy-only record is prepared by calculating daily averages for each buoy. Buoys which show a large daily temperature variation are rejected: in deep water the daily temperature range is only a few tenths of a degree, but in very shallow water it can be substantial which presents problems when some data are missing. Next, the daily data are placed into 550 x 550 km equal area grid cells based on the location of the buoy for that day, and monthly averages are determined for each cell.
The resulting coverage is still limited and so produces a biased estimate of global sea surface temperature. To produce a useful comparison to ERSST, we therefore reduce the coverage of the ERSST datasets to match the buoy dataset (now using a fine 1-degree grid for all the data) and then calculate anomalies for all the datasets using a 2001-2010 baseline. The area weighted mean temperature is then calculated for each record. While this doesn’t provide a very good estimate of global SST, it does allow a strict like-with-like comparison against ERSST over the regions where the buoys have coverage. The percent of global ocean covered by buoy measurements varies from around 40% in the mid 1990s to around 70% in recent years.
Figure 3. ERSST v3b, v4, and Buoy-Only SST anomalies and trends from 1995 through the end of 2014. The trend periods shown are the full record (1995-2014) and the “hiatus” period (1998-2014). 2015 is excluded as the year is incomplete, and the period prior to 1995 is excluded due to limited buoy coverage. The anomaly graph is baselined to 1995-2005 to show the time-evolution of differences.
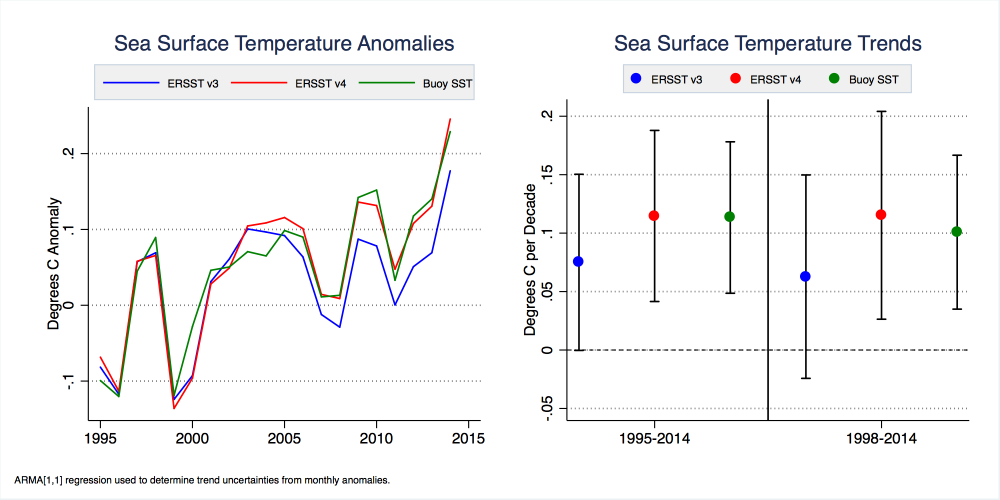
As shown in Figure 3, a buoy-only record is quite similar to the ERSST v4 but shows statistically significantly more warming than ERSST v3b during the period from 1995 through the end of 2014 (p < 0.05 trend in the differences). This suggests that ERSST v3b suffered a cooling bias when blending buoy and ship records that is properly corrected in ERSST v4, at least for the areas where both ship and buoy records are available. Because the buoy record is relatively homogeneous and requires no adjustments, it provides a good check in the validity of the combined ship-buoy series when normalized for spatial coverage.
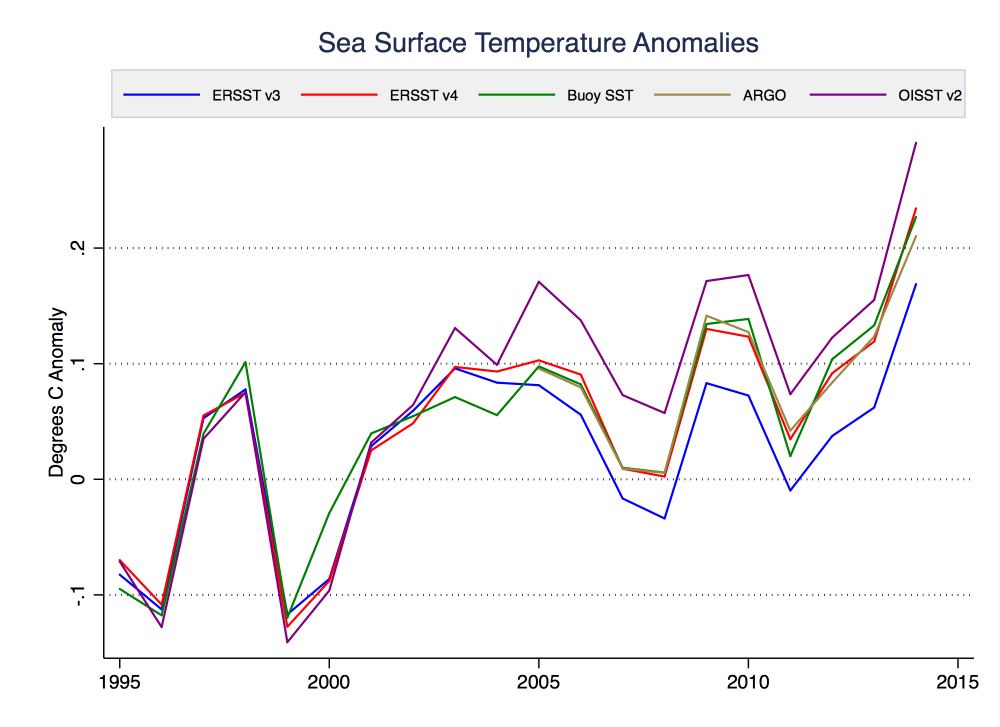
In addition to the buoy-only dataset, we can also examine data from ARGO floats (which are not included in our buoy dataset). The ARGO floats have fairly good spatial coverage over the period since 2005. They are primarily intended to measure deep ocean temperatures, but also measure sea surface temperatures during their ascent from the depths to the surface. NOAA provides another sea surface dataset called OISST, which includes data from ships, buoys, and satellites. There are two versions of OISST: a daily version which is newer and includes adjustments to account for the transition from ships to buoys, and a weekly version which does not include this correction. Figure 4 shows how both the ARGO record and daily OISST record compare to ERSST v3b, v4, and our new buoy-only record when spatial coverage is normalized across all records.
Figure 4. ERSST v3b, v4, and buoy-only, ARGO, and OISST SST anomalies from 1995 through the end of 2014. The anomalies shown are relative to a 1995-2005 period; the ARGO record is too short for this baseline and instead is matched to the buoy-only record during the period of overlap.
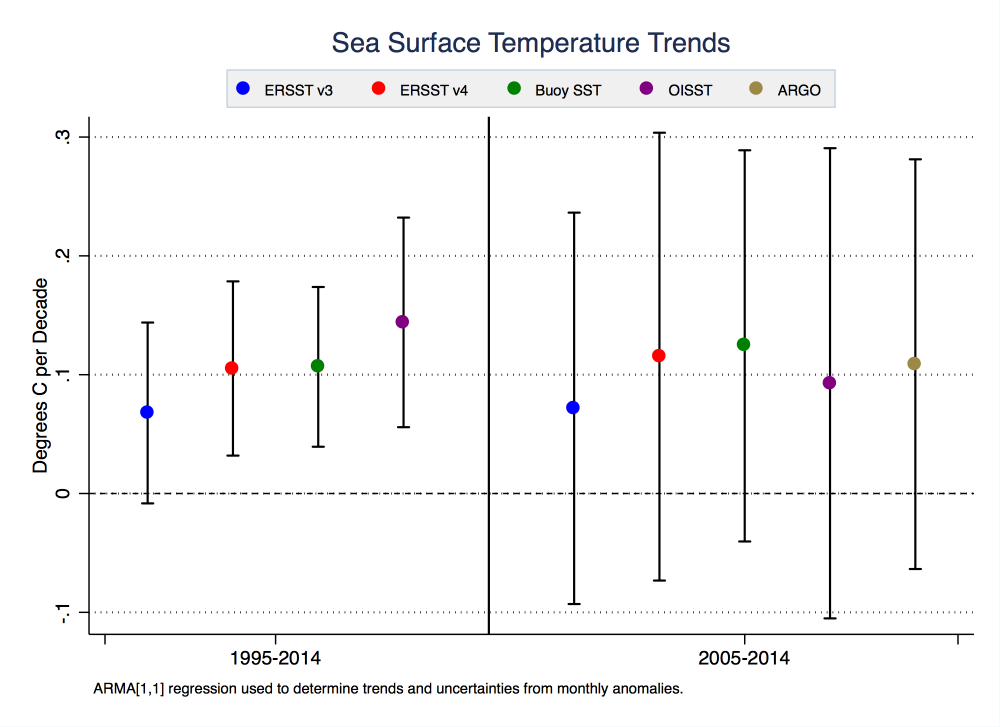
Over the period from 2005 to 2014, ARGO buoys show statistically significantly more warming than ERSST v3b (p < 0.05 using an ARMA[1,1] model), but indistinguishable from ERSST v4 or the buoy-only record. Similarly, OISST has the highest trend of all series over the 1995-2014 period. The trends of all series over these two periods are shown in Figure 5.
Figure 5. ERSST v3b, v4, and buoy-only, ARGO, and OISST SST trends from 1995-2014 and 2005-2014. The latter period is chosen to compare ARGO to other records, as the ARGO record does not have sufficient coverage prior to 2005. Confidence intervals are calculated using an ARMA [1,1] model to account for autocorrelation. Note: the confidence intervals indicate the uncertainty in the trends, which is dominated by interannual variability. The uncertainty in the trend in the differences is much lower, leading to a statistically significant difference between the buoys and ERSSTv3b.
The ship records are important because they form the foundation for a long sea surface temperature record, but they require careful calibration. The differences between HadSST3 and ERSSTv4 suggest that the finer details of the ship record are not yet settled, and as a result care is required especially when considering short term trends.
However the buoy data, ARGO floats, and daily OISST record all support the NOAA claim that ERSSTv3b suffered a significant cool bias over recent years arising from inhomogeneities in the ship record and the increasing use of buoys Code for downloading and processing the data for this analysis is available here: http://www.ysbl.york.ac.uk/~cowtan/data/buoy.zip. While the code and data are only 18 MB, the (optional) raw buoy data are approximately 44 GB. Gridded 1×1 files are also provided for buoy, ERSSTv3b, and ERSSTv4 data.http://climatecrocks.com/2015/11/28/why-new-noaa-temps-are-more-reliable/


No comments:
Post a Comment