The time has come: the new IPCC report is here! After several years of work by over 800 scientists from around the world, and after days of extensive discussion at the IPCC plenary meeting in Stockholm, the Summary for Policymakers was formally adopted at 5 o’clock this morning. Congratulations to all the colleagues who were there and worked night shifts. The full text of the report will be available online beginning of next week. RealClimate summarizes the key findings and shows the most interesting graphs.
Global warming
It is now considered even more certain (> 95%) that human influence has been the dominant cause of the observed warming since the mid-20th century. Natural internal variability and natural external forcings (eg the sun) have contributed virtually nothing to the warming since 1950 – the share of these factors was narrowed down by IPCC to ± 0.1 degrees. The measured temperature evolution is shown in the following graph.
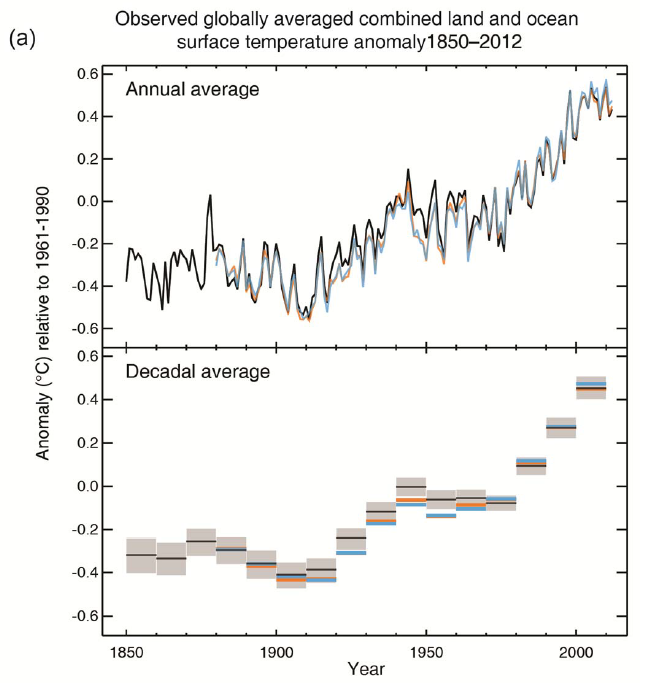
Figure 1. The measured global temperature curve from several data sets. Top: annual values. Bottom: averaged values over a decade.
Those who have these data before their eyes can recognise immediately how misguided the big media attention for the “wiggles” of the curves towards the end has been. Short-term variations like this have always existed, and they always will. These are mostly random, they are (at least so far) not predictable, and the IPCC has never claimed to be able to make predictions for short periods of 10-15 years, precisely because these are dominated by such natural variations.
The last 30 years were probably the warmest since at least 1,400 years. This is a result from improved proxy data. In the 3rd IPCC report this could only be said about the last thousand years, in the 4th about the last 1,300 years.
The future warming by 2100 – with comparable emission scenarios – is about the same as in the previous report. For the highest scenario, the best-estimate warming by 2100 is still 4 °C (see the following chart).

Figure 2. The future temperature development in the highest emissions scenario (red) and in a scenario with successful climate mitigation (blue) – the “4-degree world” and the “2-degree world.”
What is new is that IPCC has also studied climate mitigation scenarios. The blue RCP2.6 is such a scenario with strong emissions reduction. With this scenario global warming can be stopped below 2 °C.
A large part of the warming will be irreversible: from the point where emissions have dropped to zero, global temperature will remain almost constant for centuries at the elevated level reached by that time. (This is why the climate problem in my opinion is a classic case for the precautionary principle.)
Sea-level rise
Sea levels are rising faster now than in the previous two millennia, and the rise will continue to accelerate – regardless of the emissions scenario, even with strong climate mitigation. (This is due to the inertia in the system.) The new IPCC scenarios to 2100 are shown the following graph.

Figure 3. Rise of the global sea level until the year 2100, depending on the emissions scenario.
This is perhaps the biggest change over the 4th IPCC report: a much more rapid sea-level rise is now projected (28–97 cm by 2100). This is more than 50% higher than the old projections (18–59 cm) when comparing the same emission scenarios and time periods.
This is perhaps the biggest change over the 4th IPCC report: a much more rapid sea-level rise is now projected (28–97 cm by 2100). This is more than 50% higher than the old projections (18–59 cm) when comparing the same emission scenarios and time periods.
With unabated emissions (and not only for the highest scenario), the IPCC estimates that by the year 2300 global sea levels will rise by 1–3 meters.
Already, there are likely more frequent storm surges as a result of sea level rise, and for the future this becomes very likely.
Land and sea ice
Over the last two decades, the Greenland and Antarctic ice sheets have been losing mass, glaciers have continued to shrink almost worldwide, and Arctic sea ice and Northern Hemisphere spring snow cover have continued to decrease in extent.
The Greenland ice sheet is less stable than expected in the last report. In the Eemian (the last interglacial period 120,000 years ago, when the global temperature was higher by 1–2 °C) global sea level was 5–10 meters higher than today (in the 4th IPCC report this was thought to be just 4–6 meters). Due to better data very high confidence is assigned to this. Since a total loss of the Greenland ice sheet corresponds to a 7-meter rise in sea level, this may indicate ice loss from Antarctica in the Eemian.
In the new IPCC report the critical temperature limit at which a total loss of the Greenland ice sheet will occur is estimated as 1–4 °C of warming above preindustrial temperature. In the previous report that was still 1.9–4.6 °C – and that was one of the reasons why international climate policy has agreed to limit global warming to below 2 degrees.
With unabated emissions (RCP8.5) the Arctic Ocean will likely become virtually ice-free in summer before the middle of the century (see figure). In the last report, this was not expected until near the end of the century.
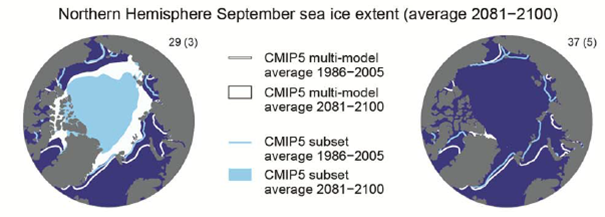
Figure 4. The ice cover on the Arctic Ocean in the 2-degree world (left) and the 4-degree world (right).
Rainfall
The IPCC expects that dry areas become drier due to global warming, and moist areas even wetter. Extreme rainfall has likely already been increasing in North America and Europe (elsewhere the data are not so good). Future extreme precipitation events are very likely to become more intense and more frequent over most land areas of the humid tropics and mid-latitudes.
Oceans
At high emissions (red scenario above), the IPCC expects a weakening of the Atlantic Ocean circulation (commonly known as the Gulf Stream system) by 12% to 54% by the end of the century.
Last but not least, our CO2 emissions not only cause climate change, but also an increase in the CO2 concentration in sea water, and the oceans acidify due to the carbonic acid that forms. This is shown by the measured data in the graph below.
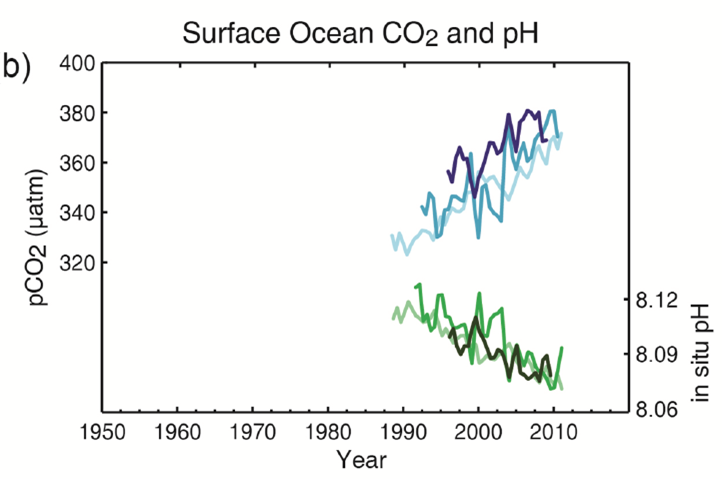
Figure 5. Measured CO2 concentration and pH in seawater. Low pH means higher acidity.
Conclusion
The new IPCC report gives no reason for complacency – even if politically motivated “climate skeptics” have tried to give this impression ahead of its release with frantic PR activities. Many wrong things have been written which now collapse in the light of the actual report.
The opposite is true. Many developments are now considered to be more urgent than in the fourth IPCC report, released in 2007. That the IPCC often needs to correct itself “upward” is an illustration of the fact that it tends to produce very cautious and conservative statements, due to its consensus structure – the IPCC statements form a kind of lowest common denominator on which many researchers can agree. The New York Times has given some examples for the IPCC “bending over backward to be scientifically conservative.” Despite or perhaps even because of this conservatism, IPCC reports are extremely valuable – as long as one is aware of it.
Further Commentary:
Mike Mann: Climate-Change Deniers Must Stop Distorting the Evidence
Stefan Rahmstorf: The Known Knowns of Climate Change
Stefan Rahmstorf: The Known Knowns of Climate Change


No comments:
Post a Comment