Arctic sea ice has passed its annual maximum extent and is beginning its seasonal decline through the spring and summer. While total extent was not at record low, it remained well below average through March. Ice fracturing continued north of Alaska, and the Arctic Oscillation was in a strongly negative phase during the second half of the month, with unusually high sea level pressure over almost all of the Arctic Ocean. Levels of multiyear ice remain extremely low. The ice is thinner, and satellite data suggests that first-year ice may now cover the North Pole area for the first time since winter 2008.
Overview of conditions
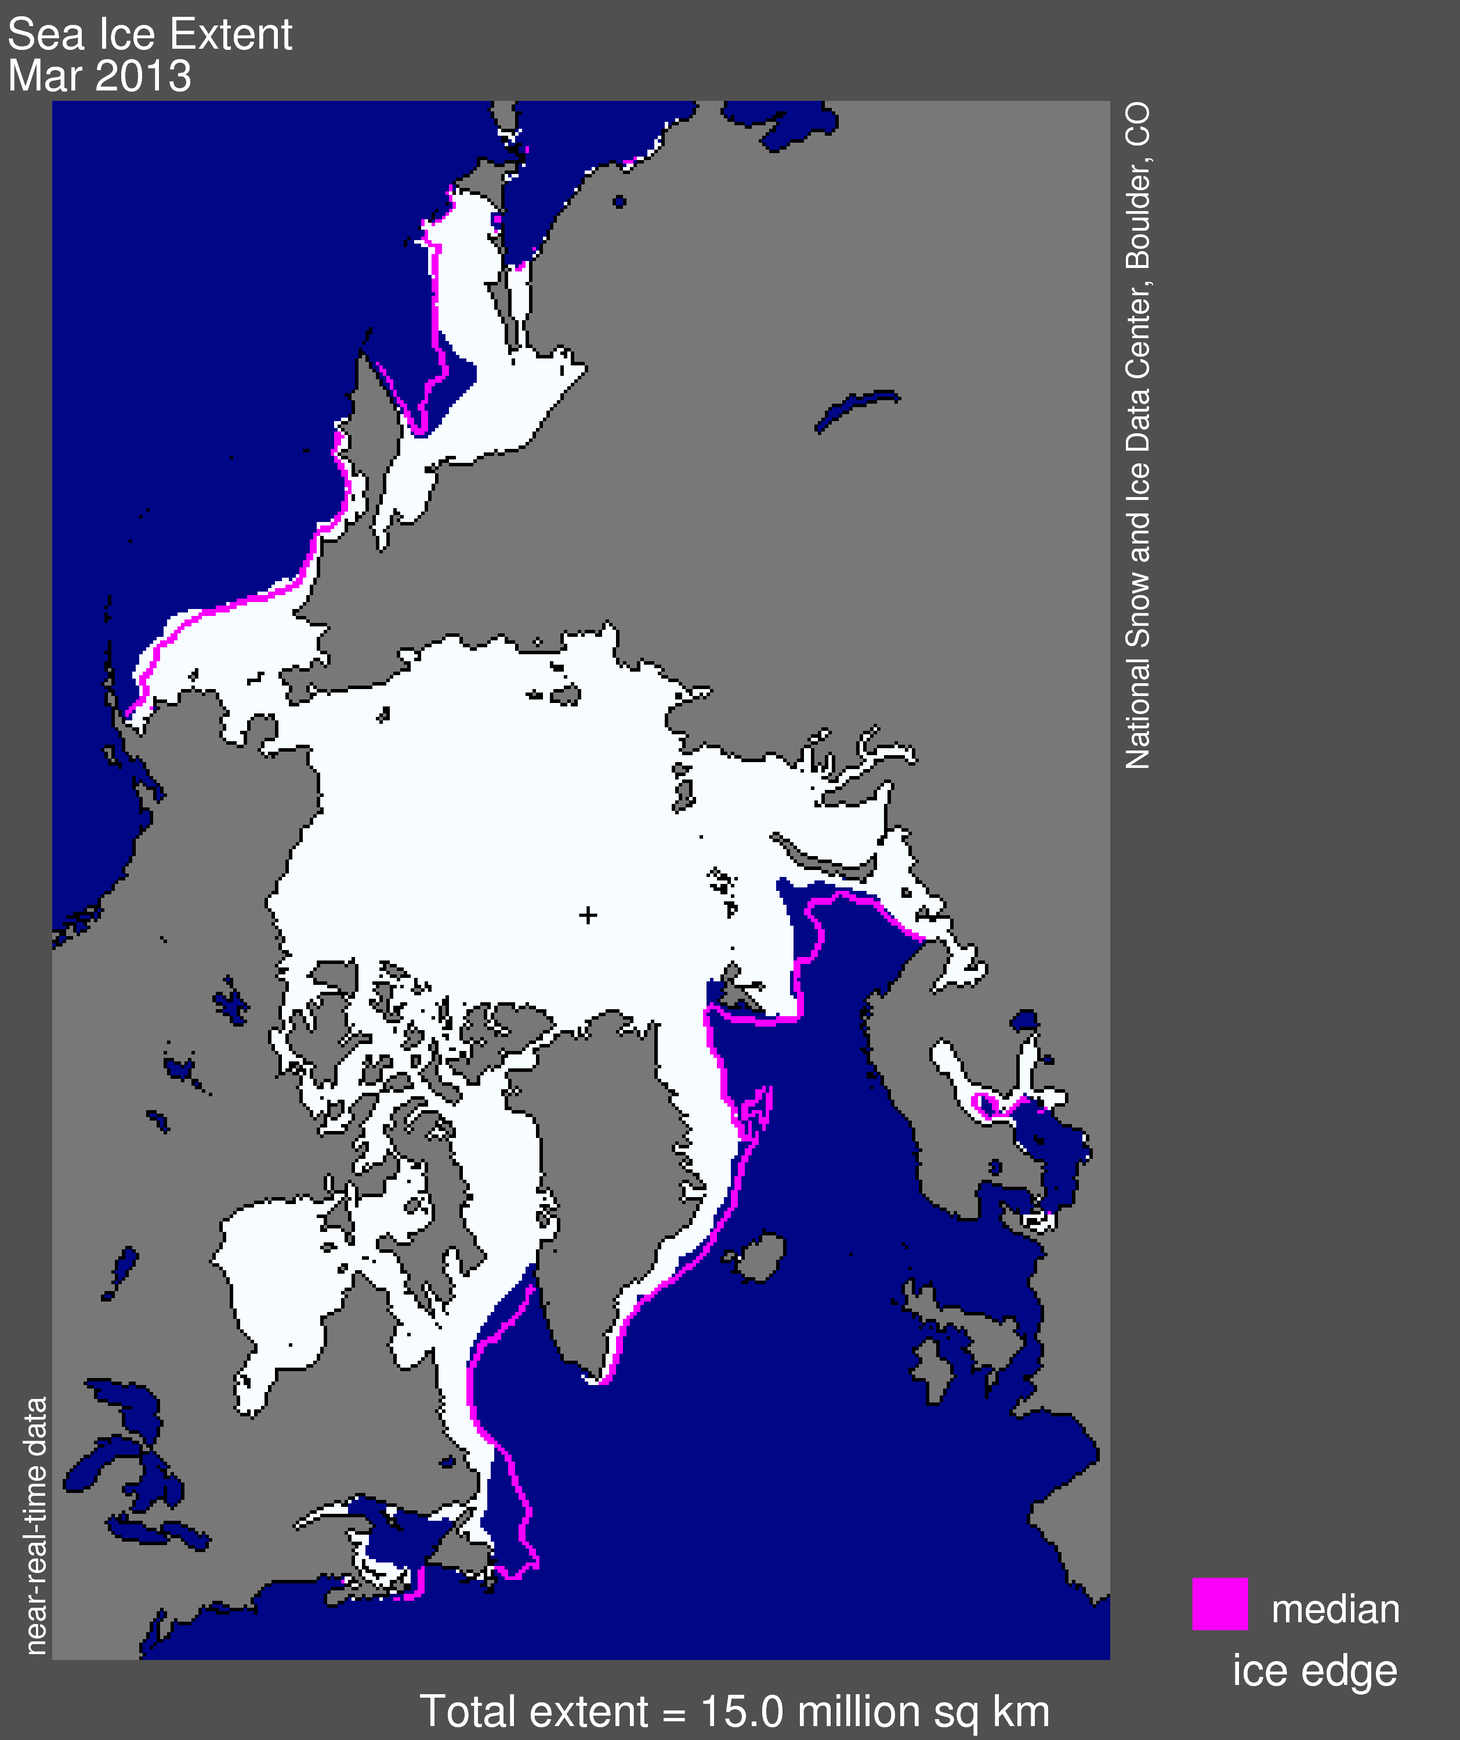
Figure 1. Arctic sea ice extent for March 2013 was 15.04 million square kilometers (5.81 million square miles). The magenta line shows the 1979 to 2000 median extent for that month. The black cross indicates the geographic North Pole. Sea Ice Index data. About the data. Credit: National Snow and Ice Data Center. High-resolution image
Arctic sea ice extent in March 2013 averaged 15.04 million square kilometers (5.81 million square miles). This is 710,000 kilometers (274,000 square miles) below the 1979 to 2000 average extent, and 610,000 square kilometers (236,000 square miles) above the record low for the month, which happened in 2006. Continuing a trend in recent winters, ice extent was near or below average levels throughout most of the Arctic, with the exception of higher extent in the Bering Sea.
Conditions in context
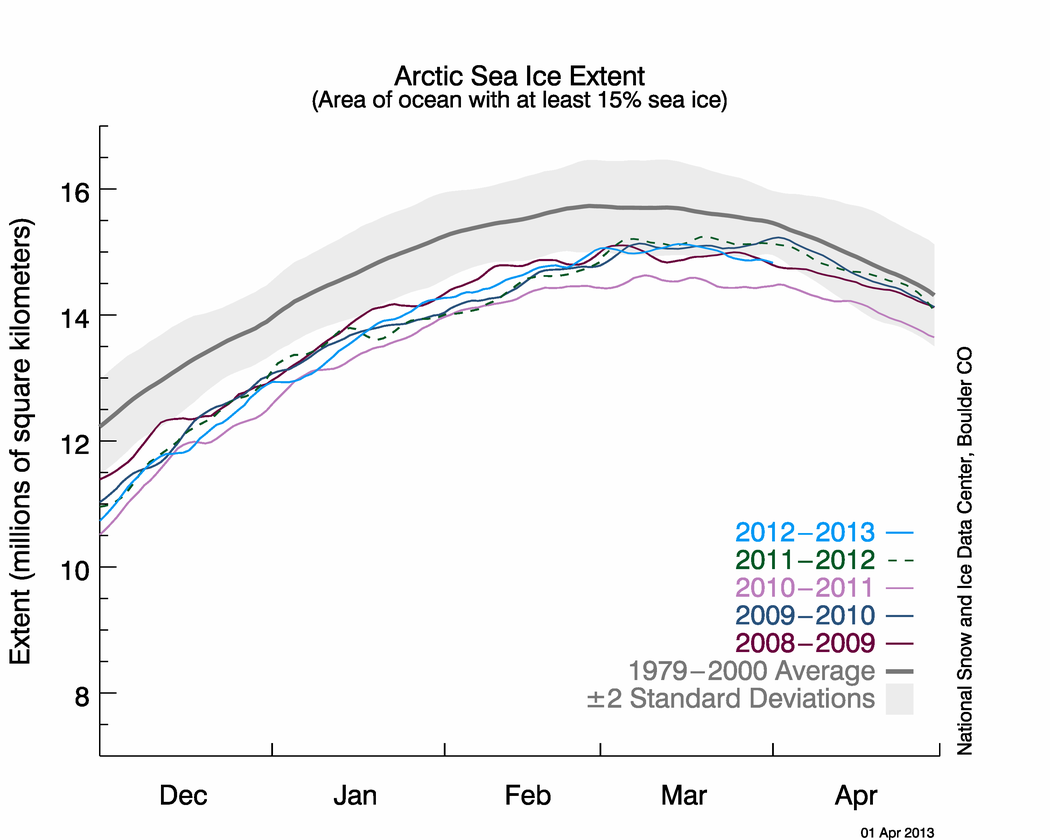
Figure 2. The graph above shows Arctic sea ice extent as of April 1, 2013, along with daily ice extent data for the previous five years. 2012-2013 is shown in blue, 2011-2012 in green, 2010-2011 in pink, 2009-2010 in navy, and 2008-2009 in purple. The 1979-2000 average is in dark gray. The gray area around this average line shows the two standard deviation range of the data. Sea Ice Index data.
Credit: National Snow and Ice Data Center
High-resolution image
Credit: National Snow and Ice Data Center
High-resolution image
As Arctic sea ice reaches its maximum extent in March, the net gain or loss through the month tends to be small. This year, extent decreased 5,400 square kilometers (2,100 square miles) between the beginning and end of the month, with the decline in the second half of the month slightly outweighing the increase over the first half. Air temperatures (at the 925 mb level, or about 3,000 feet) were 3-6 degrees Celsius (5-11 degrees Fahrenheit) higher than average over the central Arctic Ocean, with cooler conditions compared to average (3-6 C, or 5-11 F) over the Kara and Barents seas.
The circulation pattern known as the Arctic Oscillation (AO) reached an extreme negative phase in the second half of the month, associated with unusually high sea level pressure covering nearly the entire Arctic Ocean. The AO index, a measure of the state of the atmosphere over the Arctic, fell to as low as -5 sigma in mid March. This caps several months of a persistently negative AO. In the past, a negative AO in winter has been associated with the retention of thick ice in the Arctic Ocean and reduced export by drift into the Atlantic, favoring more extensive sea ice at the end of the summer melt season. However, in recent years, this relationship has not held and low summer extents have followed winters with strong negative AO. The month was also notable for continued fracturing of the ice cover in the Beaufort and Chukchi seas north of Alaska, as seen in a new animation by the NASA Earth Observatory. This is consistent with wind patterns associated with the strong negative pattern of the AO.
March 2013 compared to previous years
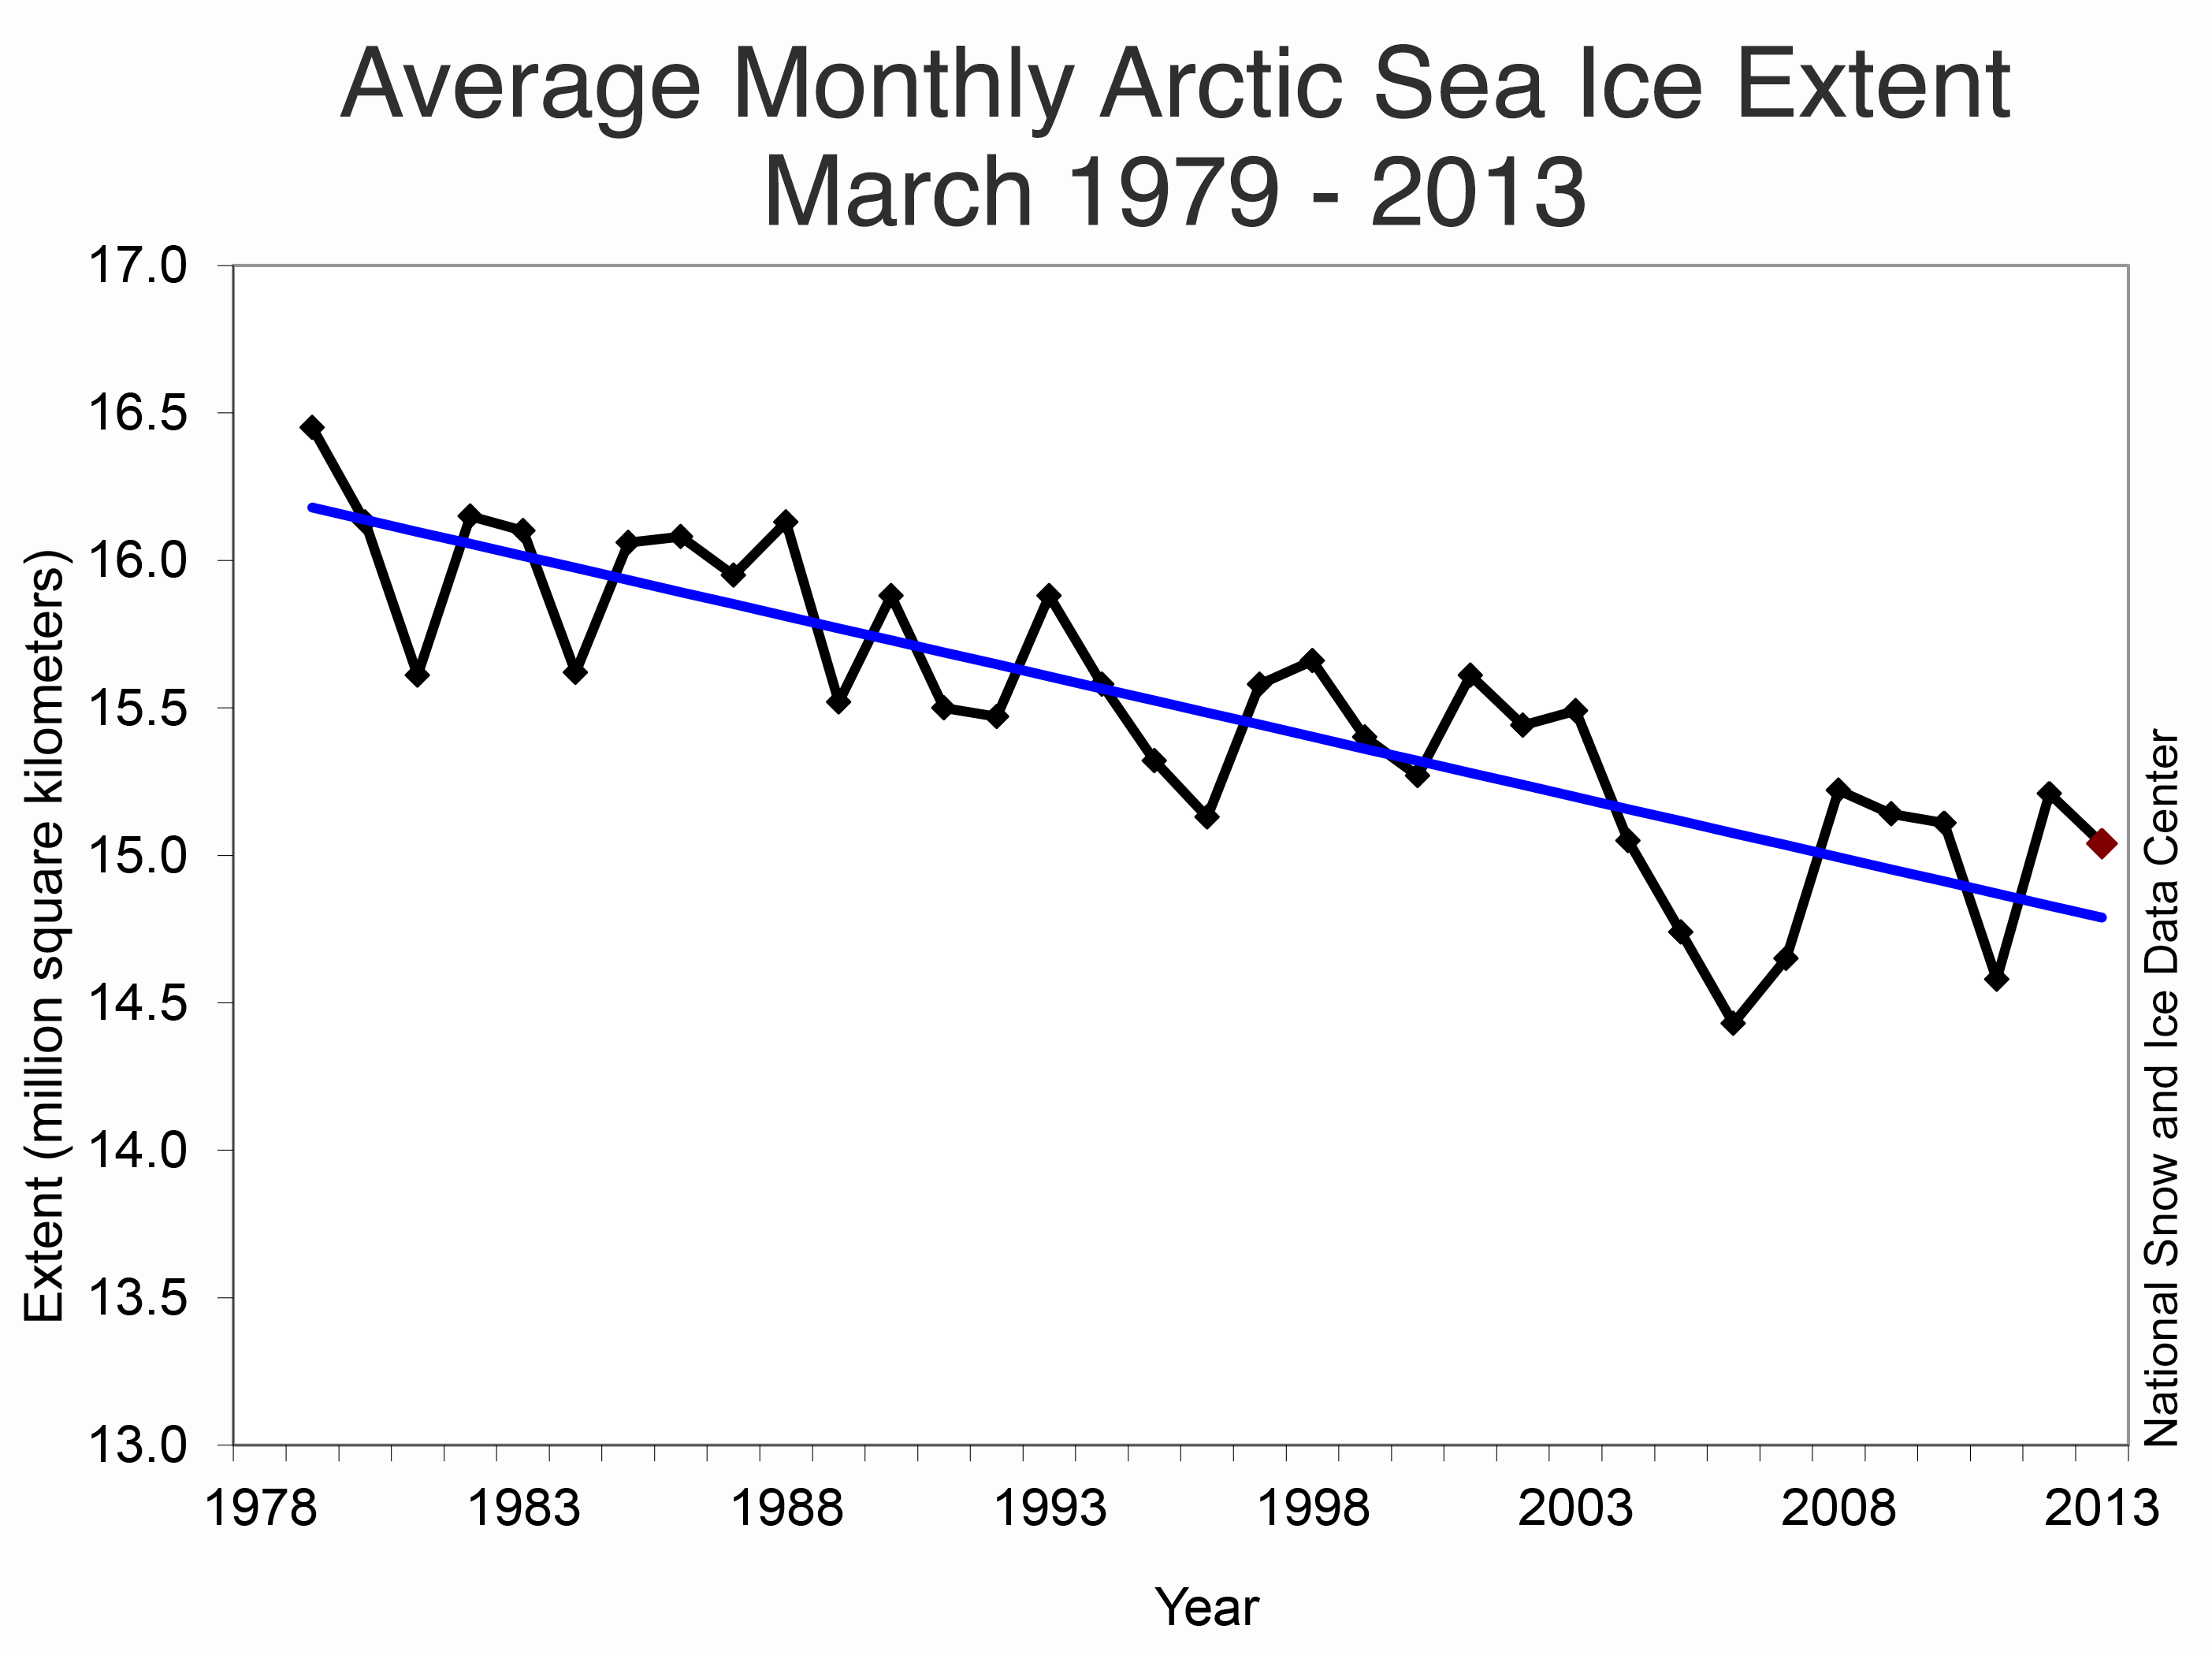
Figure 3. Monthly March ice extent for 1979-2013 shows a decline of 2.5% per decade. Credit: National Snow and Ice Data Center. High-resolution image
Average ice extent for March 2013 was the fifth lowest for the month in the satellite record. Through 2013, the linear rate of decline for March ice extent is 2.5% per decade relative to the 1979-2000 average. While the percentage trend is lower than in the summer, the average rate of decrease is 39,800 square kilometers (15,300 square miles) per year, roughly the size of Maryland and Delaware combined.
A record extent of first-year ice in the Arctic
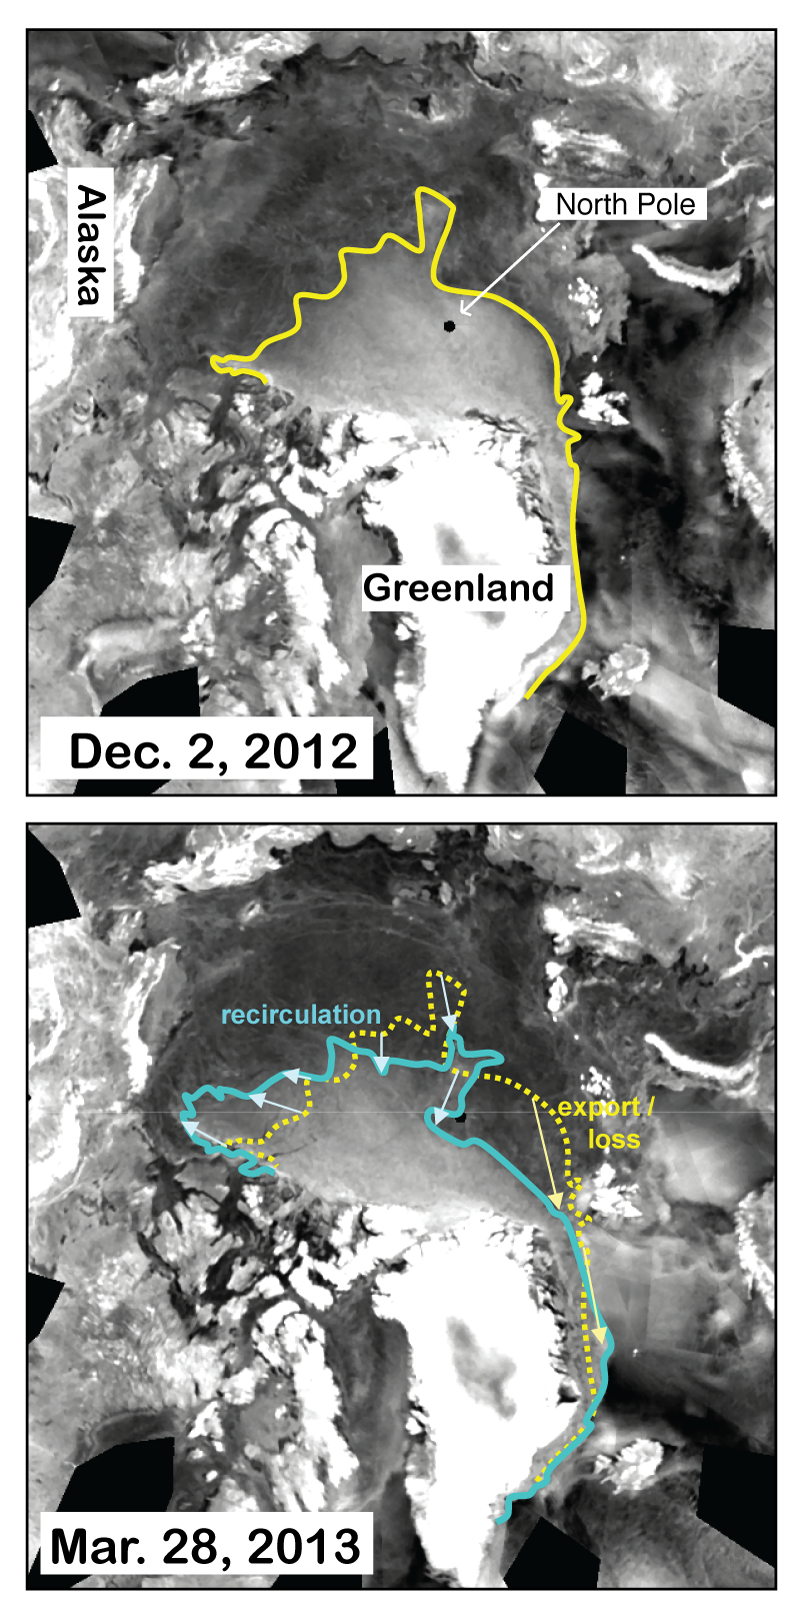
Figure 4. Imagery from the European Advanced Scatterometer (ASCAT) for December 2, 2012 (top) and March 28, 2013 (bottom) show the change in multiyear ice coverage over the winter season, as outlined by the colored lines. In winter, multiyear ice changes are due to the motion of the ice, either export through Fram Strait or redistribution within the Arctic Ocean.Credit: Advanced Scatterometer imagery courtesy NOAA NESDIS, analysis courtesy T. Wohlleben, Canadian Ice Service. High-resolution image
Between the 2012 summer minimum and the 2013 winter maximum, sea ice extent increased 11.72 million square kilometers (4.53 million square miles), the largest increase in the satellite record. This was primarily due to the extreme record low ice extent in September 2012, which resulted in a near-record high first-year ice extent. This is evident in imagery from the Advanced Scatterometer (ASCAT) sensor on the European METOP-A satellite provided by National Oceanic and Atmospheric Administration’s National Environmental Satellite, Data, and Information Service (NOAA NESDIS). Analysis by Trudy Wohlleben at Environment Canada indicates that multiyear ice is relegated to areas far from the Alaskan and Eurasian coasts. Over the winter, some multiyear ice recirculated into the Beaufort Sea where significant melt of multiyear ice has occurred in recent summers. Also, some multiyear ice has been lost, as it moved out of the Arctic through Fram Strait. The boundary between primarily first-year ice and multiyear ice is now near the North Pole (indicated by the small black circle near the center of the image), marking the first time since the winter of 2008 that a substantial amount of first-year ice may be covering the pole as we enter the melt season.
Oldest ice continues to decline
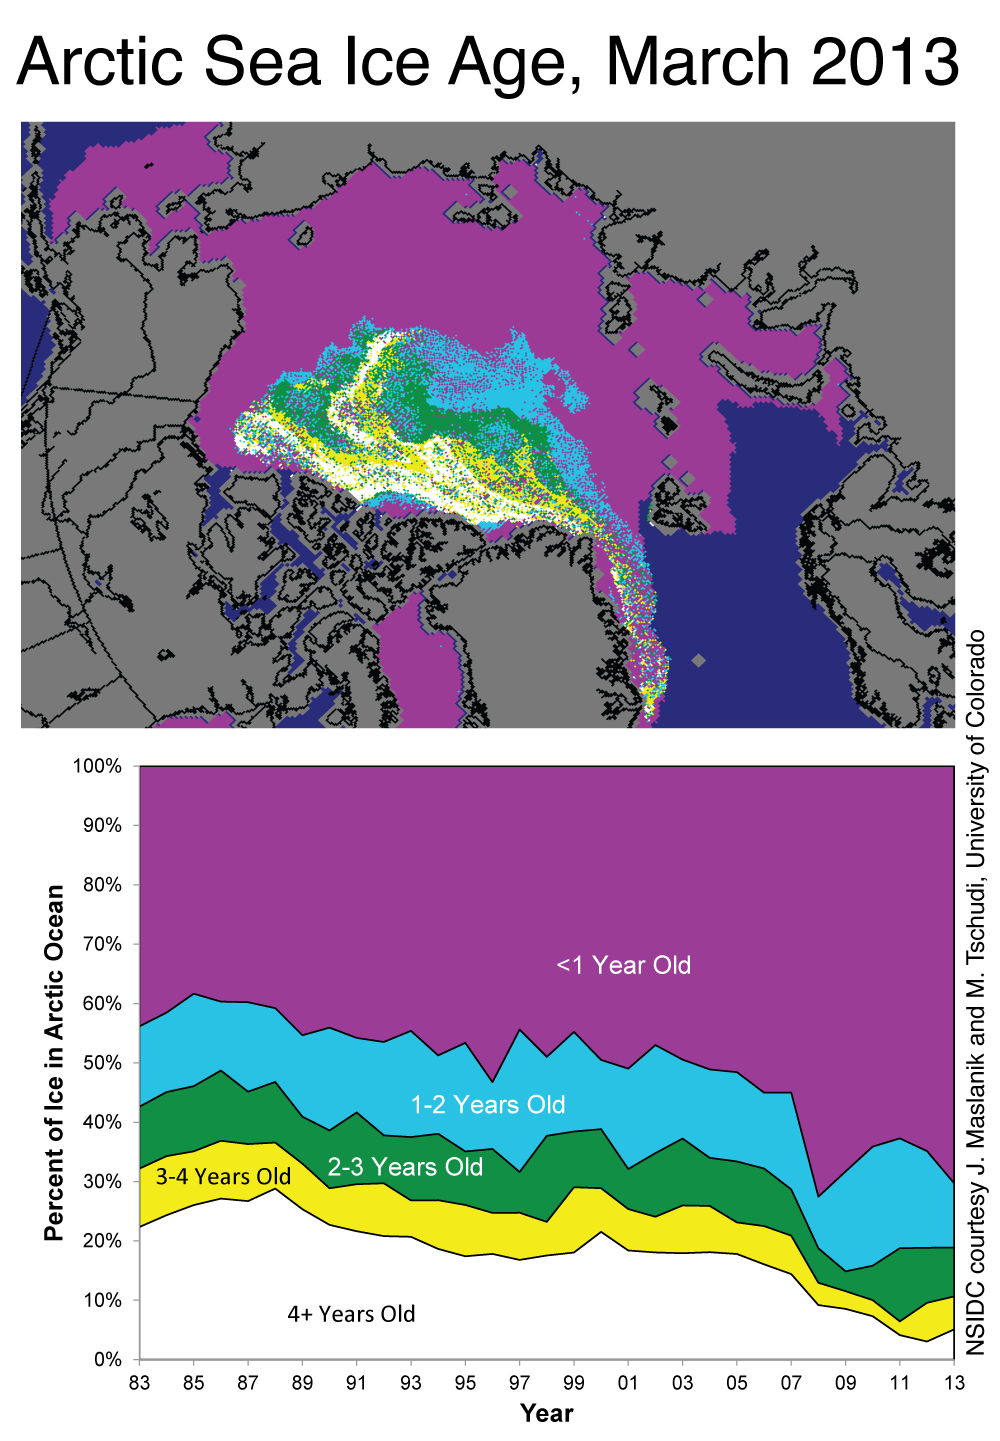
Figure 5. The map at top shows the ages of ice in the Arctic at the end of March 2013; the bottom graph shows how the percentage of ice in each age group has changed from 1983 to 2013.
Credit: NSIDC courtesy J. Maslanik and M. Tschudi, University of Colorado. High-resolution image
Credit: NSIDC courtesy J. Maslanik and M. Tschudi, University of Colorado. High-resolution image
While multiyear ice used to cover up to 60% of the Arctic Ocean, it now covers only 30%. There is a slight rebound in the oldest ice (4+ years old), a remnant of the large amount of first-year ice that formed during the winter after the 2007 record minimum. However, most of that new ice has not survived through the subsequent years. The oldest ice now comprises only 5% of the ice in the Arctic Ocean. This is a slight uptick from last winter’s record low of 3%, but still far less than during the 1980s when old ice covered roughly 25% of the region.
Satellite estimates show continued thinning
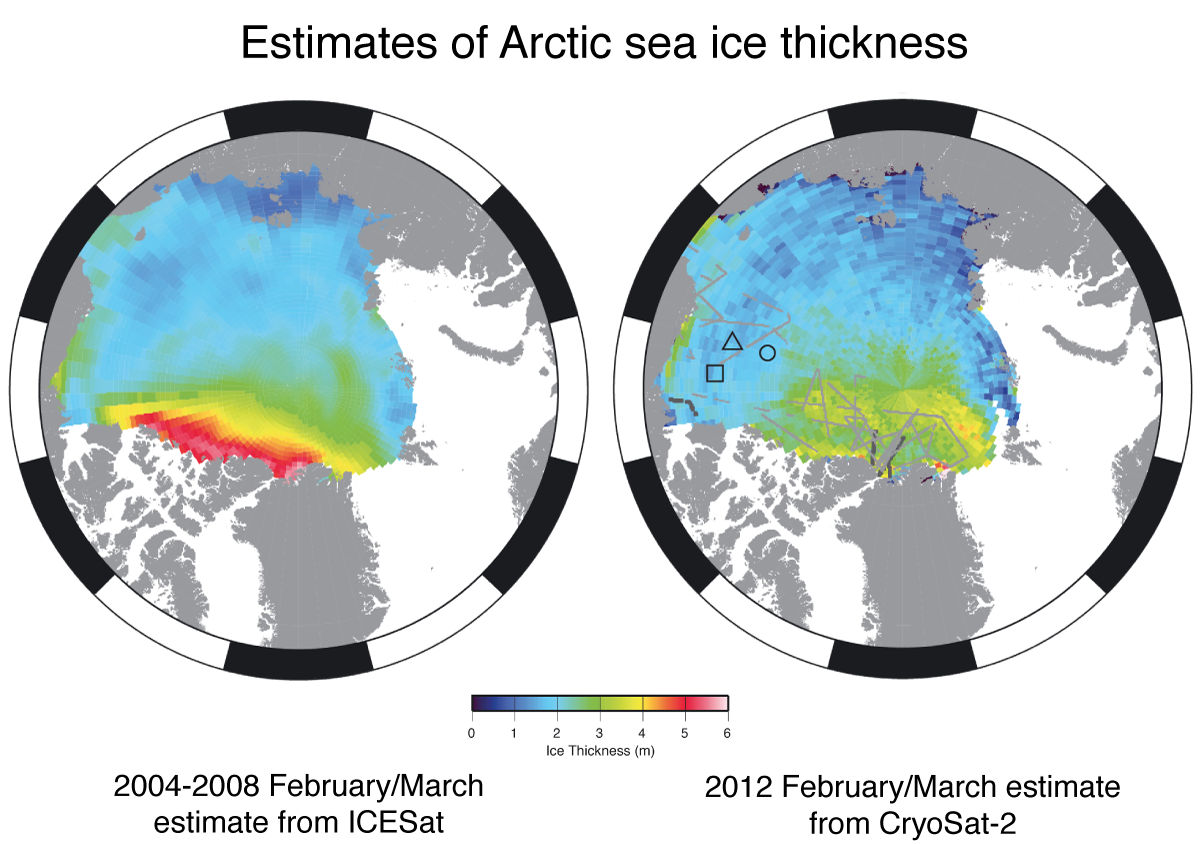
Figure 6. Estimates of February-March average sea ice thickness for 2004-2008 from NASA’s ICESat (left) and February-March 2012 from CryoSat-2 (right). Colors indicate ice thickness in meters, with blue indicating 1-meter thick sea ice and red indicating 5-meter thick sea ice. The black and gray lines in the CryoSat-2 image are tracks of airborne data collected for validation. The triangle, circle, and square are locations of upward-looking sonar (ULS) moorings, also used for validation of the CryoSat-2 estimates.
Credit: American Geophysical Union. High-resolution image
Credit: American Geophysical Union. High-resolution image
The ASCAT data and ice age data both suggest a continued thinning of the ice pack, and overall decline in its volume, but they do not provide direct information on ice thickness. However, the European Space Agency’s CryoSat-2 satellite, launched in April 2010, now provides estimates of sea ice thickness distribution across the Arctic Ocean. A new paper by Laxon et al. (2013) shows the first published results from CryoSat-2 and compares them with thickness estimates from NASA’s ICESat satellite, which operated from 2003 to 2009. The CryoSat-2 results indicate continued thinning since 2008. Significantly, ice along the north coast of Greenland appears to have thinned—in the past this has been the site of some of the thickest sea ice in the Arctic. The paper also shows that total volume estimates from CryoSat-2 agree well with University of Washington’s Pan-Arctic Ice Ocean Modeling and Assimilation System (PIOMAS) estimates.
In memoriam
We dedicate this post to Seymour Laxon, who tragically passed away in early January. Laxon was a driving force behind the CryoSat-2 mission, a leading innovator in the development of sea ice altimetry, an outstanding scientist, and a great friend to the sea ice community, including the contributors to Arctic Sea Ice & News Analysis.
Further reading
Laxon S. W. , K. A. Giles, A. L. Ridout, D. J. Wingham, R. Willatt, R. Cullen, R. Kwok, A. Schweiger, J. Zhang, C. Haas, S. Hendricks, R. Krishfield, N. Kurtz, S. Farrell, and M. Davidson. 2013. CryoSat-2 estimates of Arctic sea ice thickness and volume, Geophysical Research Letters, 40, doi: 10.1002/grl.50193


No comments:
Post a Comment