Readers, I am adding a graphic showing that the negative Arctic Oscillation goes all the way back to early October 2012. I was going to post on this a few weeks ago, but wondered if this -AO had occurred over such a long time period before. I found some data that seemed to show that this had occurred once in the 1970s, but I don't think the numbers were as extreme. Need to find more info on this.

acquired January 1 - April 1, 2013
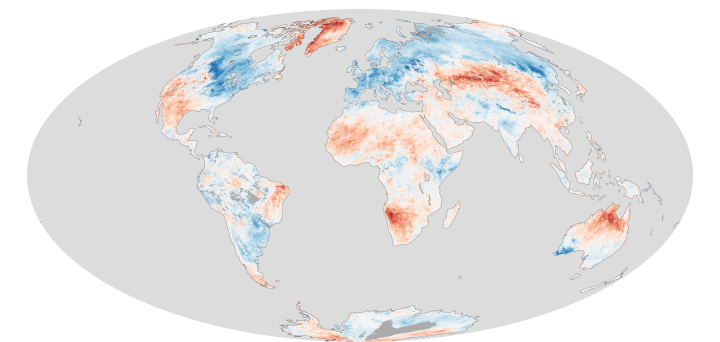
While a high-pressure weather system brought warmer than normal temperatures to Greenland and northern Canada in March 2013, much of North America, Europe, and Asia shivered through weeks of unseasonably cool temperatures. The contrasting temperatures are no coincidence: the same unusual pressure pattern in the upper atmosphere caused both events.
Atmospheric pressure patterns are constantly in flux, as air masses of differing temperatures and densities move around the skies. One key measure of pressure that meteorologists track closely is known as the Arctic Oscillation (AO) index, the difference in relative pressure between the Arctic and the mid-latitudes. Changes in the AO have can major impacts on weather patterns around the world.
When the AO index is in its “positive” phase, air pressure over the Arctic is low, pressure over the mid-latitudes is high, and prevailing winds confine extremely cold air to the Arctic. But when the AO is in its ”negative“ phase, the pressure gradient weakens. The pressure over the Arctic is not as low and pressure at mid-latitudes is not as high. In this negative phase, the AO enables Arctic air to flow to the south and warm air to move north.
In late March, the AO dropped as low as -5.6. The temperature anomaly map above, based on data from theModerate Resolution Imaging Spectroradiometer (MODIS) on NASA’s Aqua satellite, shows how this affected temperatures in the Northern Hemisphere. The map displays land surface temperature anomalies between March 14–20, 2013, compared to the same dates from 2005 to 2012. Areas with above-average temperatures appear in red and orange, and areas with below-average temperatures appear in shades of blue. Much of Europe, Russia, and the eastern United States saw unusually cool temperatures, while Greenland and Nunavut Territory were surprisingly warm for the time of year.
Many parts of the Northern Hemisphere saw near record-breaking cool temperatures as the value of the AO fell. The United Kingdom experienced its 4th coldest March since 1962. In late-March, two-thirds of weather stations in the Czech Republic broke records. Germany saw its coldest March since 1883. And Moscow had its coldest March since the 1950s.
References
- Climate Central (2013, March 19) From Heat Wave to Snowstorms, March Goes to Extremes. Accessed April 1, 2013.
- Der Spiegel Online International (2013, March 28) White Easter: Germany Faces Coldest March Since 1883.Accessed April 2, 2013.
- Earthsky (2013, March 22). Officially spring, but feels like winter for many in U.S. Accessed April 1, 2013.
- Met Office (2013, March 28) Coldest March for the UK since 1962. Accessed April 2, 2013.
- NOAA Arctic Oscillation (AO). Accessed April 1, 2013.
- Washington Post (2013, March 24) Record blocking patterns fueling extreme weather: detailed look at why it’s so cold. Accessed April 1, 2013.
- Prague Daily Monitor (2013, March 28) Cold weather breaking records. Accessed April 2, 2013.
- Instrument: Terra - MODIS
- http://earthobservatory.nasa.gov/IOTD/view.php?id=80804
NASA Earth Observatory image by Jesse Allen and Robert Simmon, using MODIS data from the Land Processes Distributed Active Archive Center (LPDAAC). Arctic Oscillation data from the NOAA National Weather ServiceClimate Prediction Center. Caption by Adam Voiland.


No comments:
Post a Comment