NSIDC, July 6, 2011
Sea ice enters critical period of melt season
Arctic sea ice extent for June 2011 was the second lowest in the satellite data record since 1979, continuing the trend of declining summer ice cover. Average ice extent fell below that for June 2007, which had the lowest minimum ice extent at the end of summer. However, ice extent this year was greater than in June 2010. The sea ice has entered a critical period of the melt season: weather over the next few weeks will determine whether the Arctic sea ice cover will again approach record lows.
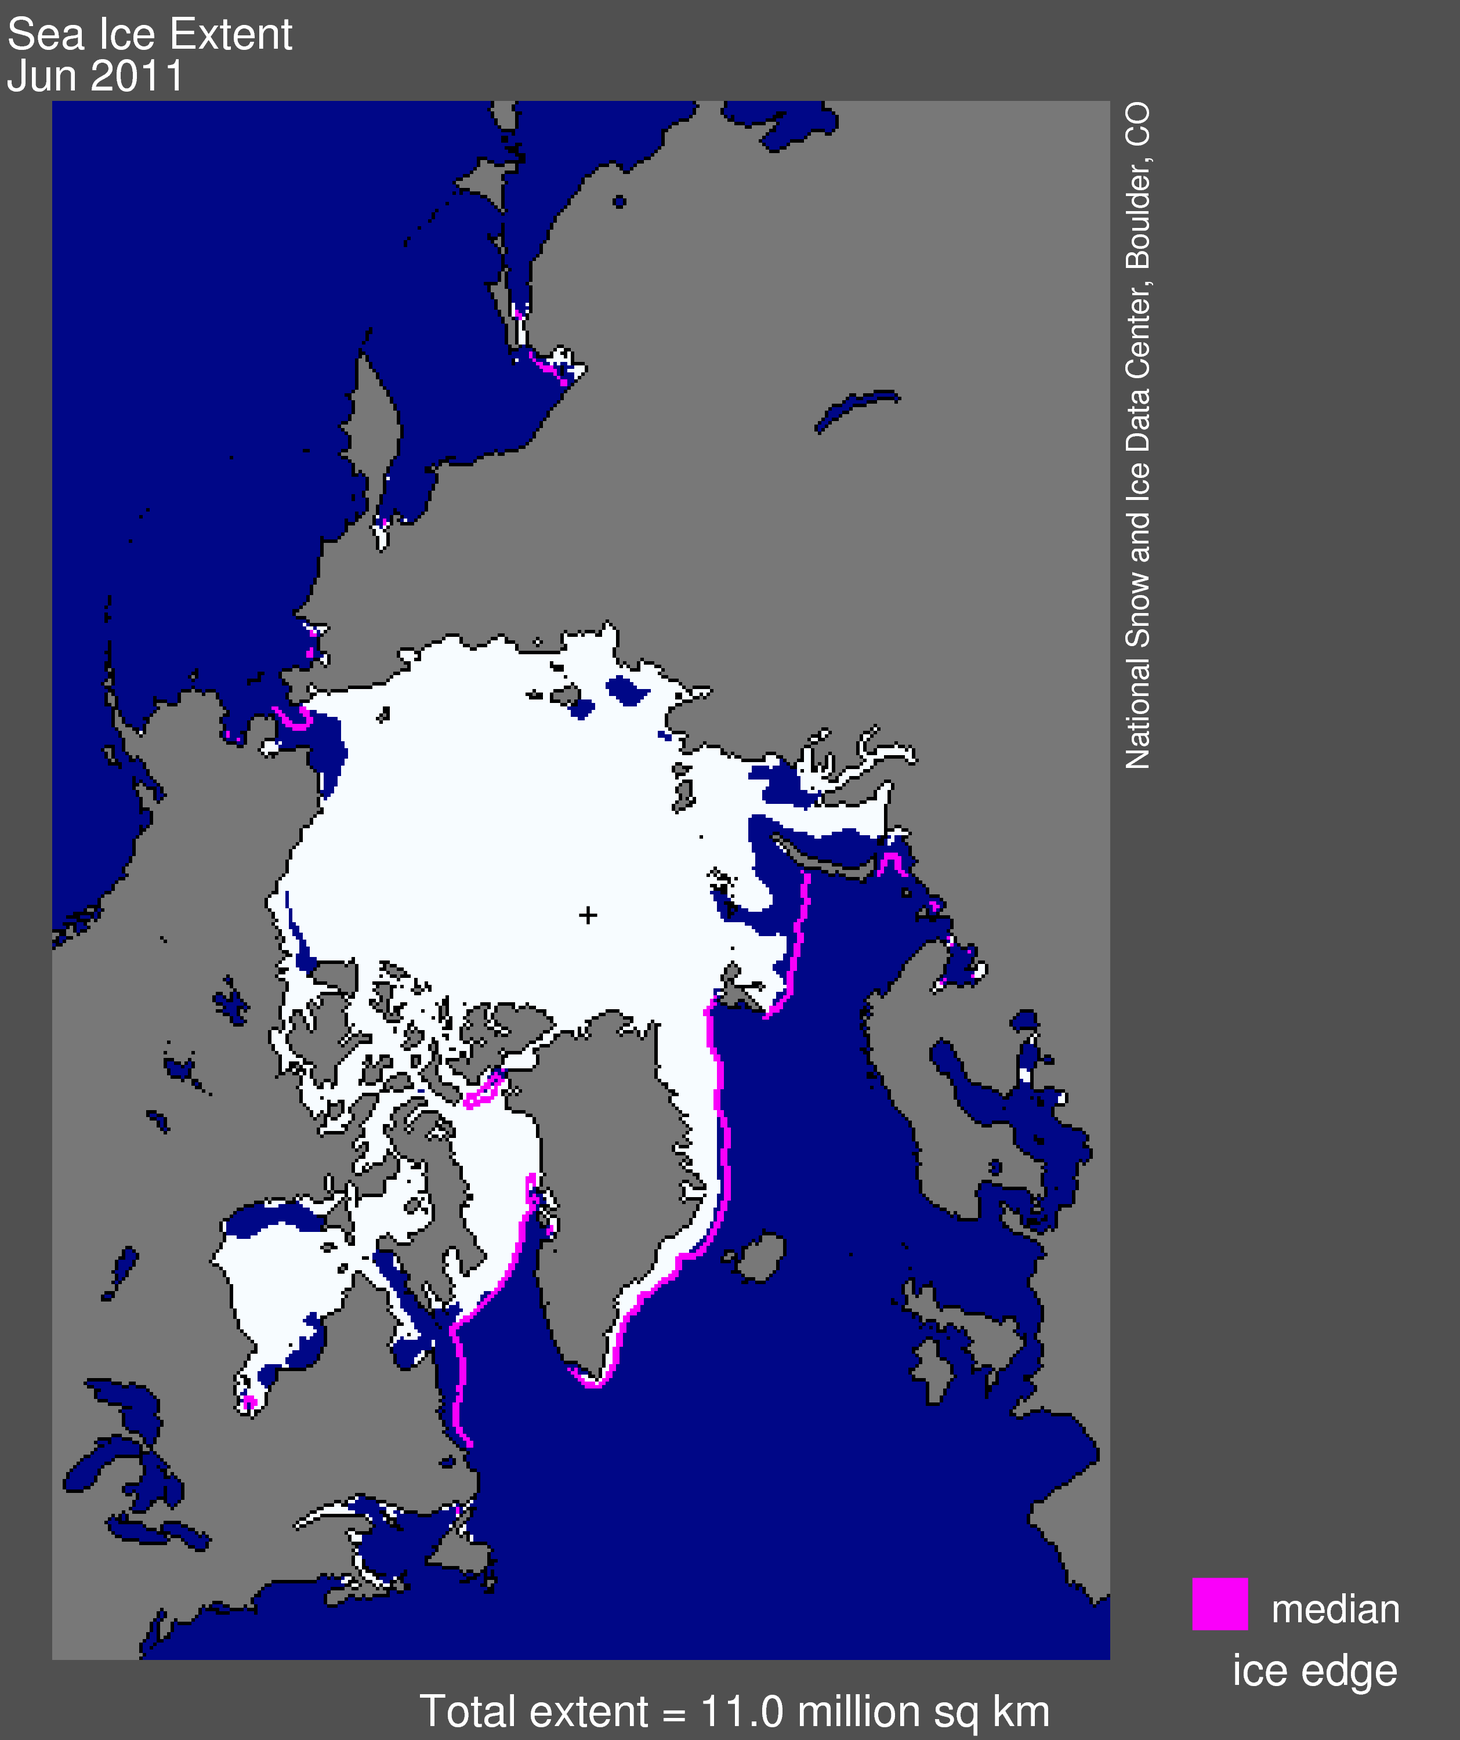 Figure 1. Arctic sea ice extent for June 2011 was 11.01 million square kilometers (4.25 million square miles). The magenta line shows the 1979 to 2000 median extent for that month. The black cross indicates the geographic North Pole. Sea Ice Index data. About the data. —Credit: National Snow and Ice Data Center. High-resolution image
Overview of conditions
Average ice extent for June 2011 was 11.01 million square kilometers (4.25 million square miles). This is 140,000 square kilometers (54,000 square miles) above the previous record low for the month, set in June 2010, and 2.15 million square kilometers (830,000 square miles) below the average for 1979-2000.
June ice extent was lower than normal in much of the Arctic, but the Kara Sea region had particularly low ice extent. Ice has also started to break up off the coast of Alaska in the Beaufort Sea. These open water areas absorb the sun's energy, which will help to further ice melt through the summer.
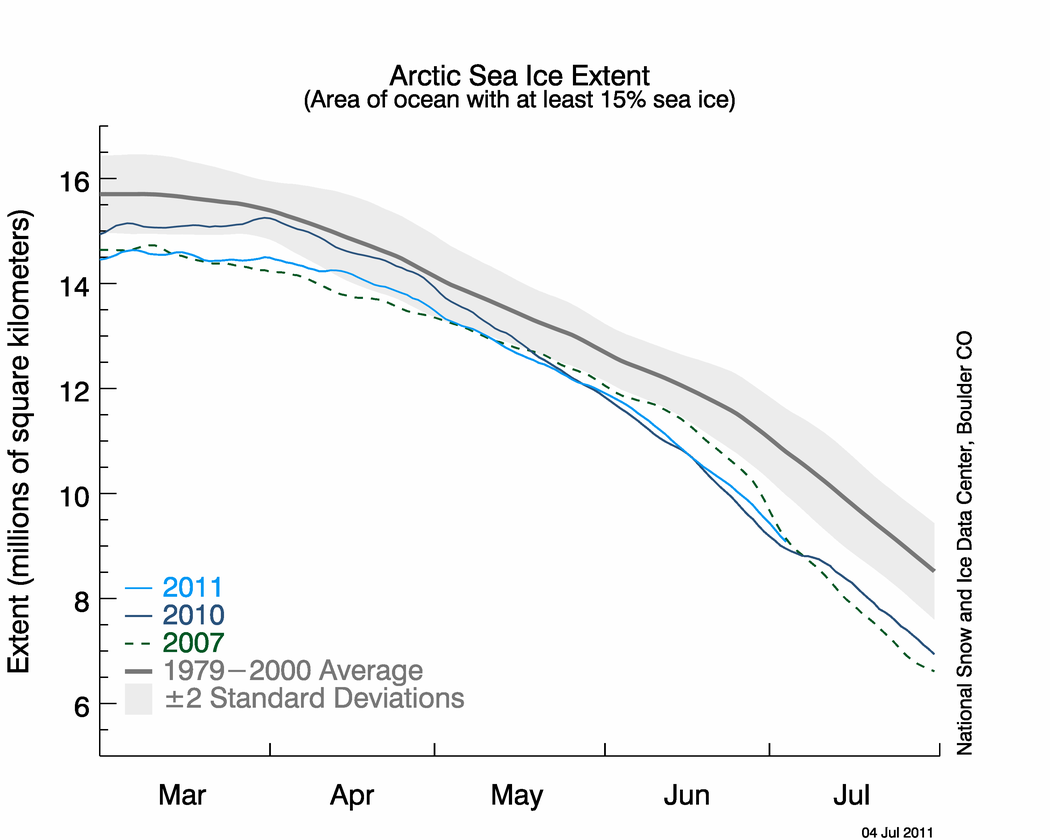 Figure 2. The graph above shows daily Arctic sea ice extent as of July 4, 2011, along with daily ice extents for previous low-ice-extent years in the month of May. Light blue indicates 2011, dashed green shows 2007, dark blue shows 2010, and dark gray shows the 1979 to 2000 average. The gray area around the average line shows the two standard deviation range of the data. Sea Ice Index data. —Credit: National Snow and Ice Data Center. High-resolution image
Conditions in contextIce extent during June 2011 declined at an average rate of 80,800 square kilometers (31,200 square miles) per day, about 50% faster than the average decline rate for June 1979-2000. Ice extent declined more slowly than in June 2010, the year with the lowest average ice extent for the month. However, ice declined faster than in June 2007, the year when September sea ice extent reached the lowest in the satellite record. Ice loss in the Kara Sea was especially fast, more than double the average rate and close to double the rate of the past four years (2007 to 2010). Sea ice has largely disappeared in the southern Kara Sea, which normally still has considerable ice cover at this time of year.
At the end of June, Arctic sea ice extent was 9.54 million square kilometers (3.68 million square miles), 375,000 square kilometers (145,000 square miles) less than the ice extent on June 30, 2007, and 264,000 square kilometers (102,000 square miles) above the record low for June 30, set in 2010.
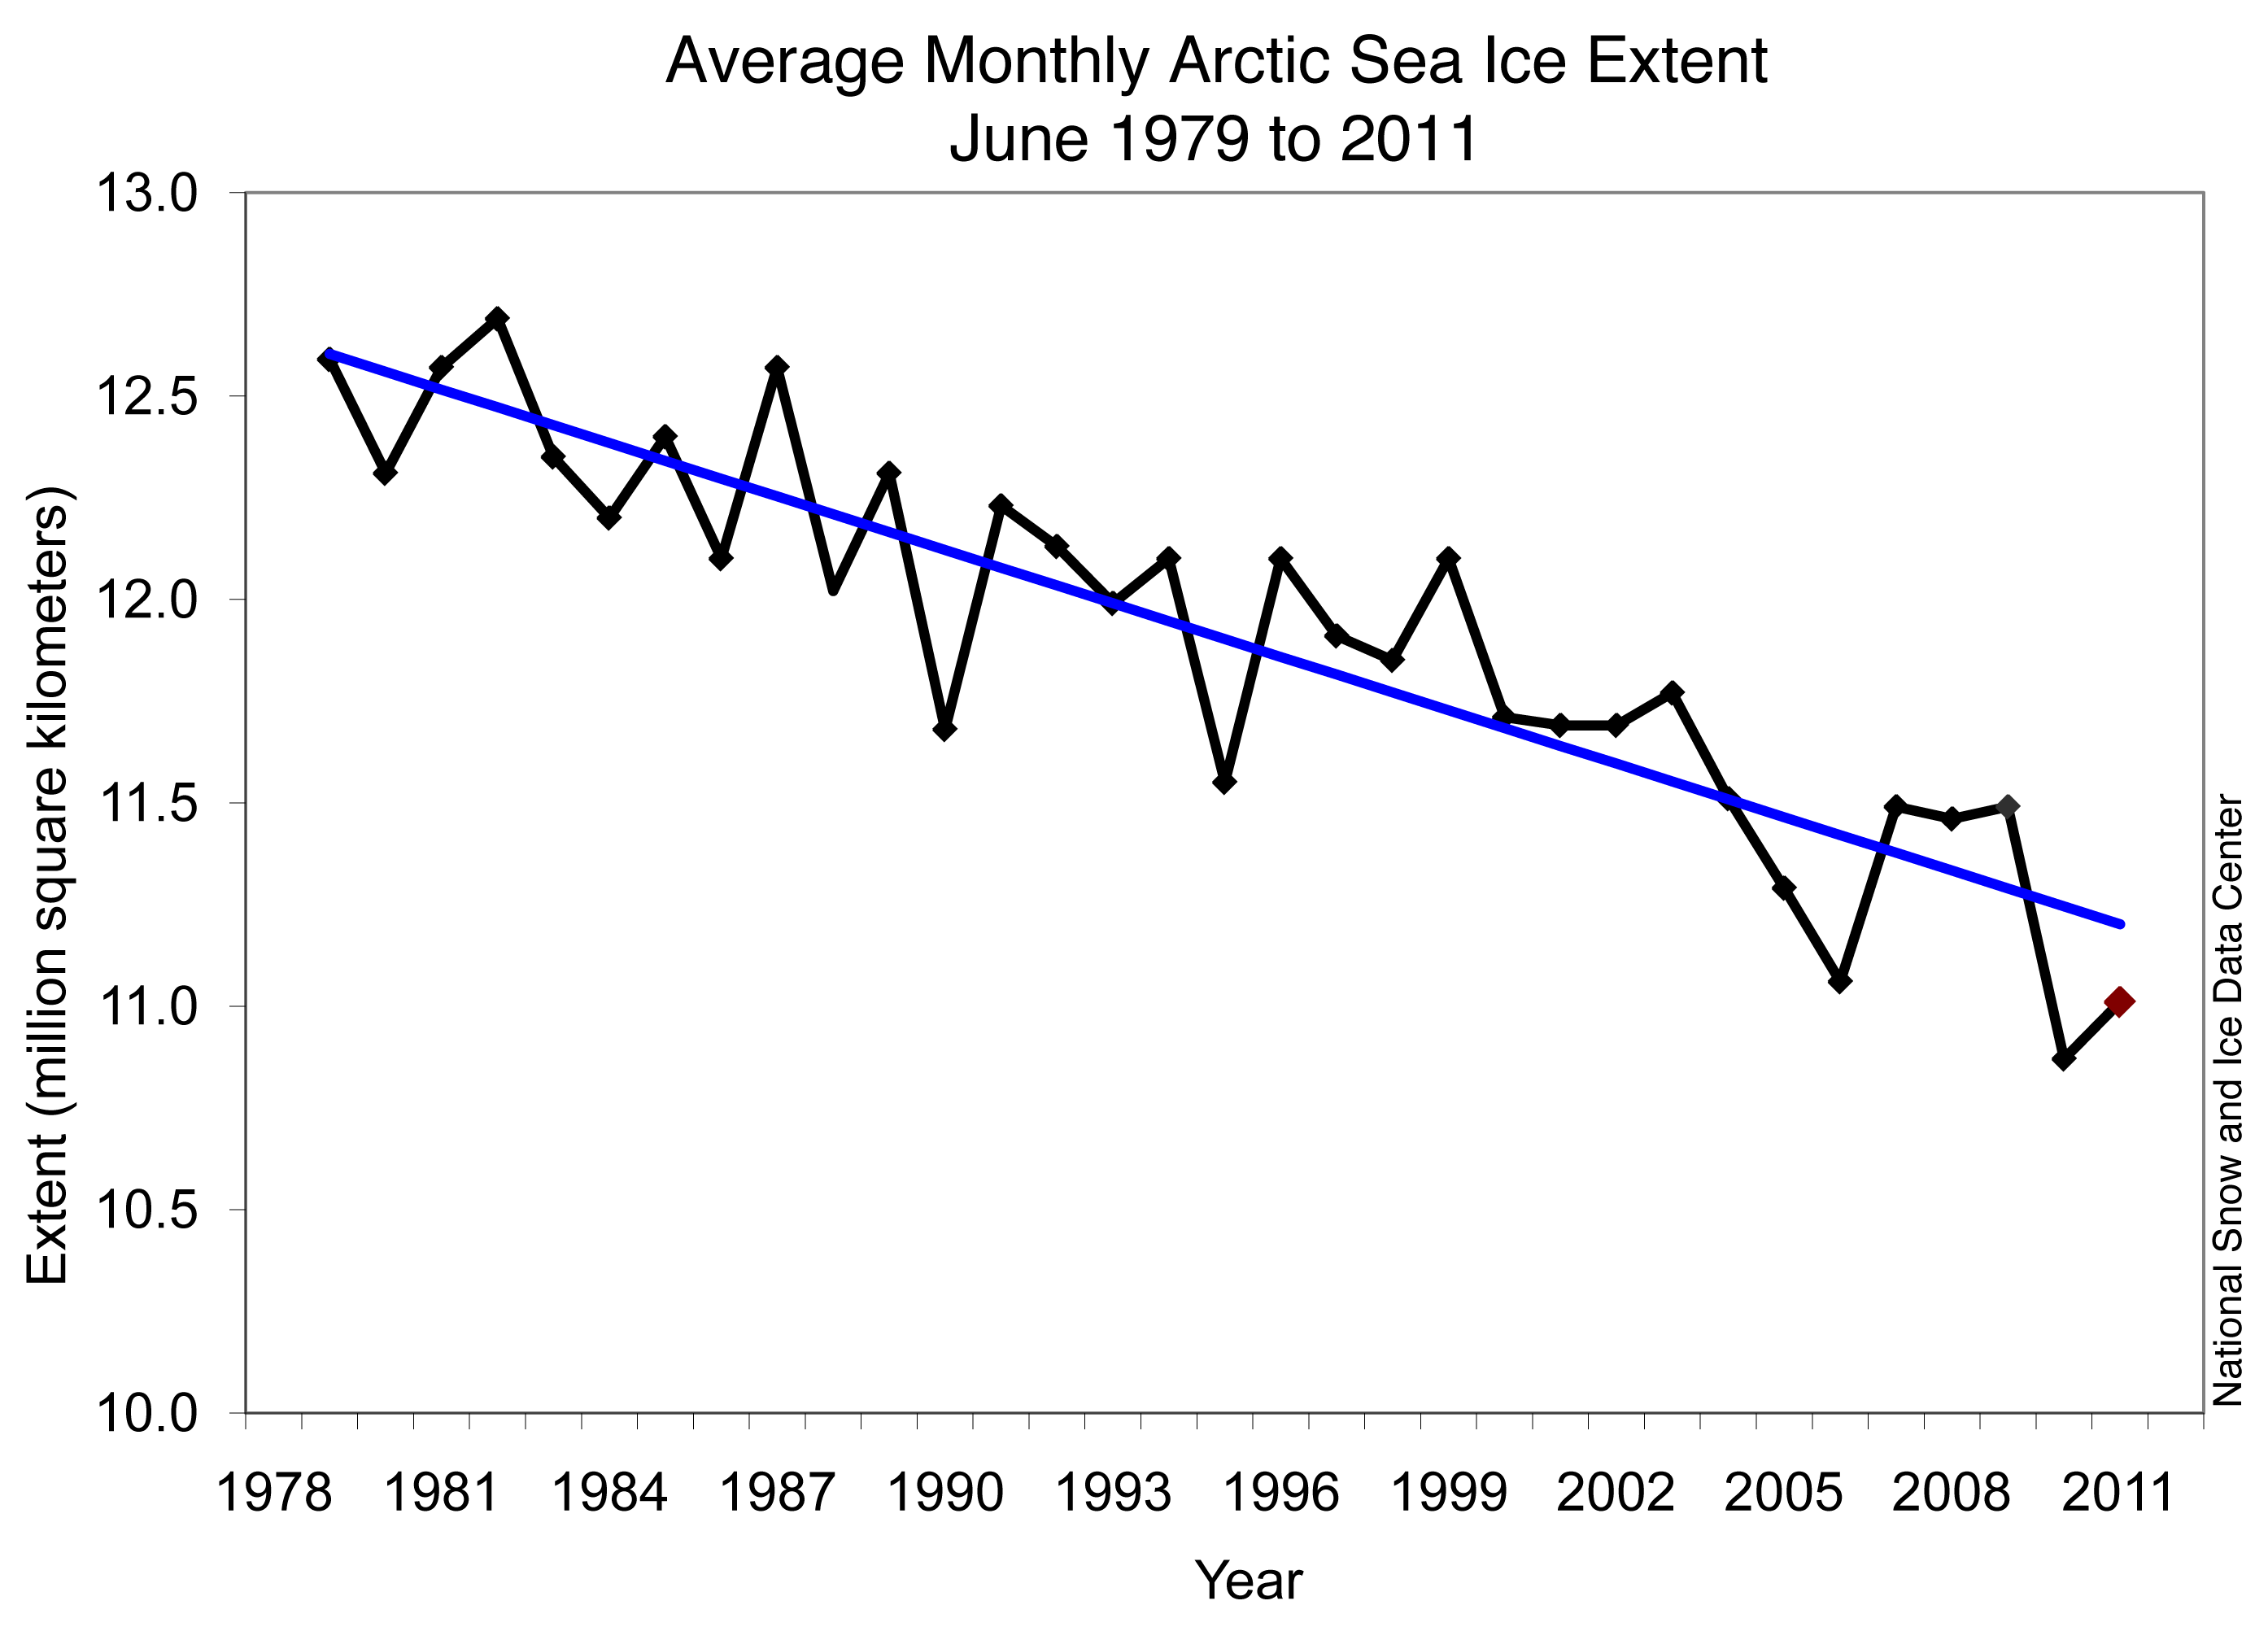 Figure 3. Monthly June ice extent for 1979 to 2011 shows a decline of 3.6% per decade.
 —Credit: National Snow and Ice Data Center.
High-resolution image
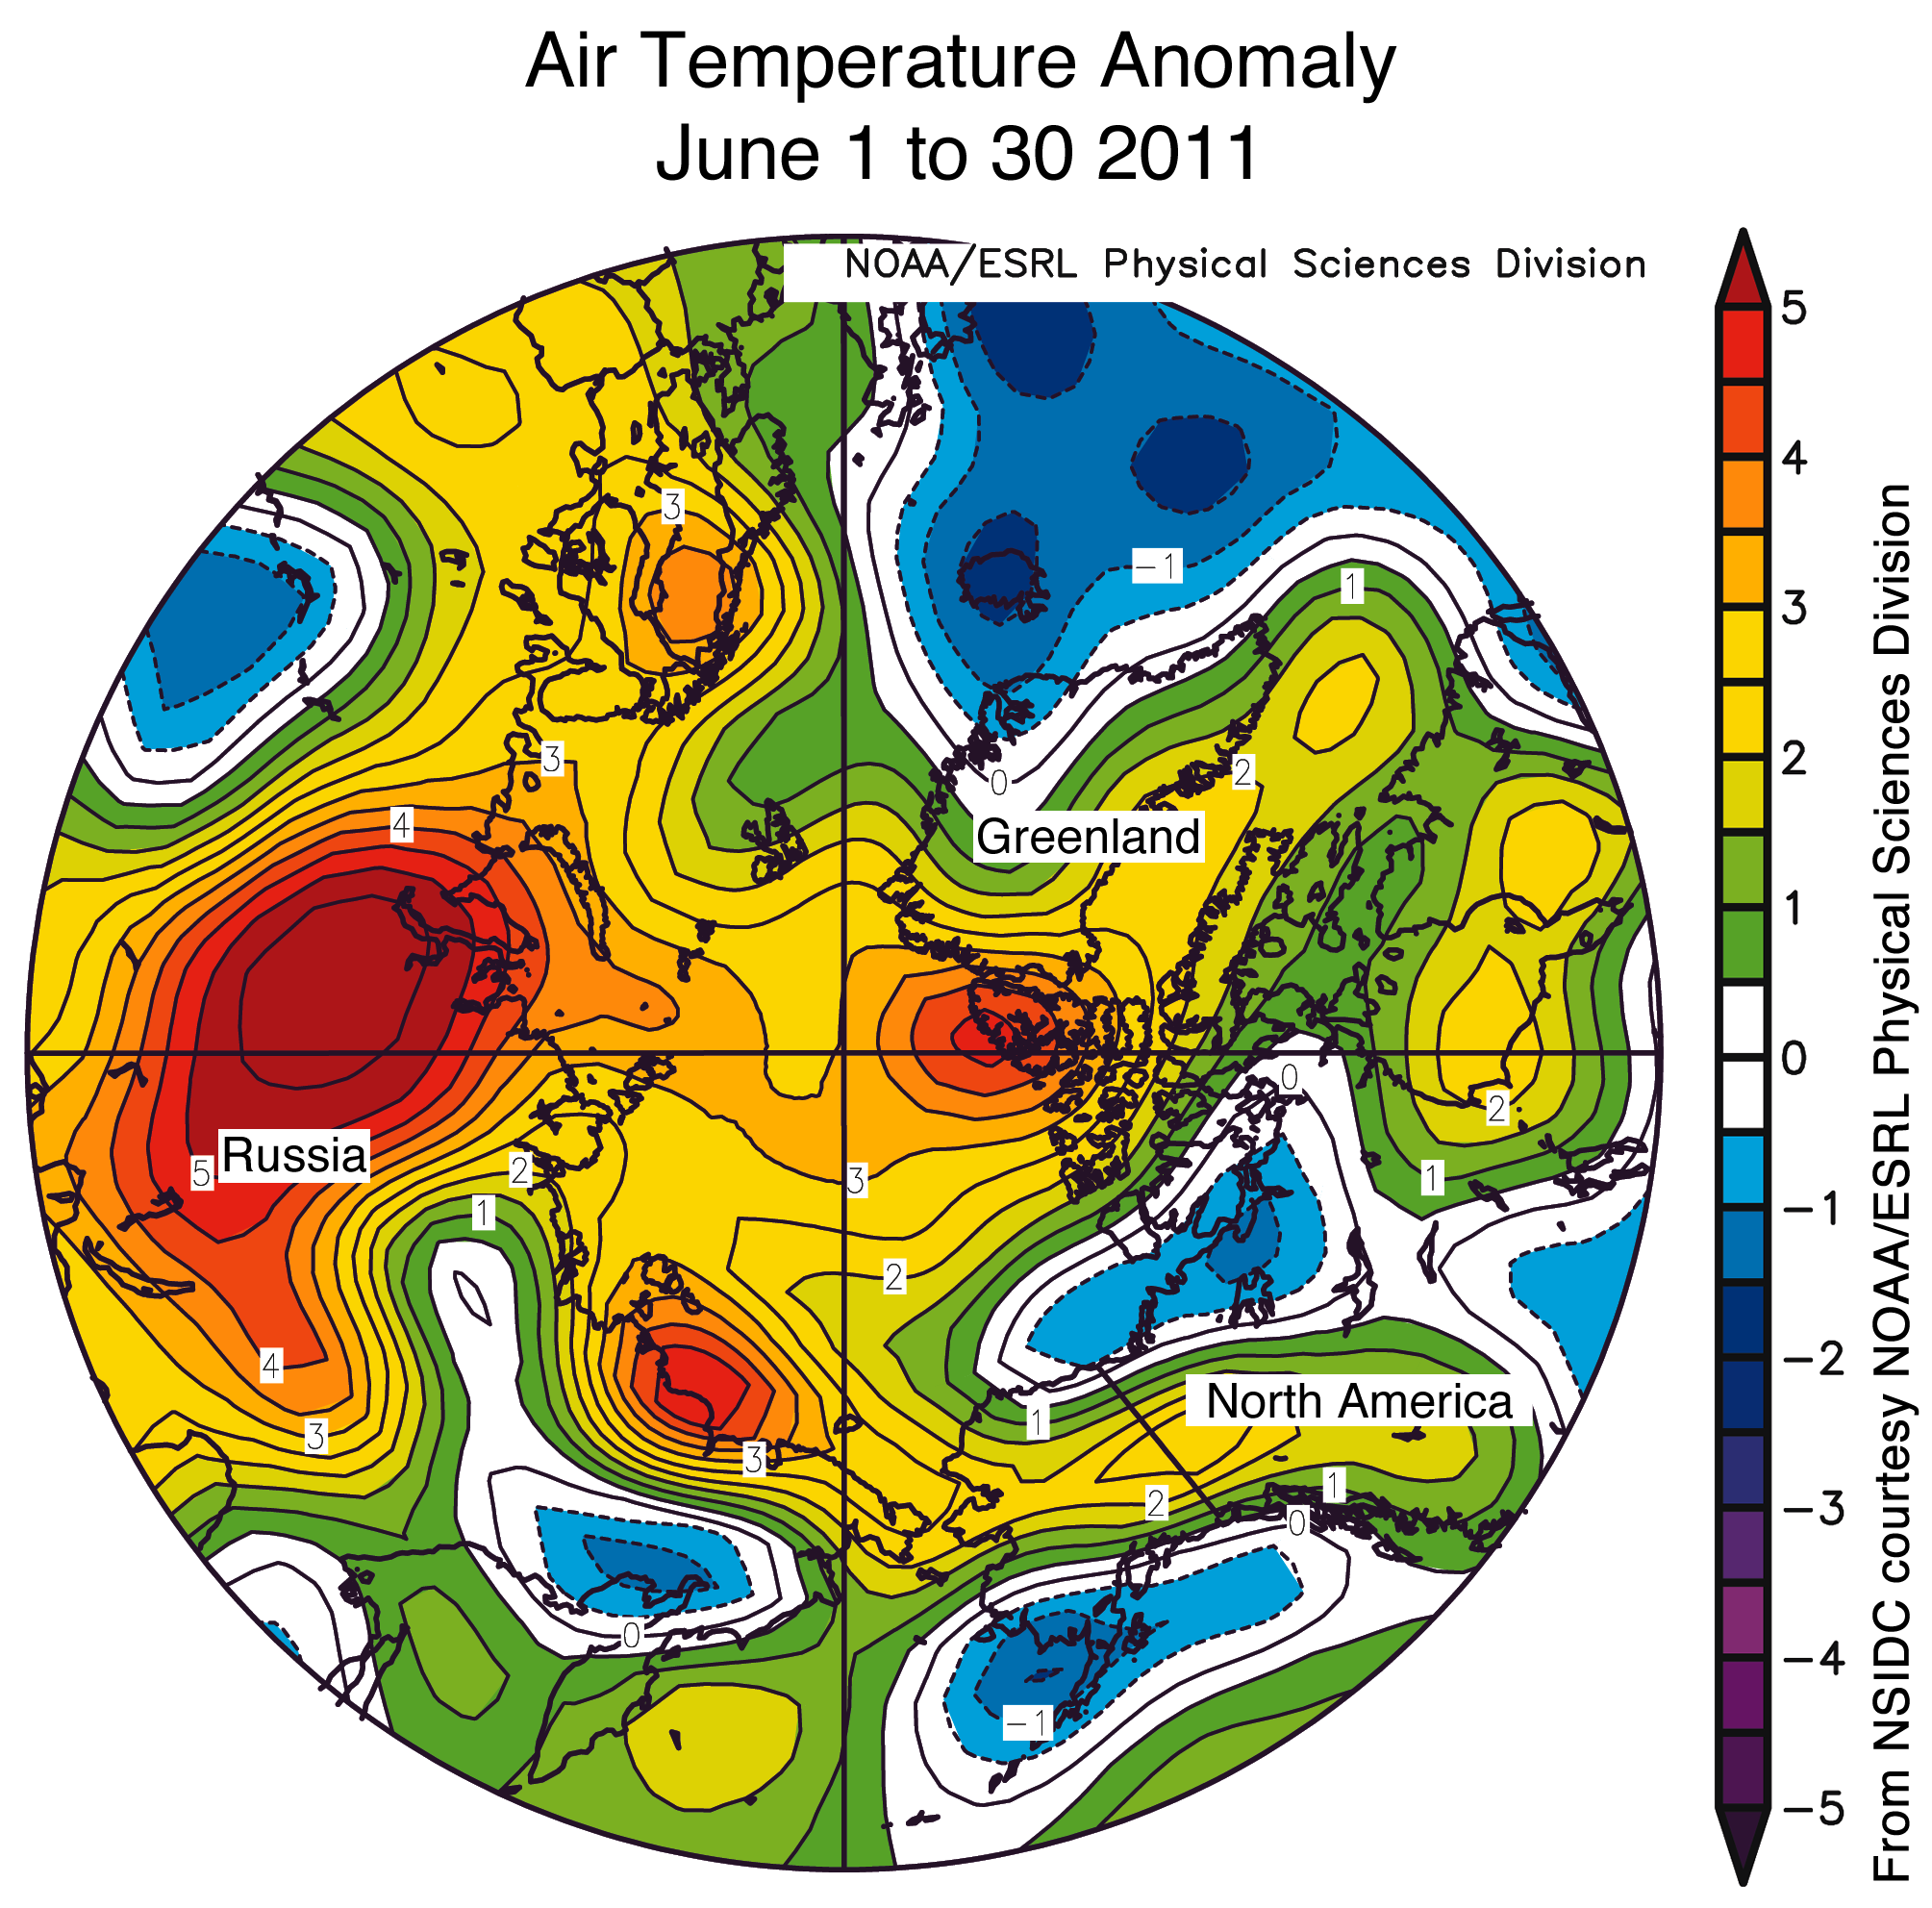 Figure 4. This map of air temperature anomalies for June 2011 shows warmer than average temperatures over much of the Arctic Ocean, except in the Greenland and Beaufort seas, where temperatures were near and slightly below normal. —Credit: NSIDC courtesy NOAA ESRL PSD. High-resolution image
Warmer than average temperatures continueAir temperatures for June were 1-4 °C (2-7 °F) warmer than average over most of the Arctic Ocean, except in the Beaufort and Greenland seas, where temperatures were near normal or slightly below normal. High pressure dominated most of the central Arctic, with the highest pressures over the Beaufort Sea. The monthly averaged pressure field shows a circulation pattern somewhat similar to a pattern known as the dipole anomaly, with unusually high pressure over the Beaufort Sea and unusually low pressure over central Siberia. Similar patterns have become common in recent summers.
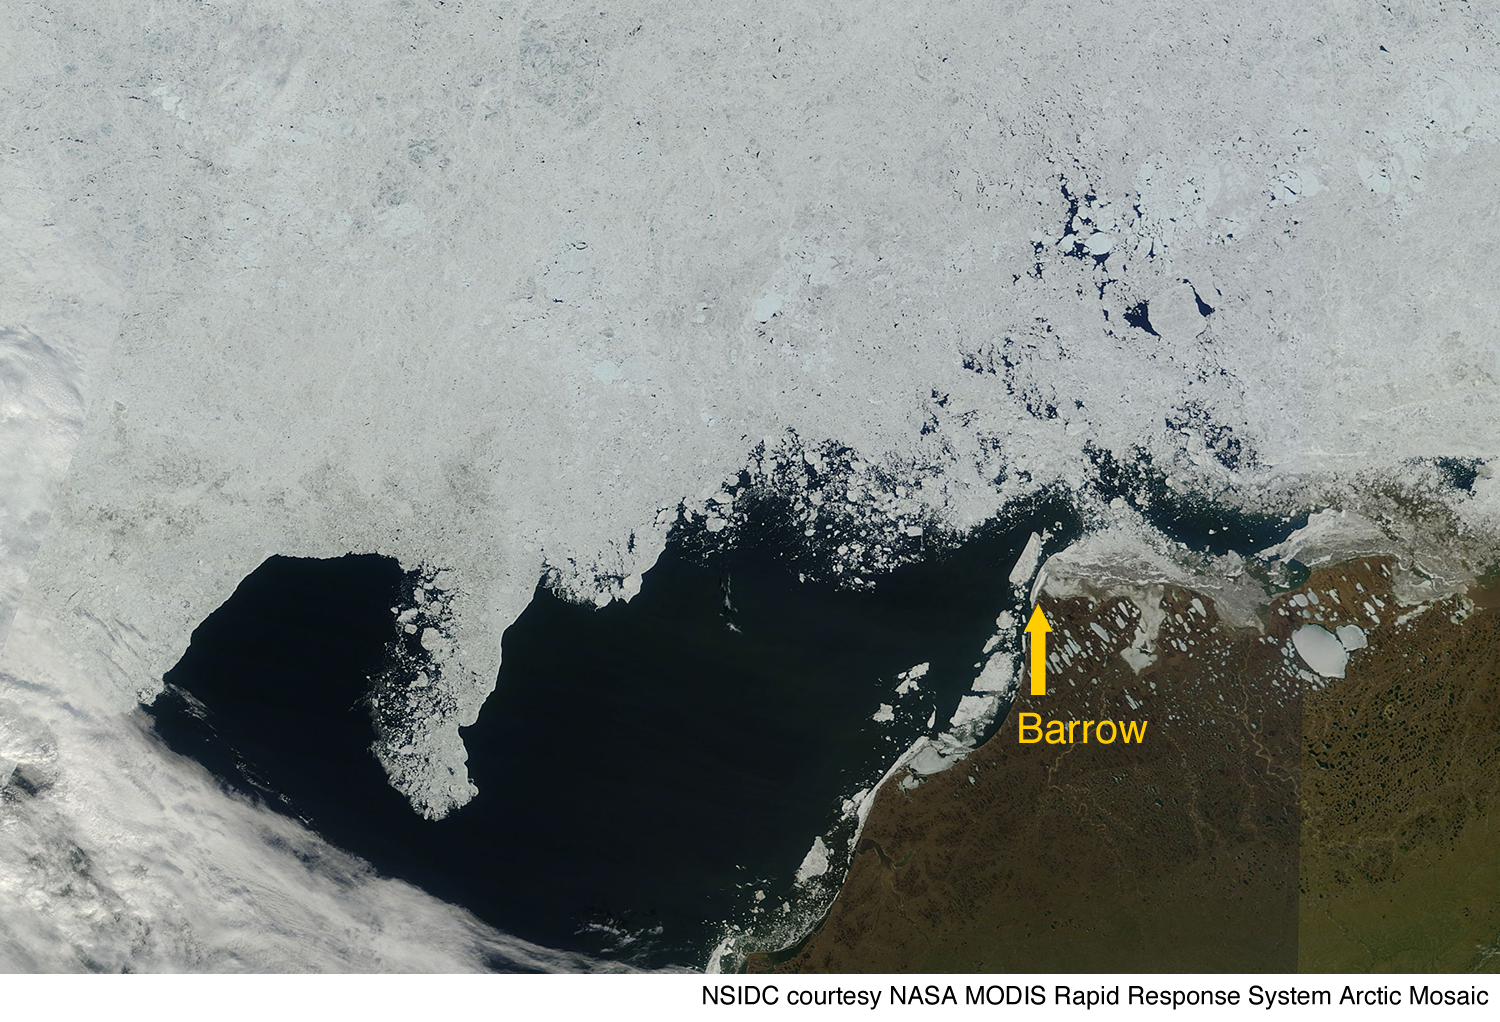 Figure 5. This MODIS image from June 28 shows ice in the Beaufort Sea region off the coast of Barrow, breaking up into smaller floes and open water. But while open water is apparent, a layer of ice still clings to the coastline. —Credit: NSIDC courtesy MODIS Rapid Response System Arctic Mosaic. High-resolution image
A detailed view from MODIS dataData from the NASA Moderate Resolution Imaging Spectroradiometer (MODIS) provide a detailed view of seasonal ice breakup. Along the Alaska coast, large ice floes are breaking away near the coast southwest of Barrow. However, in this image from June 28, a narrow strip of landfast ice remained anchored to the coast, bounded on the seaward side by grounded ridged ice. That last bit of ice broke up around July 3, according to the Geophysical Institute at the University of Alaska, Fairbanks
Sea ice breakup in Barrow is defined as the time when the landfast ice along the coast starts to move. The timing of this breakup is closely tied to the cumulative amount of solar energy input to the Barrow region—the amount of sunshine the area receives—after June 5. The Geophysical Institute uses this relationship to forecast the breakup: this year they predicted the breakup to occur on July 11.
Further Reading
Ocean heat
An article published recently in the journal Science showed that the flow of ocean heat into the Arctic Ocean from the Atlantic is now higher than any time in the past 2000 years. The warm, salty Atlantic water flows up from the mid-latitudes and then cools and sinks below the cold, fresh water from the Arctic. The higher salt content of the Atlantic water means that it is denser than fresher Arctic water, so it circulates through the Arctic Ocean at a depth of around 100 meters (328 feet). This Atlantic water is potentially important for sea ice because the temperature is 1-2 °C (1.5-3.0 °F) above freezing. If that water rose to the surface, it could add to sea ice melt.
An article published recently in the journal Science showed that the flow of ocean heat into the Arctic Ocean from the Atlantic is now higher than any time in the past 2000 years. The warm, salty Atlantic water flows up from the mid-latitudes and then cools and sinks below the cold, fresh water from the Arctic. The higher salt content of the Atlantic water means that it is denser than fresher Arctic water, so it circulates through the Arctic Ocean at a depth of around 100 meters (328 feet). This Atlantic water is potentially important for sea ice because the temperature is 1-2 °C (1.5-3.0 °F) above freezing. If that water rose to the surface, it could add to sea ice melt.
Spielhagen, R.F., K. Werner, S. Sorensen, K. Zamelczyk, E. Kandiano, G. Budeus, K. Husum, T.M. Marchitto, M. Hald. Enhanced modern heat transfer to the Arctic by warm Atlantic Water, Science, 331 (2011) 450-453, 28.
New ice thickness data
The first preliminary map of sea ice thickness data from the European Space Agency's Cryosat-2 was released in June. This radar altimeter measures the height of features such as snow and sea ice on the Earth surface. This initial map is very preliminary and considerable work will be required before the thickness retrievals are validated and useful for scientific study. Researchers expect that Cryosat-2 will eventually provide additional information about changes in sea ice thickness and volume. http://www.esa.int/esaLP/SEMAAW0T1PG_LPcryosat_0.html
The first preliminary map of sea ice thickness data from the European Space Agency's Cryosat-2 was released in June. This radar altimeter measures the height of features such as snow and sea ice on the Earth surface. This initial map is very preliminary and considerable work will be required before the thickness retrievals are validated and useful for scientific study. Researchers expect that Cryosat-2 will eventually provide additional information about changes in sea ice thickness and volume. http://www.esa.int/esaLP/SEMAAW0T1PG_LPcryosat_0.html


No comments:
Post a Comment