Low ice extent in May, but summer melt will depend on weather
Arctic sea ice extent for May 2011 was the third lowest in the satellite data record since 1979, continuing the long-term decline. During the month of May, sea ice declined at a near average rate, while air temperatures in the Arctic remained generally above average. Although ice extent is low for this time of year, ice extent at the end of summer largely depends on weather over the next few months.
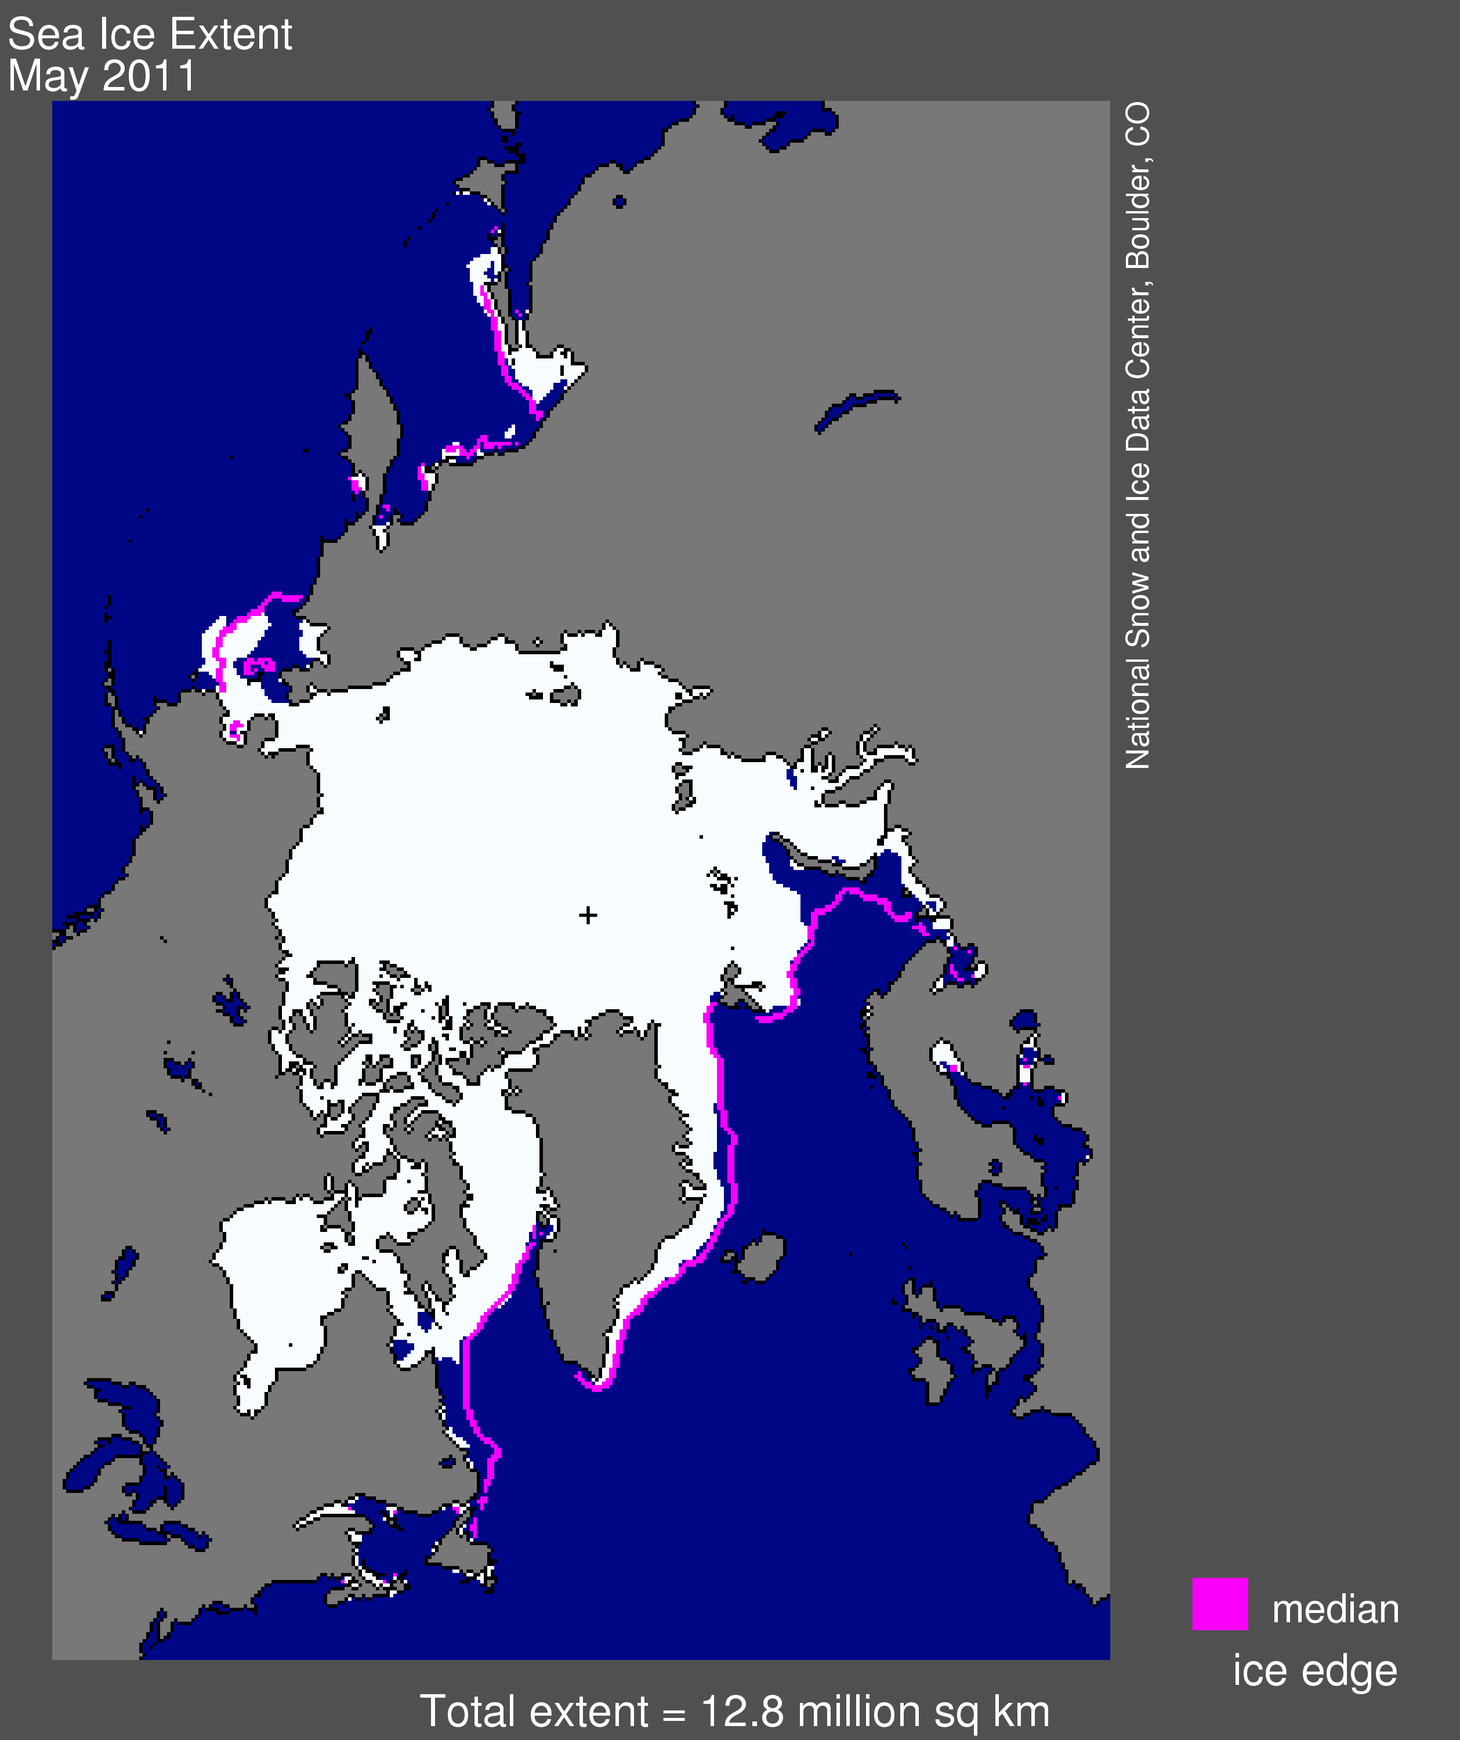 Figure 1. Arctic sea ice extent for May 2011 was 12.79 million square kilometers (4.94 million square miles). The magenta line shows the 1979 to 2000 median extent for that month. The black cross indicates the geographic North Pole. Sea Ice Index data. About the data. —Credit: National Snow and Ice Data Center. High-resolution image
Overview of conditions
Average ice extent for May 2011 was 12.79 million square kilometers (4.94 million square miles). This is 210,000 square kilometers (81,000 square miles) above the previous record low for the month, set in May 2004, and 810,000 square kilometres (313,000 square miles) below the average for the reference period of 1979 to 2000.
Ice extent remained lower than average in the Atlantic sector of the Arctic, including the Kara and Barents seas and the Labrador Sea. During May, areas of open water known as polynyas continued to develop in the Beaufort, Chukchi, and Laptev seas, and Hudson Bay. Those open water areas absorb the sun's energy, which will likely help to hasten further ice melt.
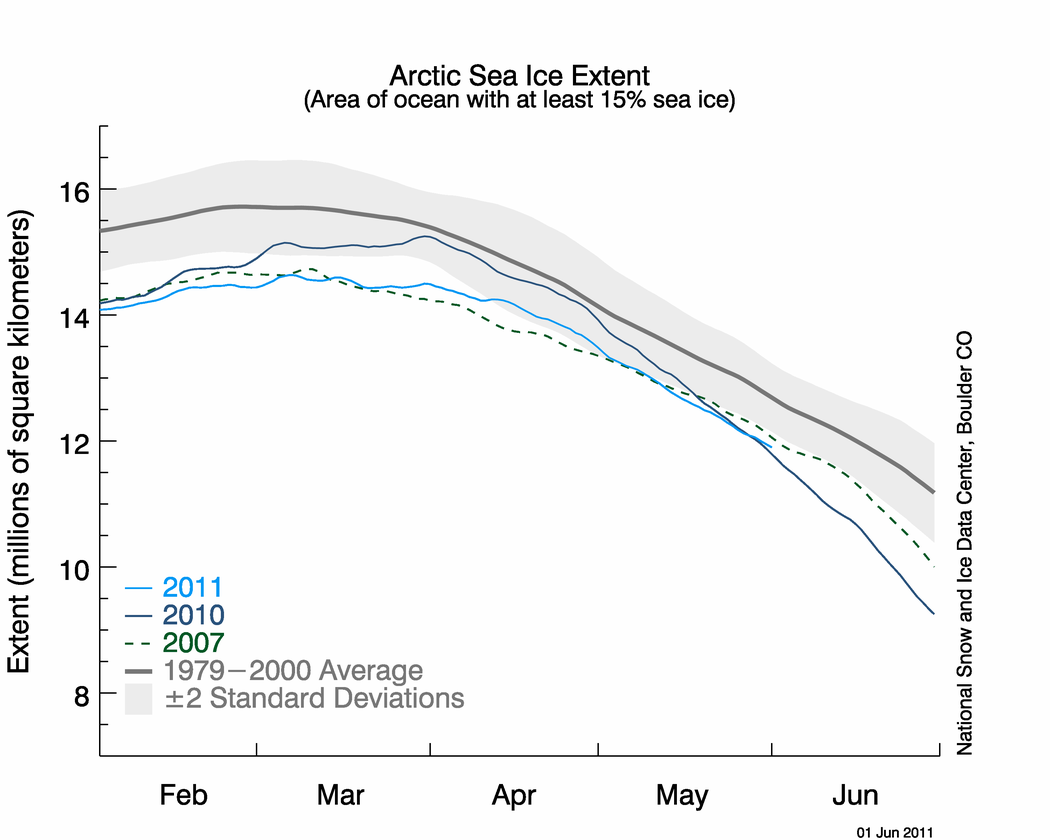 Figure 2. The graph above shows daily Arctic sea ice extent as of June 1, 2011, along with daily ice extents for previous low-ice-extent years in the month of May. Light blue indicates 2011, dashed green shows 2007, dark blue shows 2010, and dark gray shows the 1979 to 2000 average. The gray area around the average line shows the two standard deviation range of the data. Sea Ice Index data. —Credit: National Snow and Ice Data Center. High-resolution image
Conditions in contextIce extent during May 2011 declined at an average rate of 50,720 square kilometers (19,580 square miles) per day. That was close to the average decline rate for May 1979 to 2000 of 46,000 square kilometers (18,000 square miles) per day. Ice extent declined more slowly than in May 2010, but faster than in May 2007, the year when September sea ice extent reached the lowest in the satellite record.
At the end of May, Arctic sea ice extent was 11.99 million square kilometers (4.63 million square miles), 175,000 square kilometers (67,600 square miles) less than the ice extent on May 31 2007 and 48,790 square kilometers (18,800 square miles) above the previous record low for May 31, set in 2010.
Air temperatures averaged for the month of May were 4-5 °C (5-9 °F) warmer than normal in the Beaufort and Chukchi seas, western Siberia, and in the Kara Sea. The areas with high air temperatures correspond to locations where ice retreated and polynyas formed. By contrast, temperatures were 2-5 °C (4-7 °F) colder than normal in Baffin Bay and the East Siberian Sea.
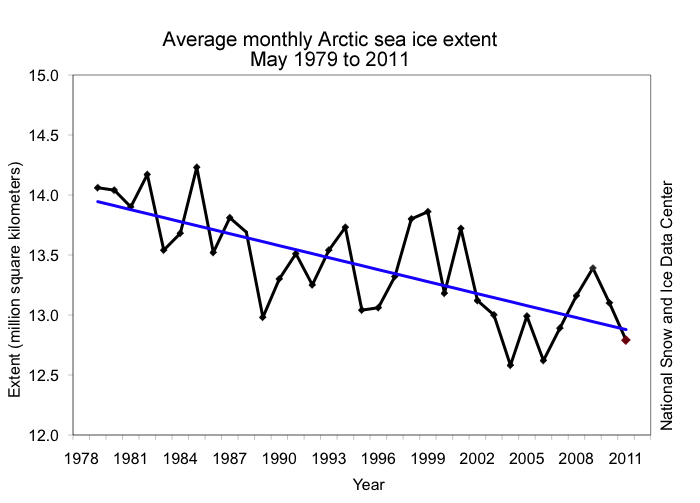 Figure 3. Monthly May ice extent for 1979 to 2011 shows a decline of 2.4% per decade.
 —Credit: National Snow and Ice Data Center.
High-resolution image
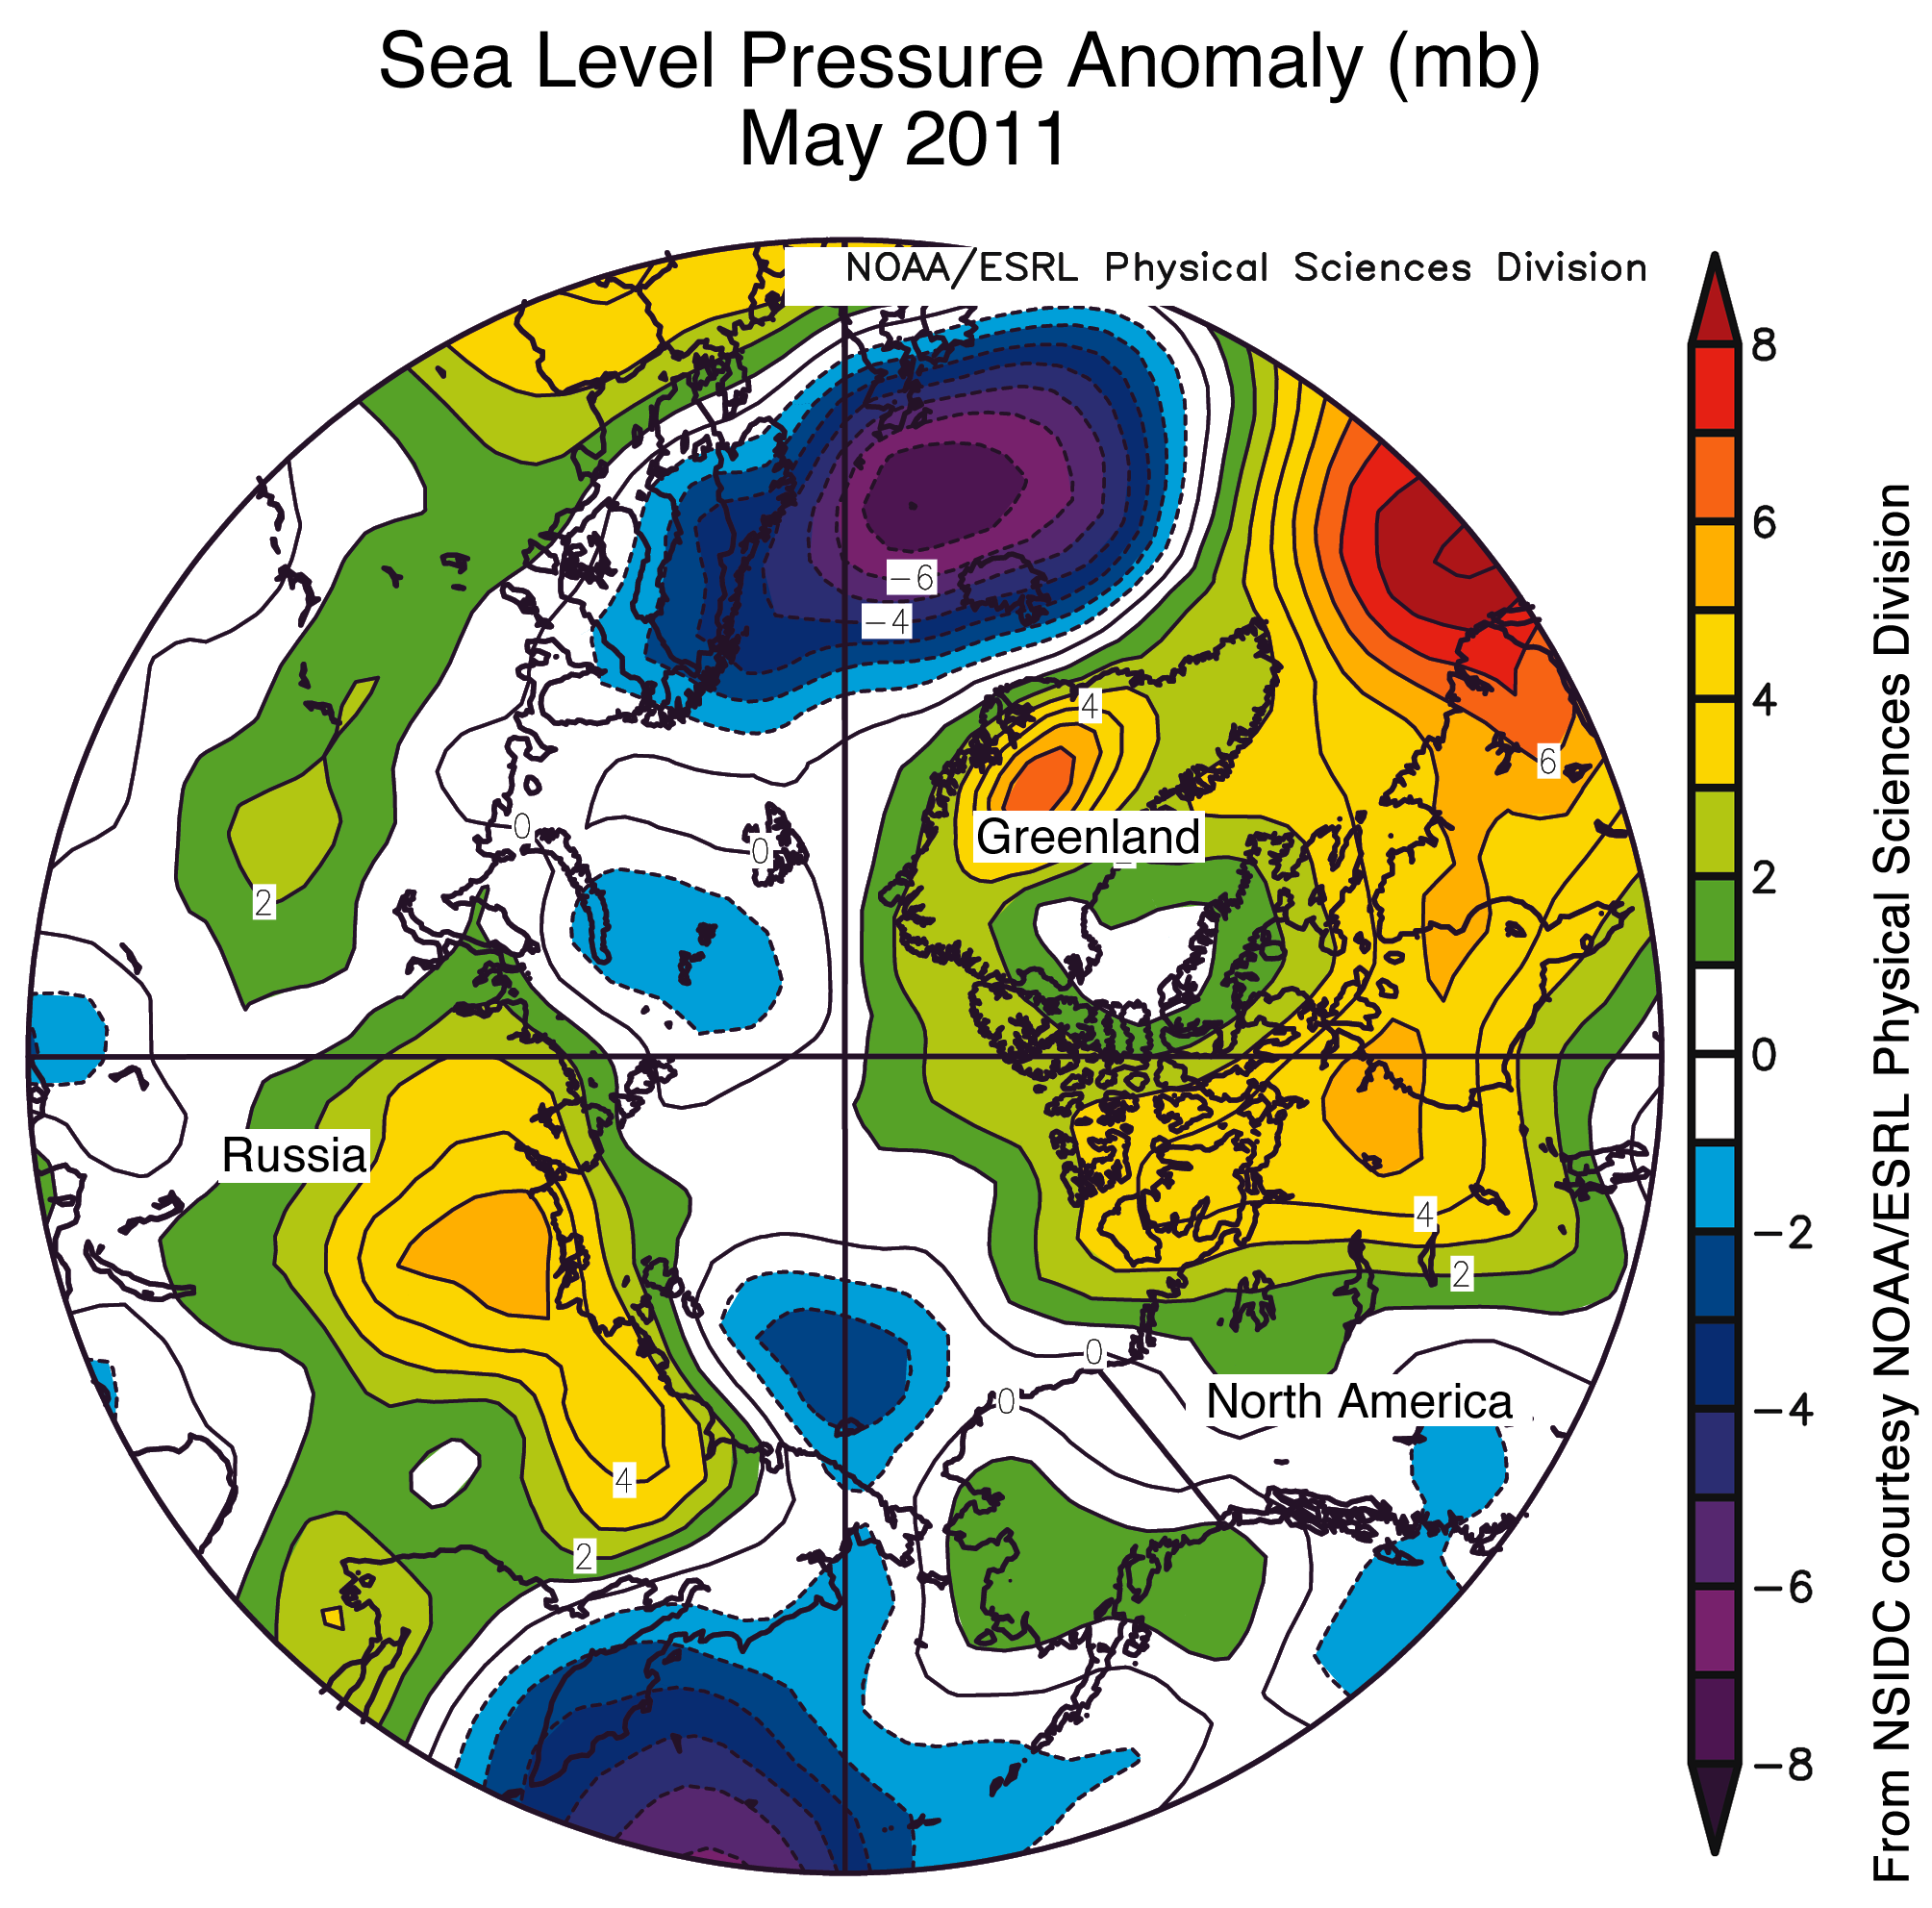 Figure 4. This map of sea level pressure for May 2011 shows unusually high pressure over the Canadian Archipelago and Greenland, as well as central Siberia (green and yellow). —Credit: NSIDC courtesy NOAA ESRL PSD.
 Atmospheric pressure and ice lossAtmospheric pressure patterns for the month of May contributed to the formation of open water areas in some regions of the Arctic. During May, high pressure settled over northeastern Canada and Greenland, with low pressure over the Chukchi and East Siberian seas. This pattern helped push ice in the Beaufort Sea away from the coast and to the west, helping create areas of open water north of Tuktoyaktuk, Canada. Higher-than normal pressure over central Siberia helped bring unusually warm temperatures over western Siberia and the Kara Sea, along with winds that pushed ice away from the coast in the Laptev Sea near the New Siberian Islands. This pressure pattern also led to above-average temperatures in the Beaufort Sea, and unusually cold conditions over the East Siberian Sea. Lower-than-normal pressure also dominated the Norwegian Sea and the northwestern Pacific Ocean.
The last four summers have been dominated by an atmospheric pattern known as the Arctic dipole anomaly, which has been associated with low sea ice extent at the end of summer. This pattern features unusually high pressure over the Beaufort Sea and unusually low pressure over the Kara and Laptev Seas, which promote warm southerly winds along the Siberian coast, helping to melt ice and push it away from the coasts and out of the Arctic Basin through Fram Strait.
While the atmospheric pattern for May 2011 bears some resemblance to the Arctic dipole anomaly pattern, the centers of the pressure anomalies are in different locations this year, and it is not yet clear whether the pattern will persist through the summer and contribute to low ice extent.
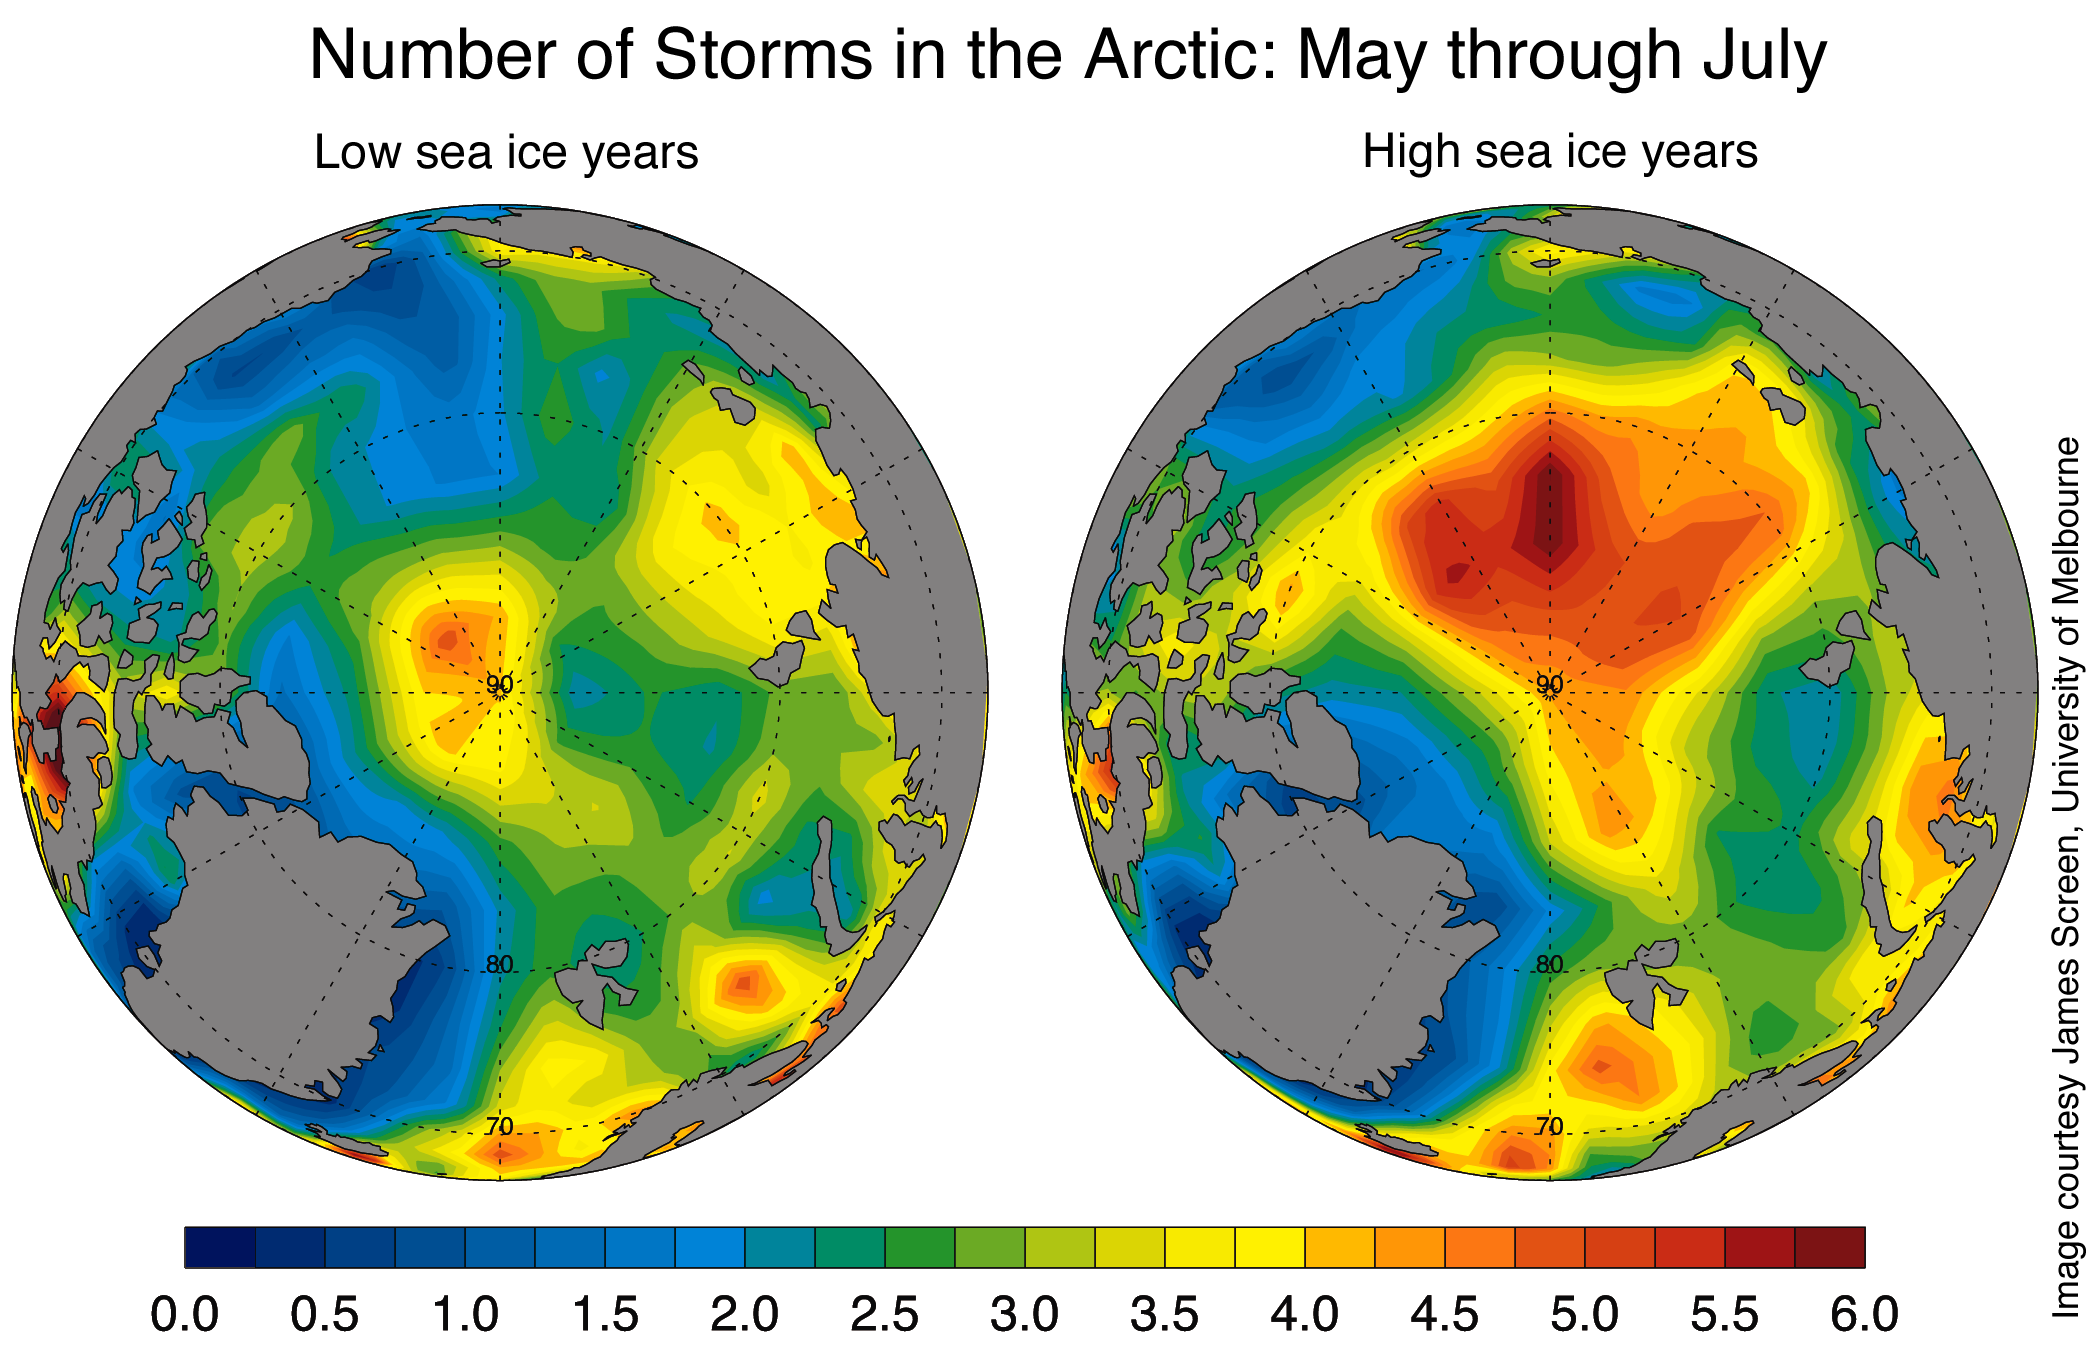 Figure 5. Far fewer storms are found in the Arctic during May, June and July in years with low sea ice at the end of summer (left) than in years with high sea ice at the end of summer (right).
 —Credit: NSIDC courtesy James Screen, Unversity of Melbourne. High-resolution image
Importance of stormsArctic weather in the next few months will be a critical factor in how much ice remains at the end of the melt season. New research led by James Screen at the University of Melbourne shows that the storms that move northwards into the Arctic from the lower latitudes during summer strongly influence sea ice extent at the end of summer. Years with dramatic ice loss, such as 2007, have been associated with comparatively warm, calm, and clear conditions in summer that have encouraged ice melt. Summers with slow melt rates are opposite and tend to be stormier than average. The number of storms influences how warm, windy and cloudy the Arctic summer is.


No comments:
Post a Comment