by Peter Gleick, president of the Pacific Institute, Huffington Post, February 7, 2011
As the climate science continues to strengthen, and as the observational data around the world continue to accumulate, those who deny the reality or severity of human-induced climate change are getting increasingly desperate. As evidence piles up and as our weather worsens, their positions get weaker and weaker and their claims that the climate isn't changing, or isn't changing because of human actions get harder to support, their voices get more strident, and their language and vitriol get uglier.
Climate deniers cannot make a case against human-caused climate change without desperately manipulating, misrepresenting, or simply misunderstanding the science. While there are examples of their bad science (BS) every day, a particularly egregious case has played out in New Mexico in the past week.
In 2009, Harrison Schmitt, a former senator, astronaut, and self-described climate "denier" (and potentially the Energy Secretary to the new New Mexican governor), sent a paper to NASA riddled with long-debunked errors of science. Others have written about this paper, taking it apart error by error. But one particular mistake lies at the heart of this week's dust-up in New Mexico. In that paper Schmitt said:
"How long this cooling trend will persist remains to be seen; however, Greenland glaciers have been advancing since 2006, Artic [sic] sea ice has returned to 1989 levels of coverage, and snowy, cold winters and cool summers have dominated northern North America and Europe."All four of these statements are wrong:
- The Earth is not in a cooling trend, but a warming trend,
- Greenland is losing ice, not gaining it (more evidence of warming),
- Arctic (the correct spelling) sea ice in 2009 had not "returned to 1989 levels of coverage," and
- Snowy, cold winters and cool summers do not dominate North America or Europe, nor would they refute the fact that the planet as a whole is warming.
In The Santa Fe New Mexican newspaper on January 24, Dr. Mark Boslough (an adjunct professor of Earth and Planetary Science at UNM, with a doctorate from CalTech) noted the errors in Schmitt's statement and wrote how he tried to privately point them out to Schmitt, but that Schmitt never corrected them. The error that has stirred up the new debate in New Mexico is the third one "Artic [sic] sea ice has returned to 1989 levels of coverage." [John Cook has also tackled this here in an excellent Skeptical Science post.]
Arctic Sea Ice: Specific, Verifiable Data
First and most simply, Boslough is right and Schmitt is wrong. No matter how you measure it, there was less Arctic sea ice in 2009 than in 1989:
• The average area of Arctic ice was less in 2009.
• The average extent of Arctic ice was less in 2009.
• The volume of Arctic ice was less in 2009.
• The maximum amount of ice (in winter) was less in 2009.
• The minimum amount of ice (in summer) was less in 2009.
• The average extent of Arctic ice was less in 2009.
• The volume of Arctic ice was less in 2009.
• The maximum amount of ice (in winter) was less in 2009.
• The minimum amount of ice (in summer) was less in 2009.
Wrong. Wrong. Wrong. Wrong. And wrong. If you tried, you couldn't find an honest argument that there was more, or even equal, Arctic ice in 2009 compared to 1989.
Enter the Heartland Institute and its President Joseph Bast. They tried and couldn't either. But rather than simply acknowledging Schmitt's first error, Bast and the Heartland Institute tried a trick, called "cherry picking" - where someone carefully selects one piece of data to prove a point while ignoring or hiding all of the other data points that refute it. That's a bad, dishonest no-no. Scientists destroy their reputations when they do this (since inevitably other scientists find out). And the Heartland Institute's cherry picking is one of the most extreme examples I've ever seen of misrepresentation of science and data. (Though here's another from the Bush White House.)
Here is how Heartland's Bast chose to do it. On January 31st he wrote a misleading piece in theSanta Fe New Mexican criticizing Dr. Boslough, in which he says:
Here is how Heartland's Bast chose to do it. On January 31st he wrote a misleading piece in theSanta Fe New Mexican criticizing Dr. Boslough, in which he says:
"In fact, National Snow and Ice Data Center records show conclusively that in April 2009, Arctic sea ice extent had indeed returned to and surpassed 1989 levels." (emphasis added)
In a desperate attempt to try to support Schmitt's false statement that there was as much or more ice in 2009 than 1989, he and Heartland searched through the ice records from the National Snow and Ice Data Center and found the single month (April), where the area of ice was higher in 2009 than 1989. There was less ice in 2009 in January, February, March, May, June, July, August, September, October, November, December, on average, the maximum, and the minimum. But not in April (and just barely). Figure 1 shows the monthly ice area for the Arctic for 1989 and 2009 and the carefully picked month of April. I've circled the data point Bost and Heartland "cherry-picked."
If Figure 1 was your bank statement for 1989 and 2009 could you claim with a straight face that you had more money in 2009 than 1989? And should anyone believe you?
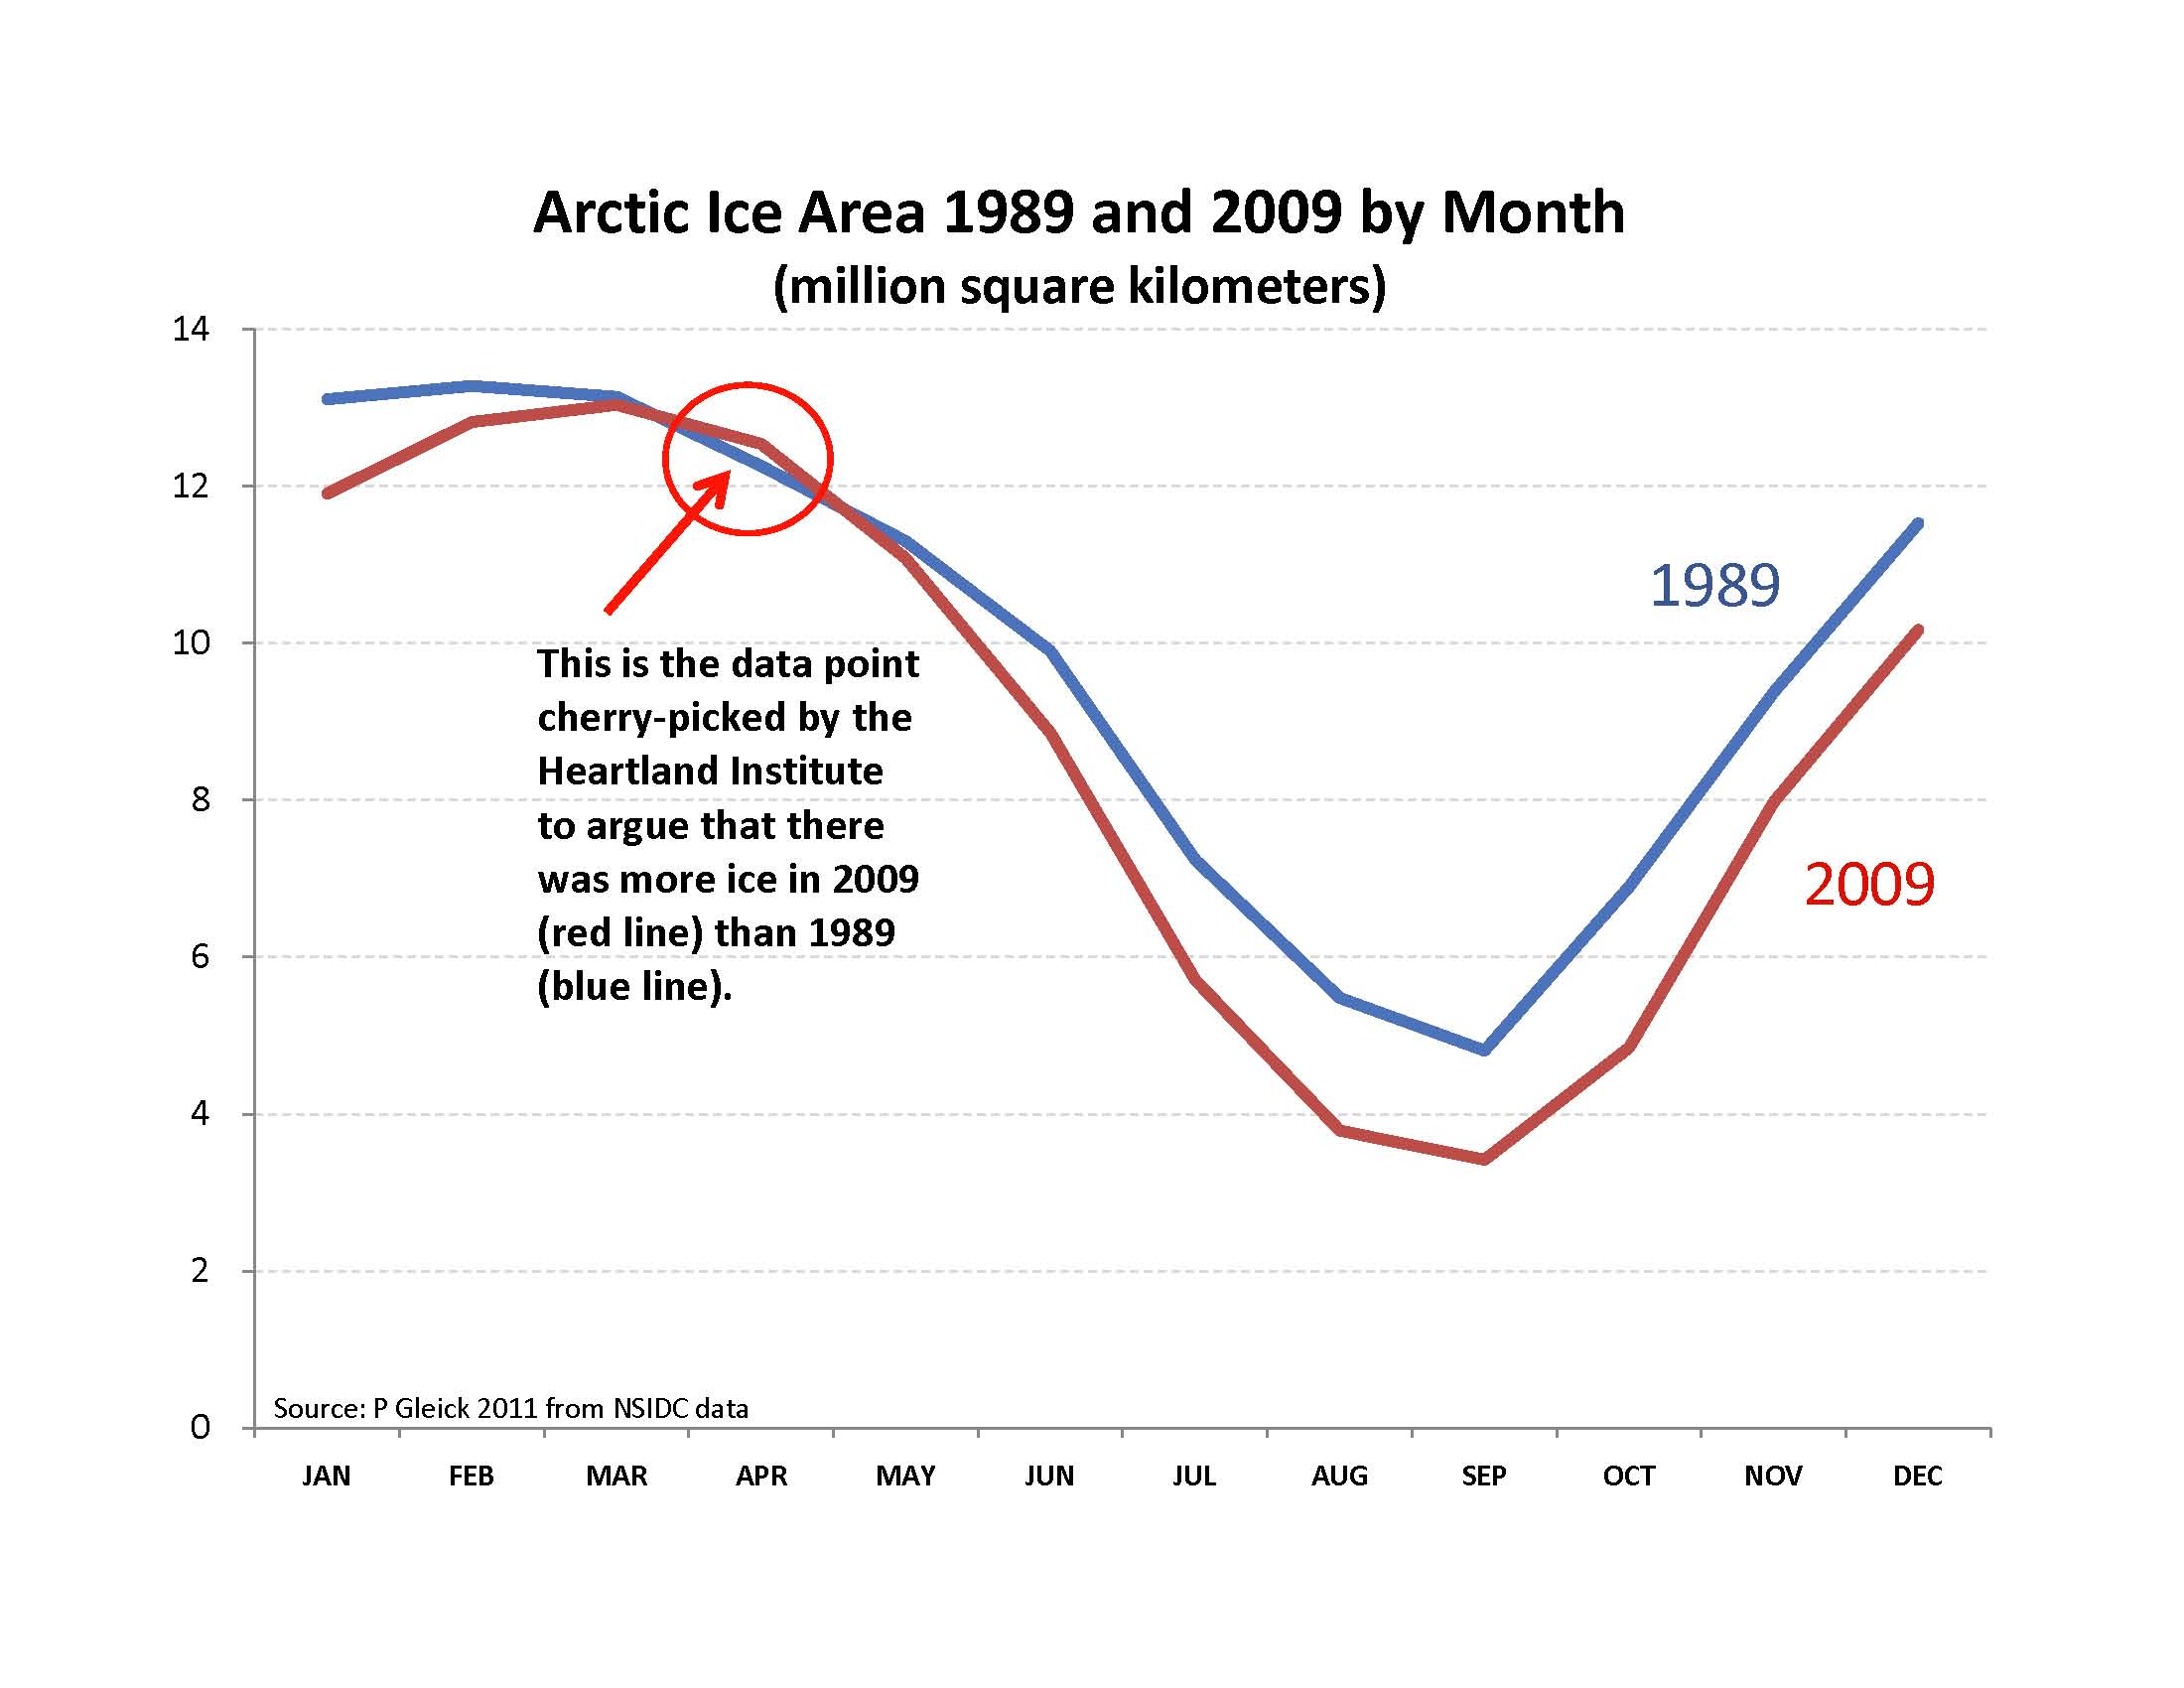
Figure 1. Monthly Arctic ice area for 1989 and 2009. Graph prepared by Peter Gleick, Pacific Institute, using Sea Ice Index. Boulder, CO: National Snow and Ice Data Center.
In fact, even if Schmitt had been right about 1989 (and remember, Schmitt said "1989" not "April 1989," -- that was a later desperate attempt by the Heartland Institute to save face and avoid admitting error) that also is cherry picking data. If we look at all the years in the complete record of ice data, the disappearing Arctic ice cap is irrefutable. Figure 2 shows all the years in the record back to 1979, showing the decreasing extent of Arctic ice. Even more dramatic is this graphshowing the more serious loss of total amount of ice measured by volume.
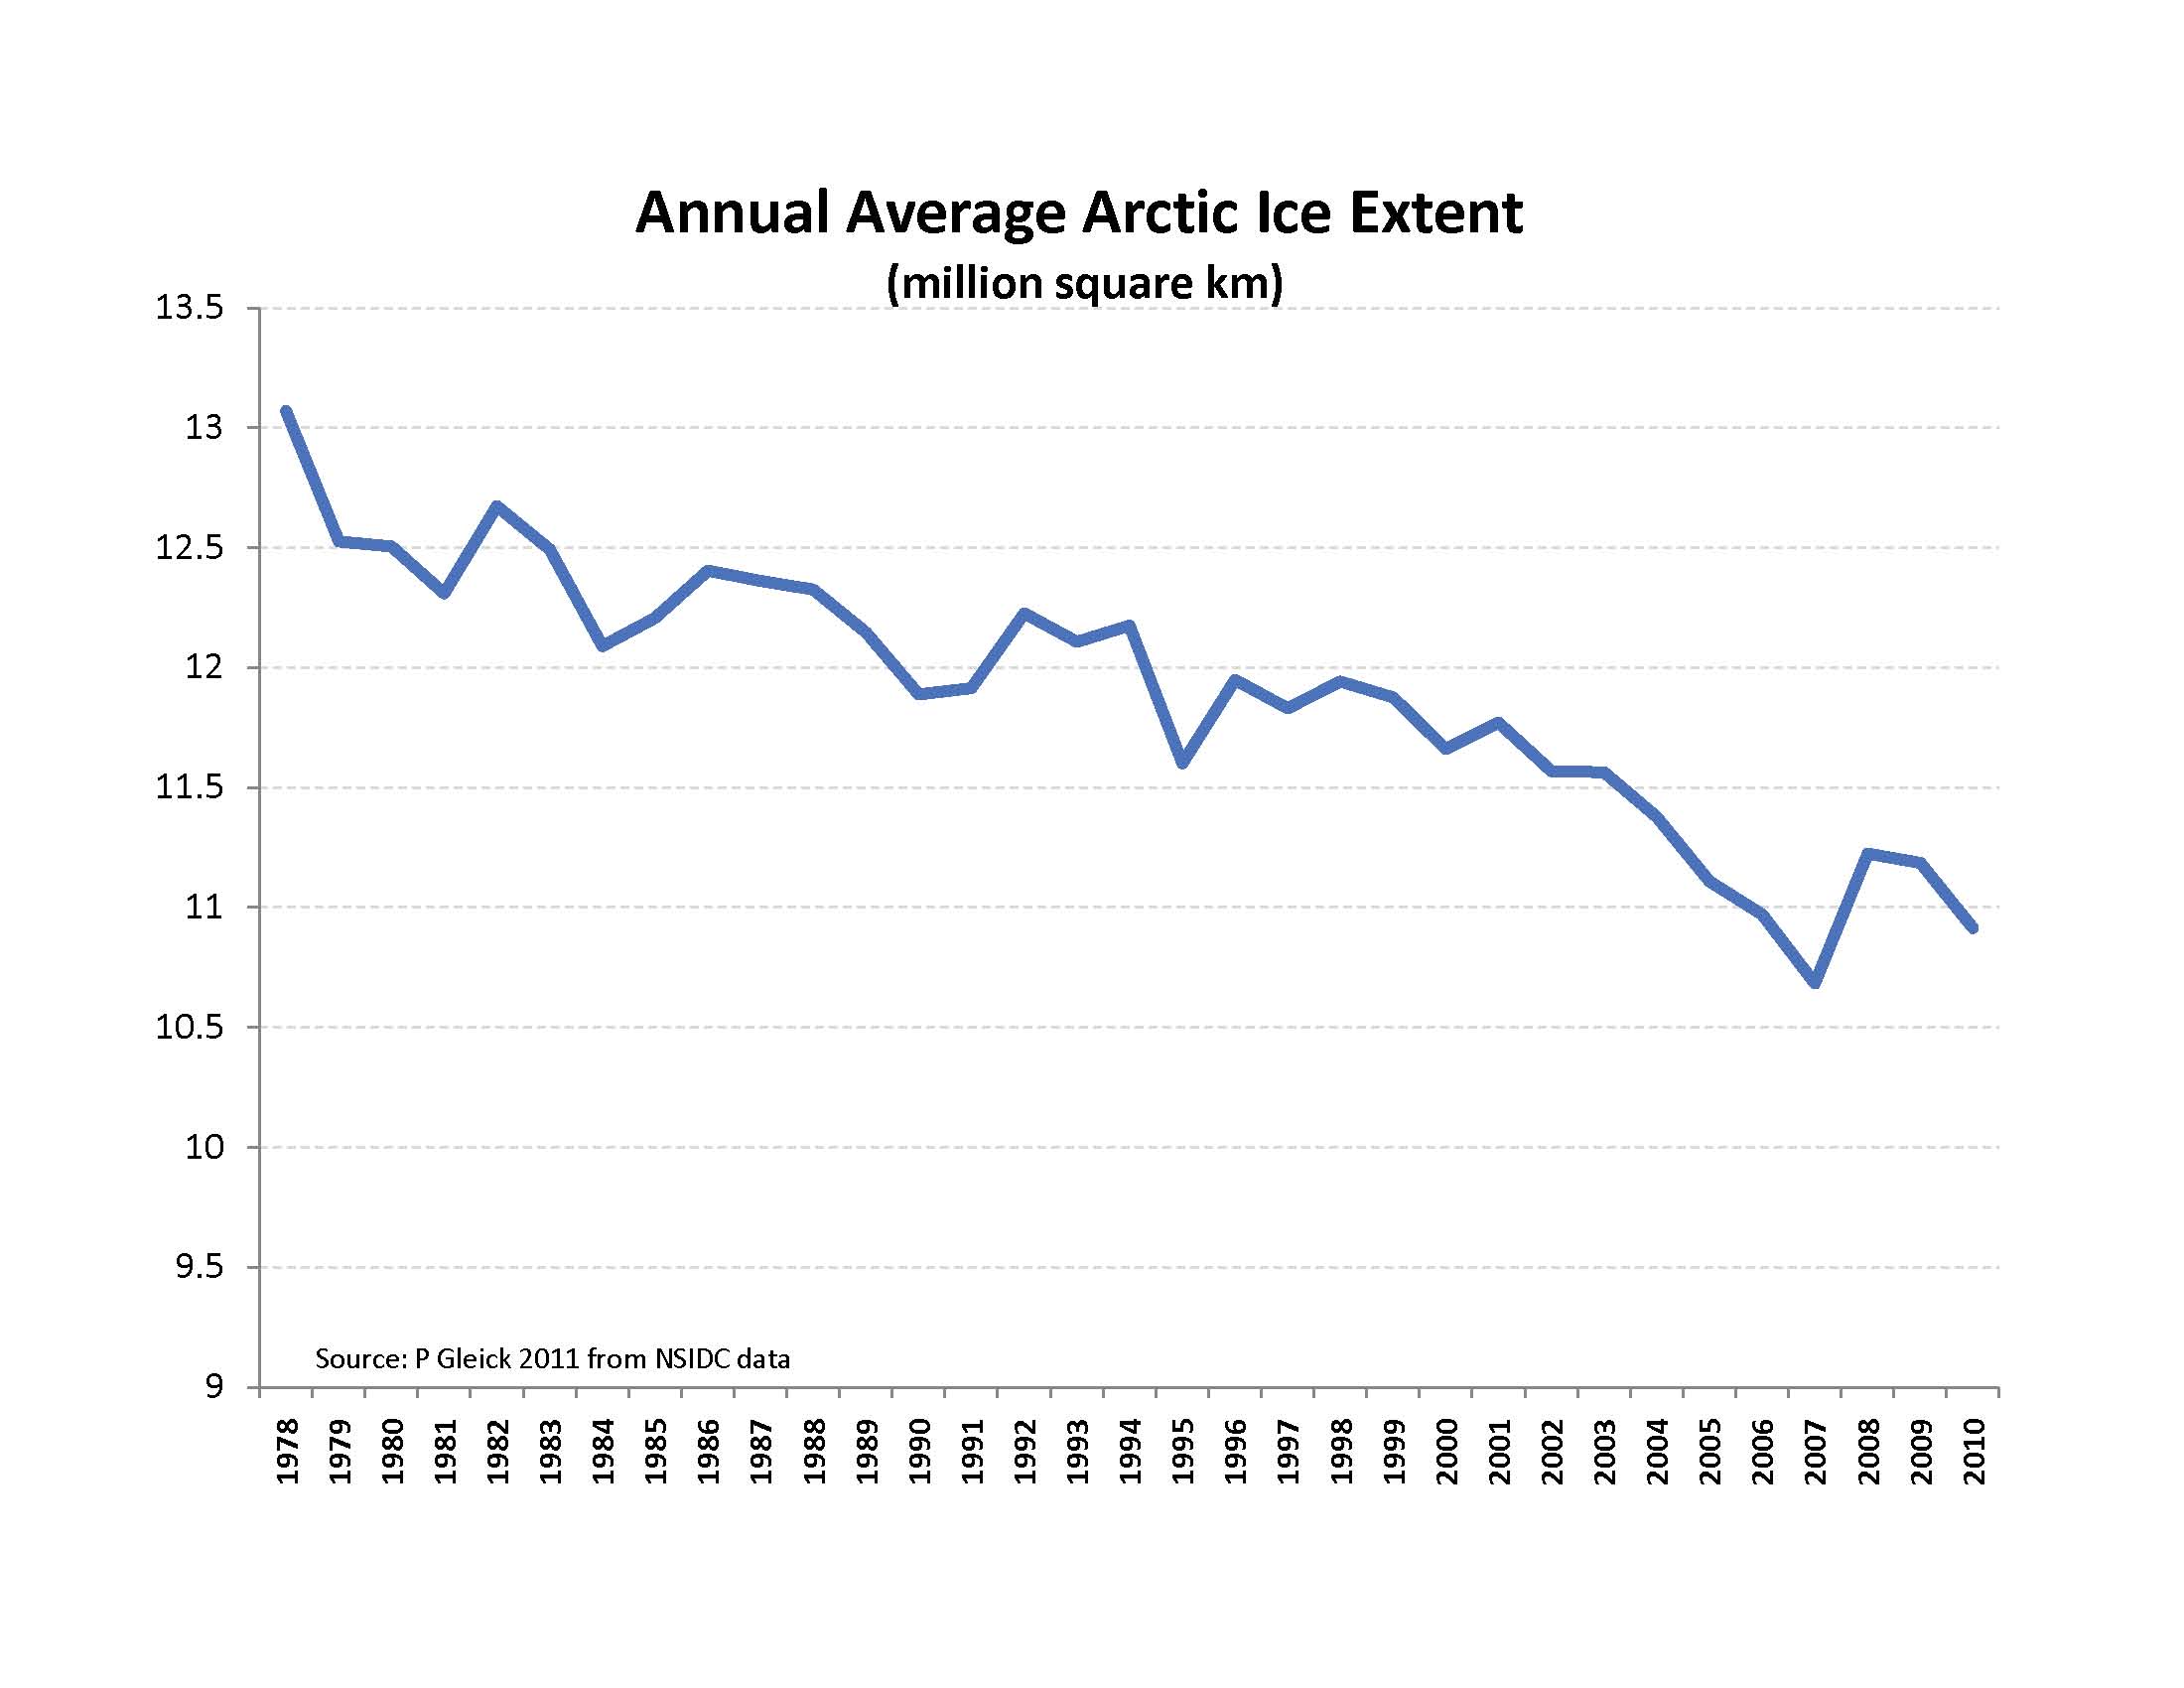
Figure 2. Annual average Arctic ice extent from late 1978 through 2010. Graph prepared by Peter Gleick, Pacific Institute, using Sea Ice Index. Boulder, CO: National Snow and Ice Data Center.
It doesn't get much more brazen than this effort by the Heartland Institute to mislead readers in New Mexico. Unfortunately, lots of readers probably fell for it. But scientists and honest researchers don't cherry-pick data to support pre-determined positions.


No comments:
Post a Comment