Arctic Oscillation brings record low January extent, unusual mid-latitude weather
Arctic sea ice extent for January 2011 was the lowest in the satellite record for that month. The Arctic oscillation persisted in its strong negative phase for most of the month, keeping ice extent low.
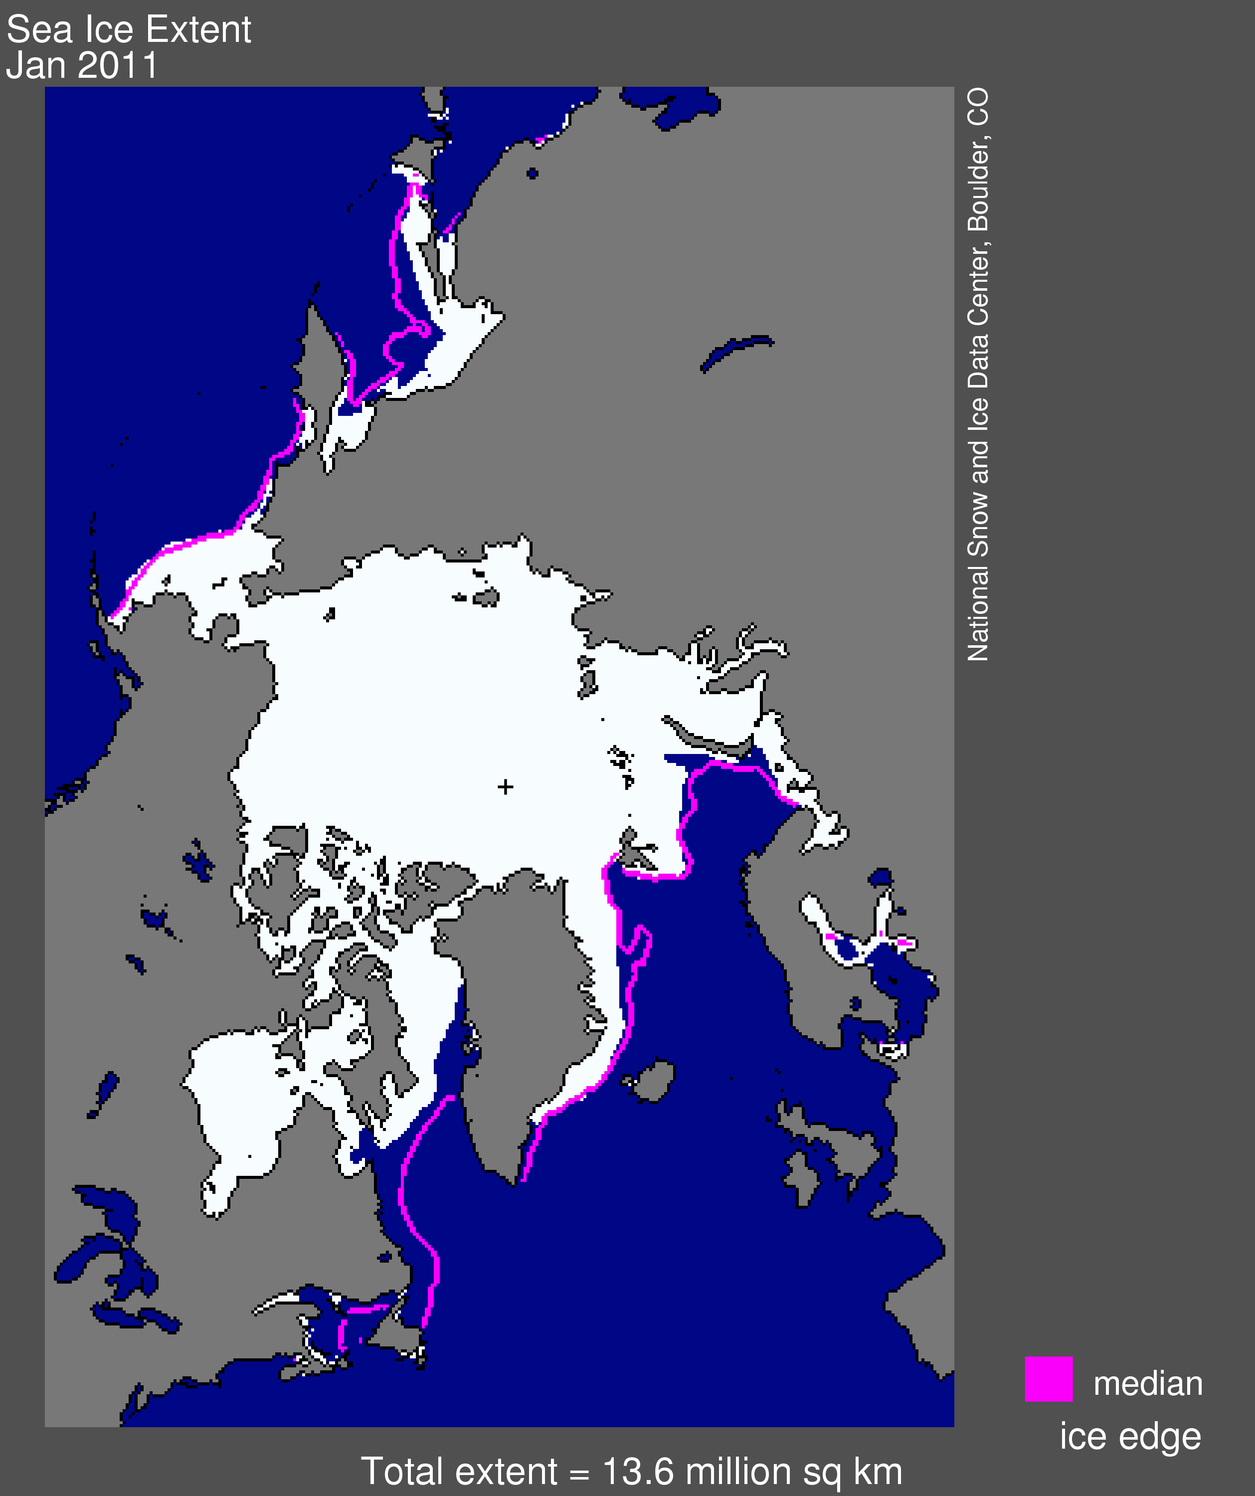 Figure 1. Arctic sea ice extent for January 2011 was 13.55 million square kilometers (5.23 million square miles). The magenta line shows the 1979 to 2000 median extent for that month. The black cross indicates the geographic North Pole.Sea Ice Index data. About the data.
 —Credit: National Snow and Ice Data Center
High-resolution image
Overview of conditions
Arctic sea ice extent averaged over January 2011 was 13.55 million square kilometers (5.23 million square miles). This was the lowest January ice extent recorded since satellite records began in 1979. It was 50,000 square kilometers (19,300 square miles) below the record low of 13.60 million square kilometers (5.25 million square miles), set in 2006, and 1.27 million square kilometers (490,000 square miles) below the 1979 to 2000 average.
Ice extent in January 2011 remained unusually low in Hudson Bay, Hudson Strait (between southern Baffin Island and Labrador), and Davis Strait (between Baffin Island and Greenland). Normally, these areas freeze over by late November, but this year Hudson Bay did not completely freeze over until mid-January. The Labrador Sea remains largely ice-free.
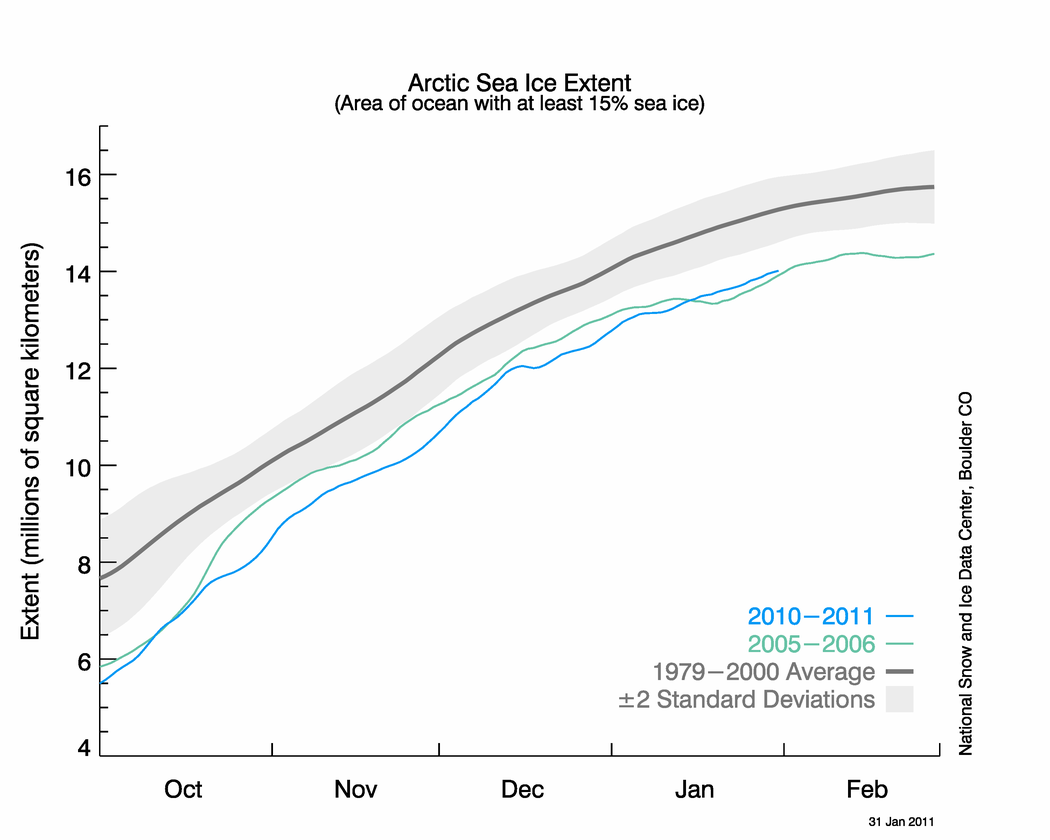 Figure 2. The graph above shows daily Arctic sea ice extent as of January 31, 2011, along with daily ice extents for previous low-ice-extent years in the month of January. Light blue indicates 2010-2011, green shows 2005-2006 (the record low for the month was in 2006), and dark gray shows the 1979 to 2000 average. The gray area around the average line shows the two standard deviation range of the data. Sea Ice Index data.
—Credit: National Snow and Ice Data Center
High-resolution image
Conditions in context
Air temperatures over much of the Arctic were 2-6 °C (4-11 °F) above normal in January. Over the eastern Canadian Arctic Archipelago, Baffin Bay/Davis Strait and Labrador Sea, temperatures were at least 6 °C (11 °F) higher than average.
Temperatures were near average over the western Canadian Arctic Archipelago and Scandinavia.
As in December 2010, the warm temperatures in January came from two sources: unfrozen areas of the ocean continued to release heat to the atmosphere, and the wind patterns accompanying the negative phase of the Arctic oscillation brought warm air into the Arctic. Near the end of January the negative Arctic oscillation pattern broke down and turned positive, which usually favors ice growth. It is unclear how long it will remain in a positive mode.
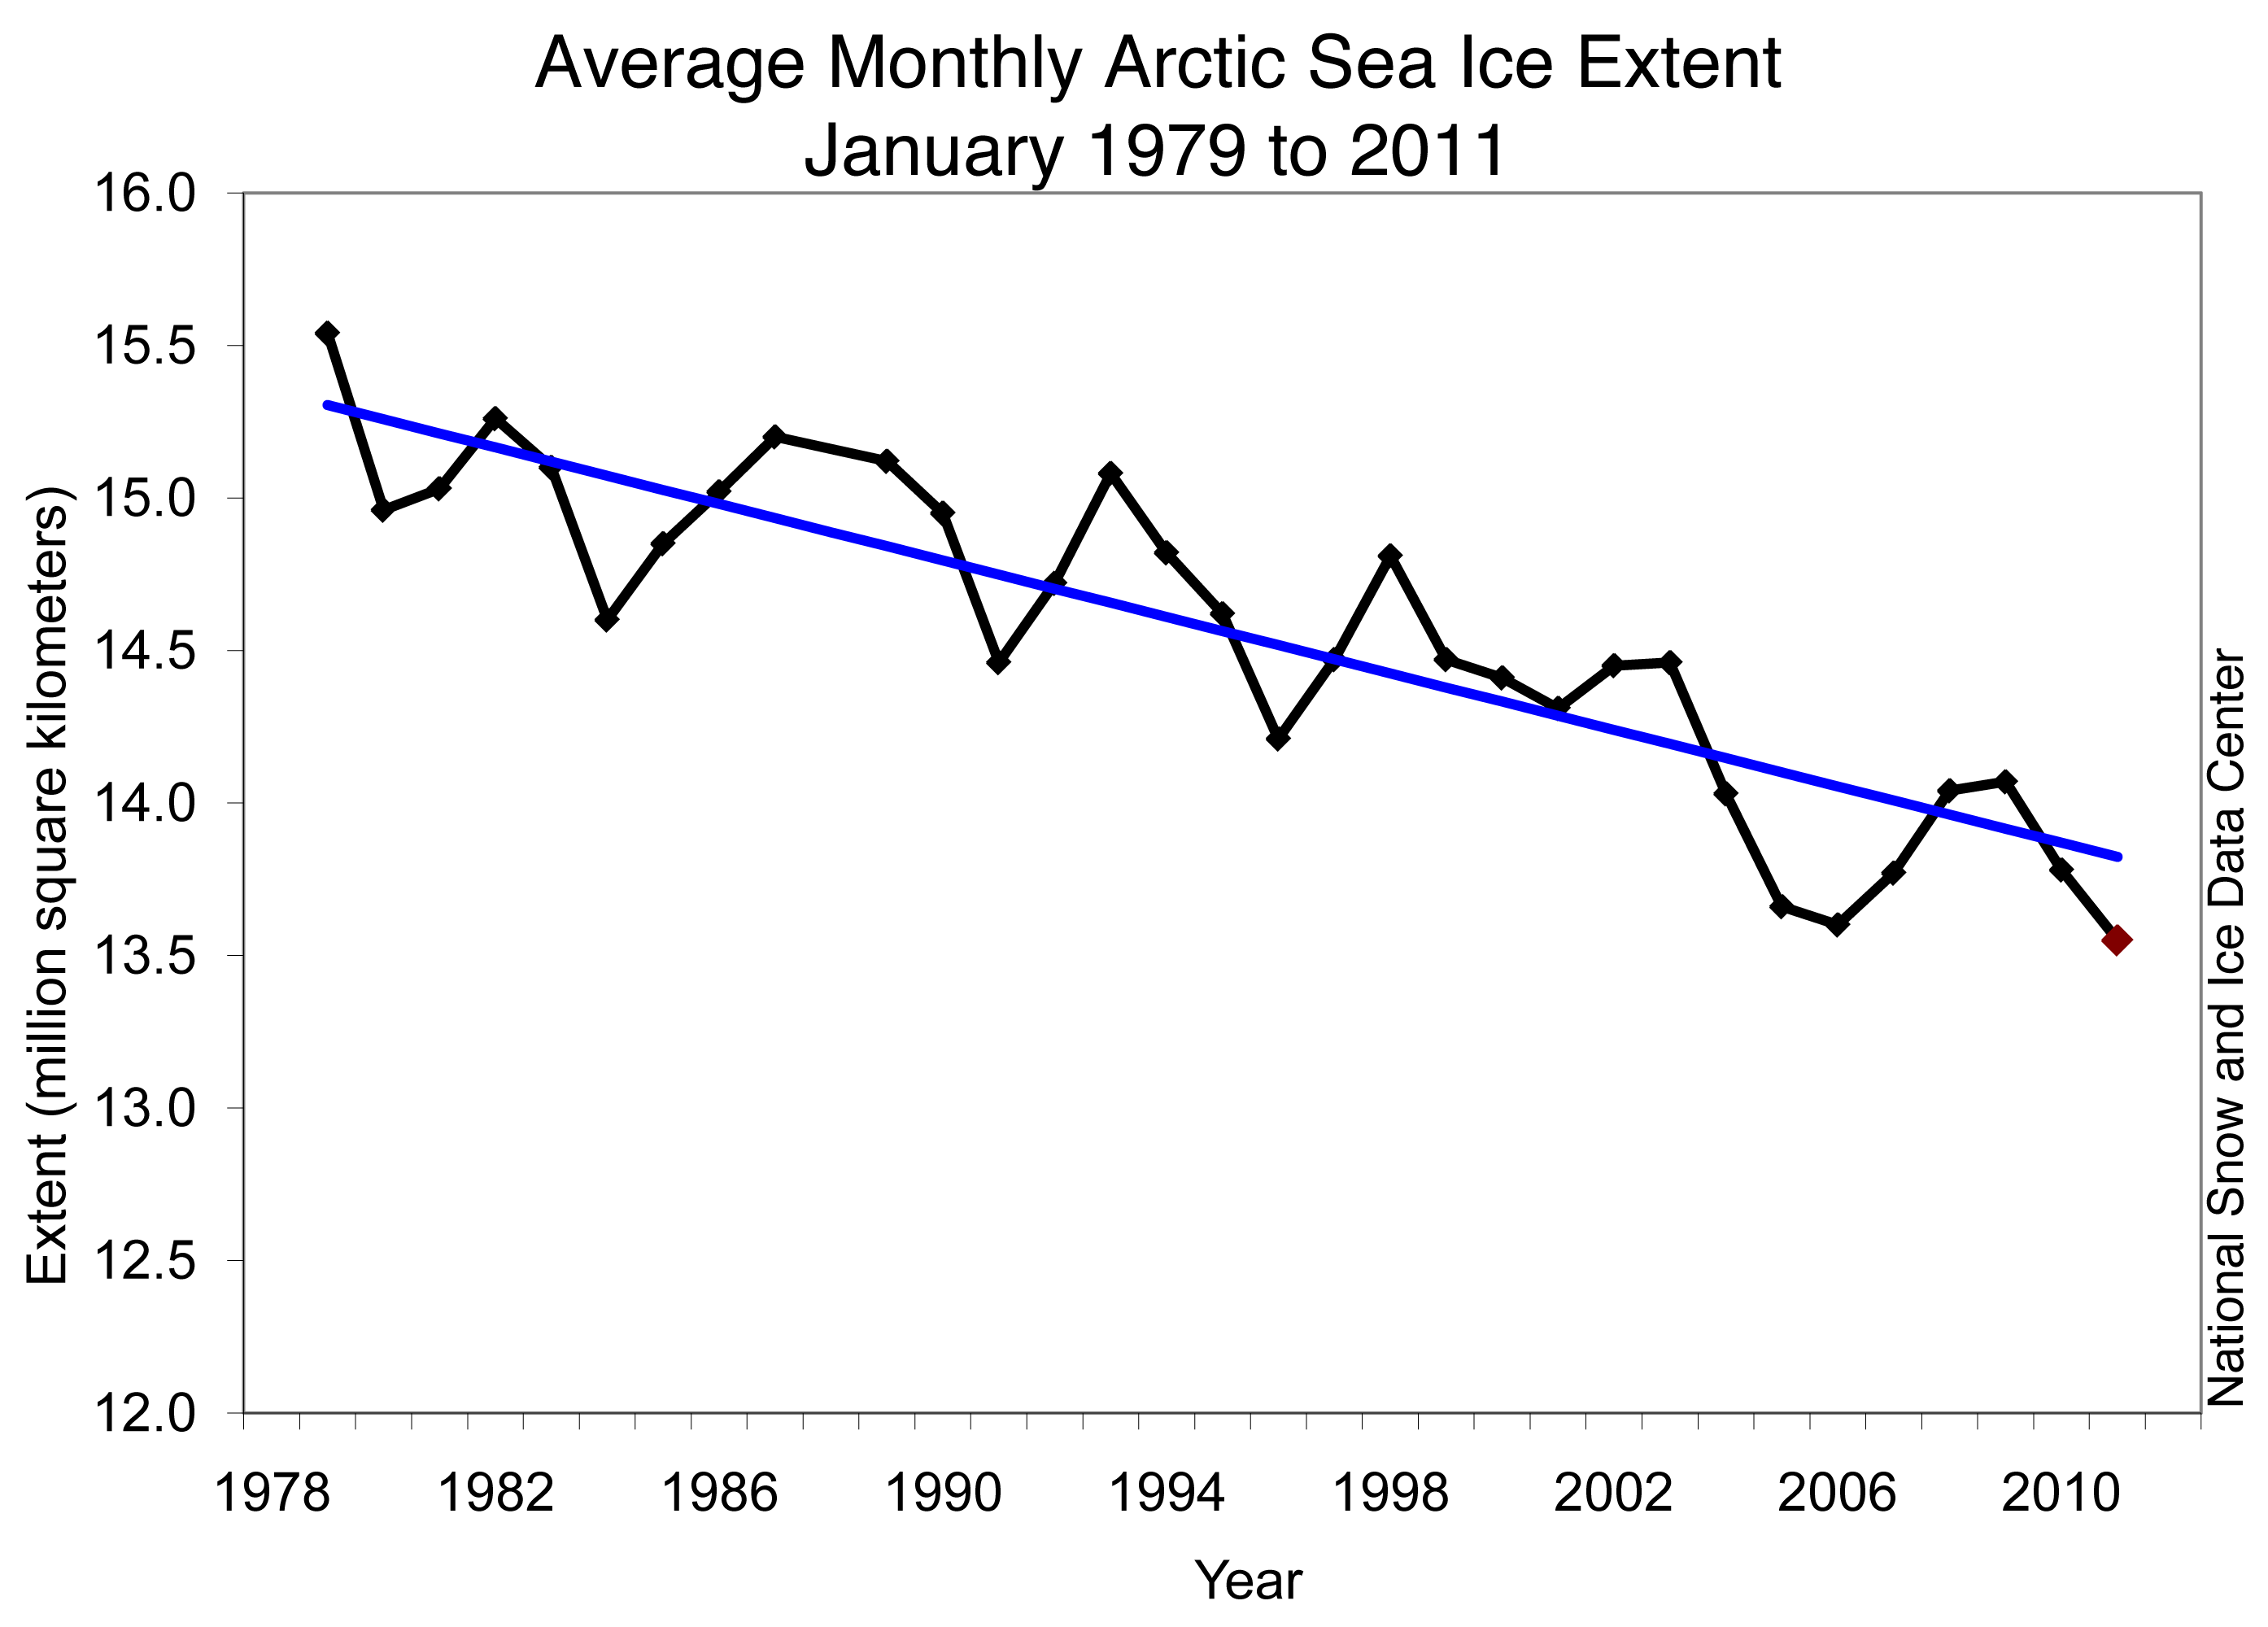 Figure 3. Monthly January ice extent for 1979 to 2011 shows a decline of 3.3% per decade.
 —Credit: National Snow and Ice Data Center
High-resolution image
January 2011 had the lowest ice extent for the month since the beginning of satellite records. The linear rate of decline for the month is –3.3% per decade.
Ice extent for the Arctic as a whole increased at an average of 42,800 square kilometers (16,500 square miles) per day through the month of January, which is about average.
 Figure 4. This graph shows the ice extent in Hudson Bay from late November to the end of January, for the last five years. This year, Hudson Bay froze up substantially later than in previous years. MASIE data.
—Credit: NSIDC /NIC MASIE Product
High-resolution image
Slow regional ice growth
In contrast, regional ice growth has been particularly slow compared to past years. Hudson Bay did not completely freeze up until mid-January, about a month later than normal according to Canadian Ice Service analyses. The Labrador Sea region is still largely free of ice, except in protected bays along the coast. Normally at this time of year, ice extends a few hundred kilometers from the coast all the way from Hudson Strait to Newfoundland.
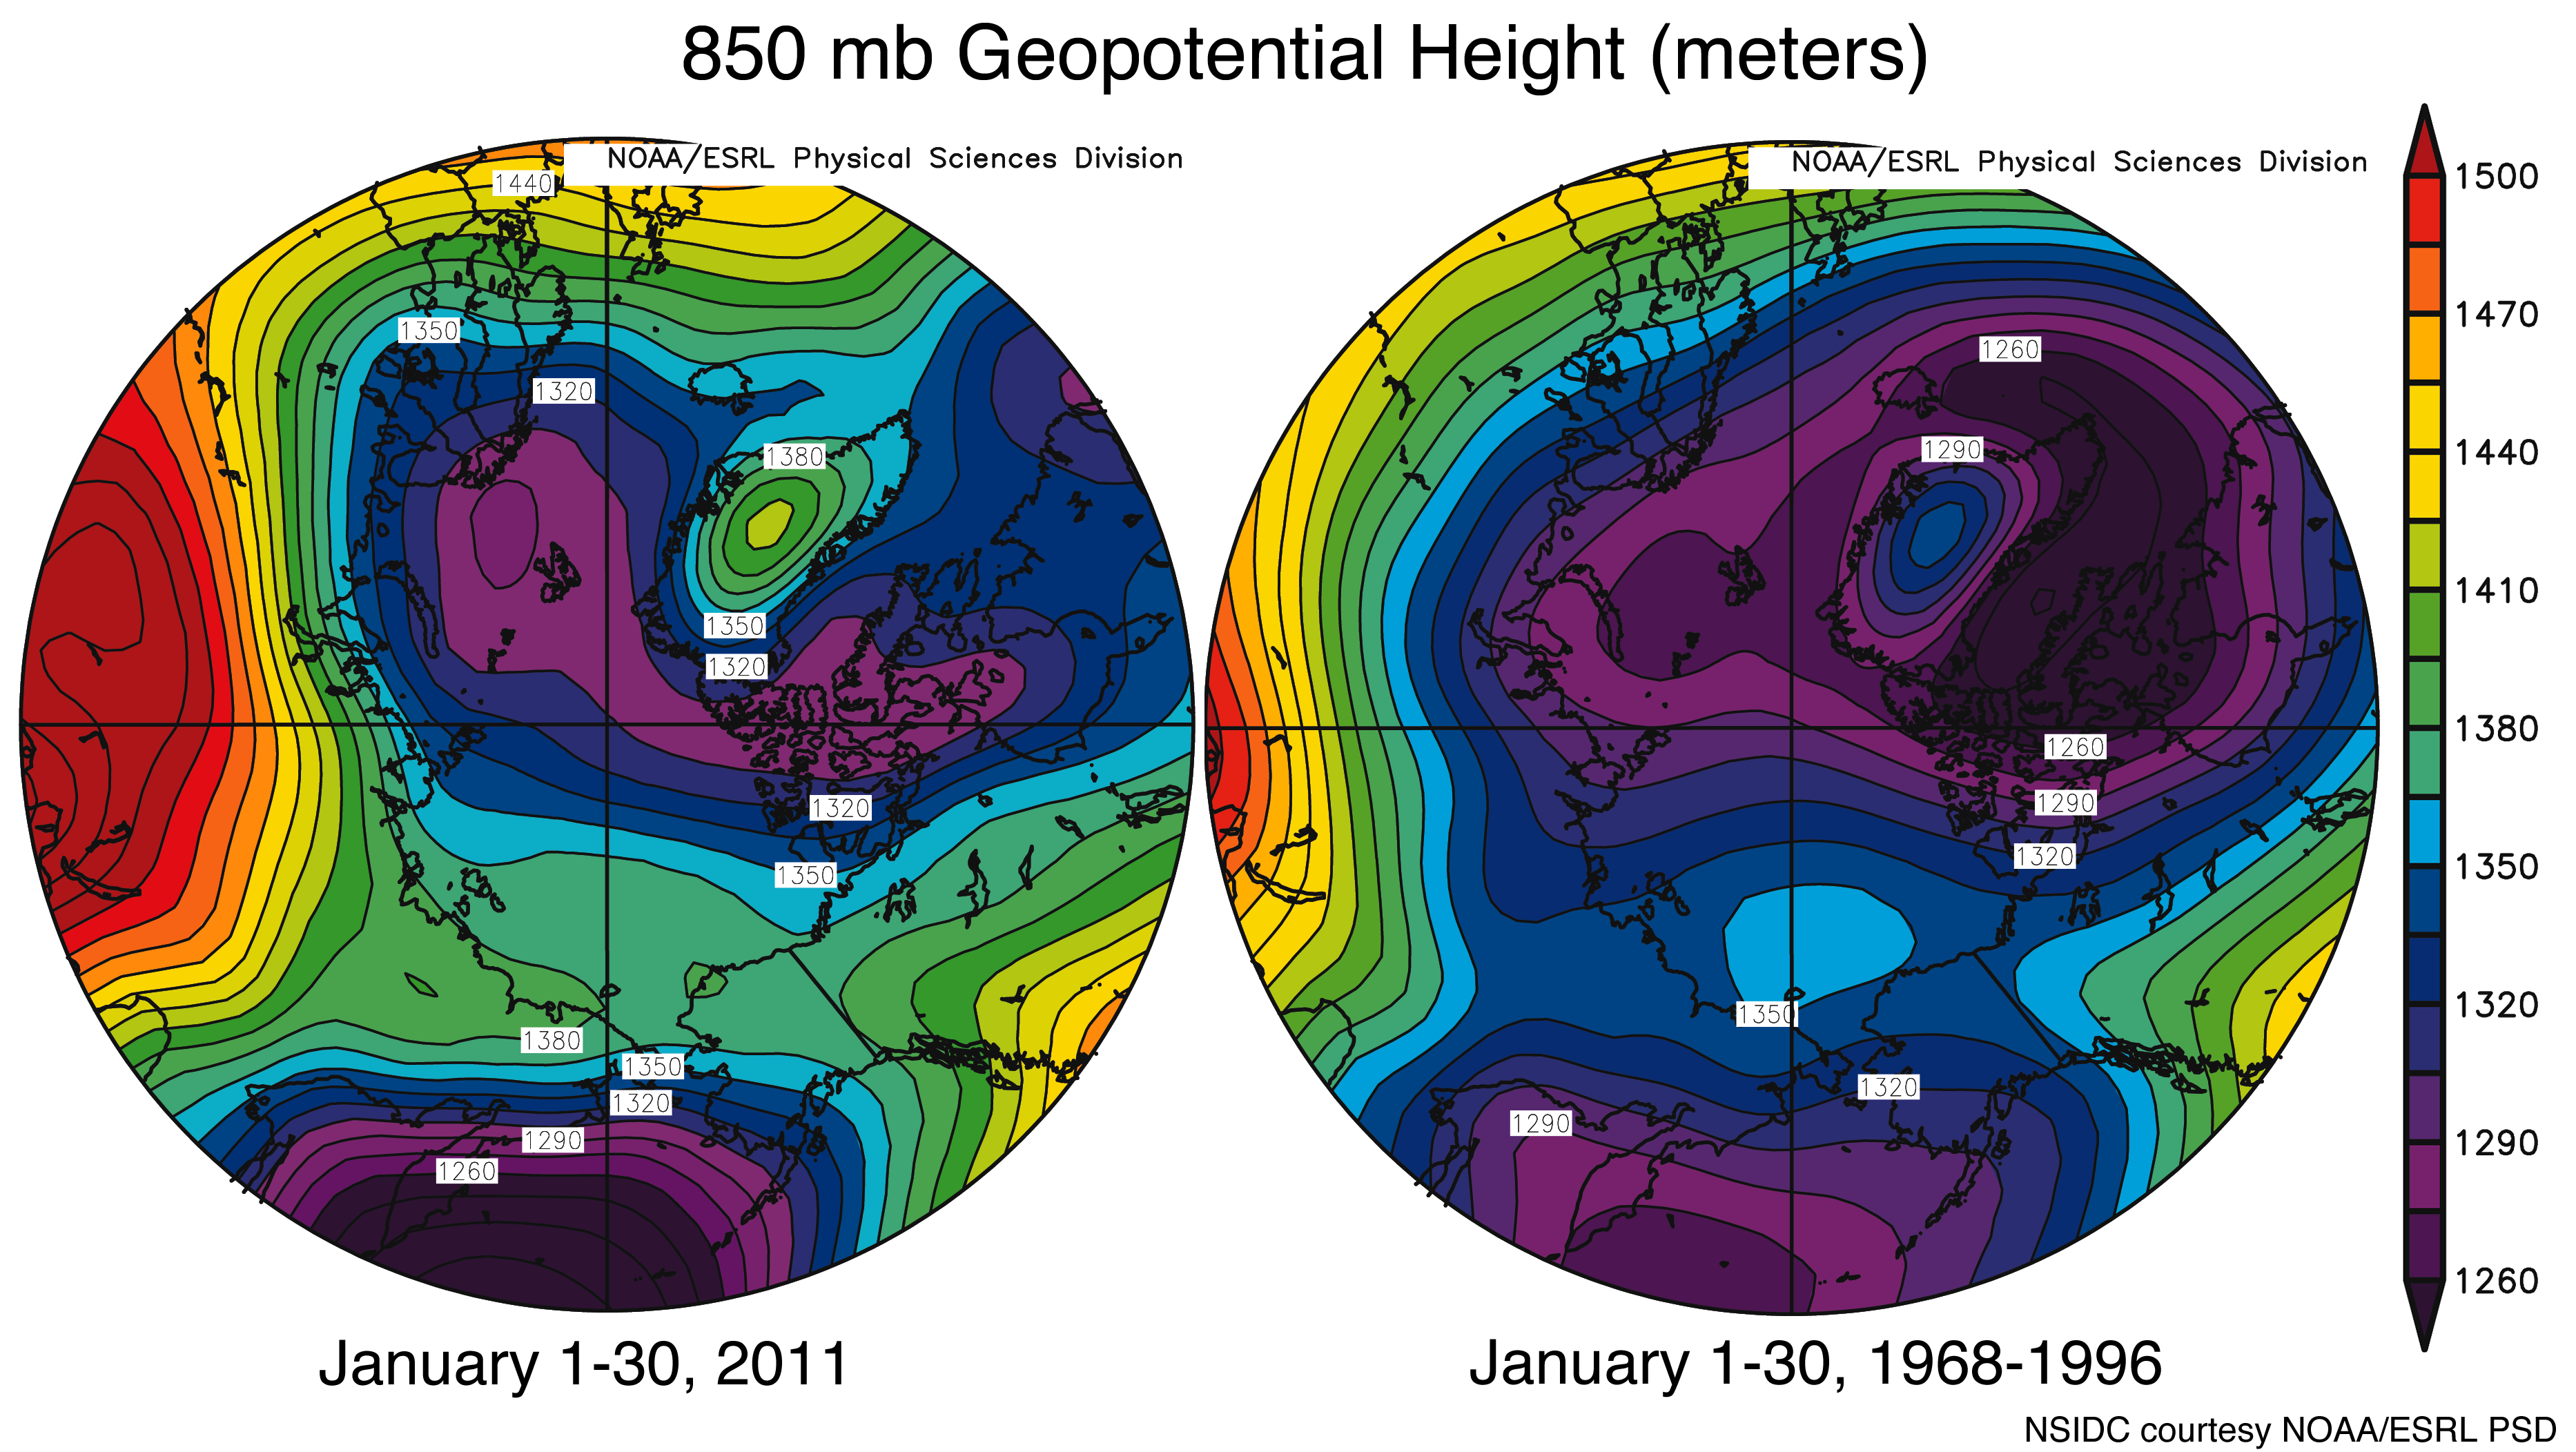 Figure 5. These images show high and low atmospheric pressure patterns for January 2011 (left) and the January 1968-1996 average (right). Yellows and reds show higher pressures; blues and purples indicate lower pressures, as indicated by the height of the 850 millibar pressure level above the surface, called the pressure surface. Normally, the pressure surface is nearer to the surface around the pole, winds follow the pressure contours around the pole (the polar vortex), and cold air is trapped in the Arctic. This year, the pressure pattern is allowing cold air to spill out of the Arctic into the mid-latitudes.
 —Credit: NSIDC courtesy NOAA/ESRL PSD
Potential links with mid-latitude weather
While the Arctic has been warm, cold and stormy weather has affected much of the Northeast U.S. and Europe. Last winter also paired an anomalously warm Arctic with cold and snowy weather for the eastern U.S. and northern Europe. Is there a connection?
Warm conditions in the Arctic and cold conditions in northern Europe and the U.S. are linked to the strong negative mode of the Arctic oscillation. Cold air is denser than warmer air, so it sits closer to the surface. Around the North Pole, this dense cold air causes a circular wind pattern called the polar vortex, which helps keep cold air trapped near the poles. When sea ice has not formed during autumn and winter, heat from the ocean escapes and warms the atmosphere. This may weaken the polar vortex and allow air to spill out of the Arctic and into mid-latitude regions in some years, bringing potentially cold winter weather to lower latitudes.
Some scientists have speculated that more frequent episodes of a negative Arctic Oscillation, and the stormy winters that result, are linked to the loss of sea ice in the Arctic. Dr. James Overland of NOAA Pacific Marine Environmental Laboratory (PMEL) recently noted a link between low sea ice and a weak polar vortex in 2005, 2008, and the past two winters, all years with very low September sea ice extent. Earlier work by Jennifer Francis of Rutgers University and colleagues also suggested a relationship between autumn sea ice levels and mid-latitude winter conditions. Judah Cohen, at Atmospheric and Environmental Research, Inc., and his colleagues propose another idea—a potential relationship between early snowfall in northern Siberia, a negative phase of the Arctic Oscillation, and more extreme winters elsewhere in the Northern Hemisphere. More research on these ideas may shed light on the connections and have the potential to improve seasonal weather forecasting.


No comments:
Post a Comment