by Joseph Romm, Climate Progress, February 3, 2011
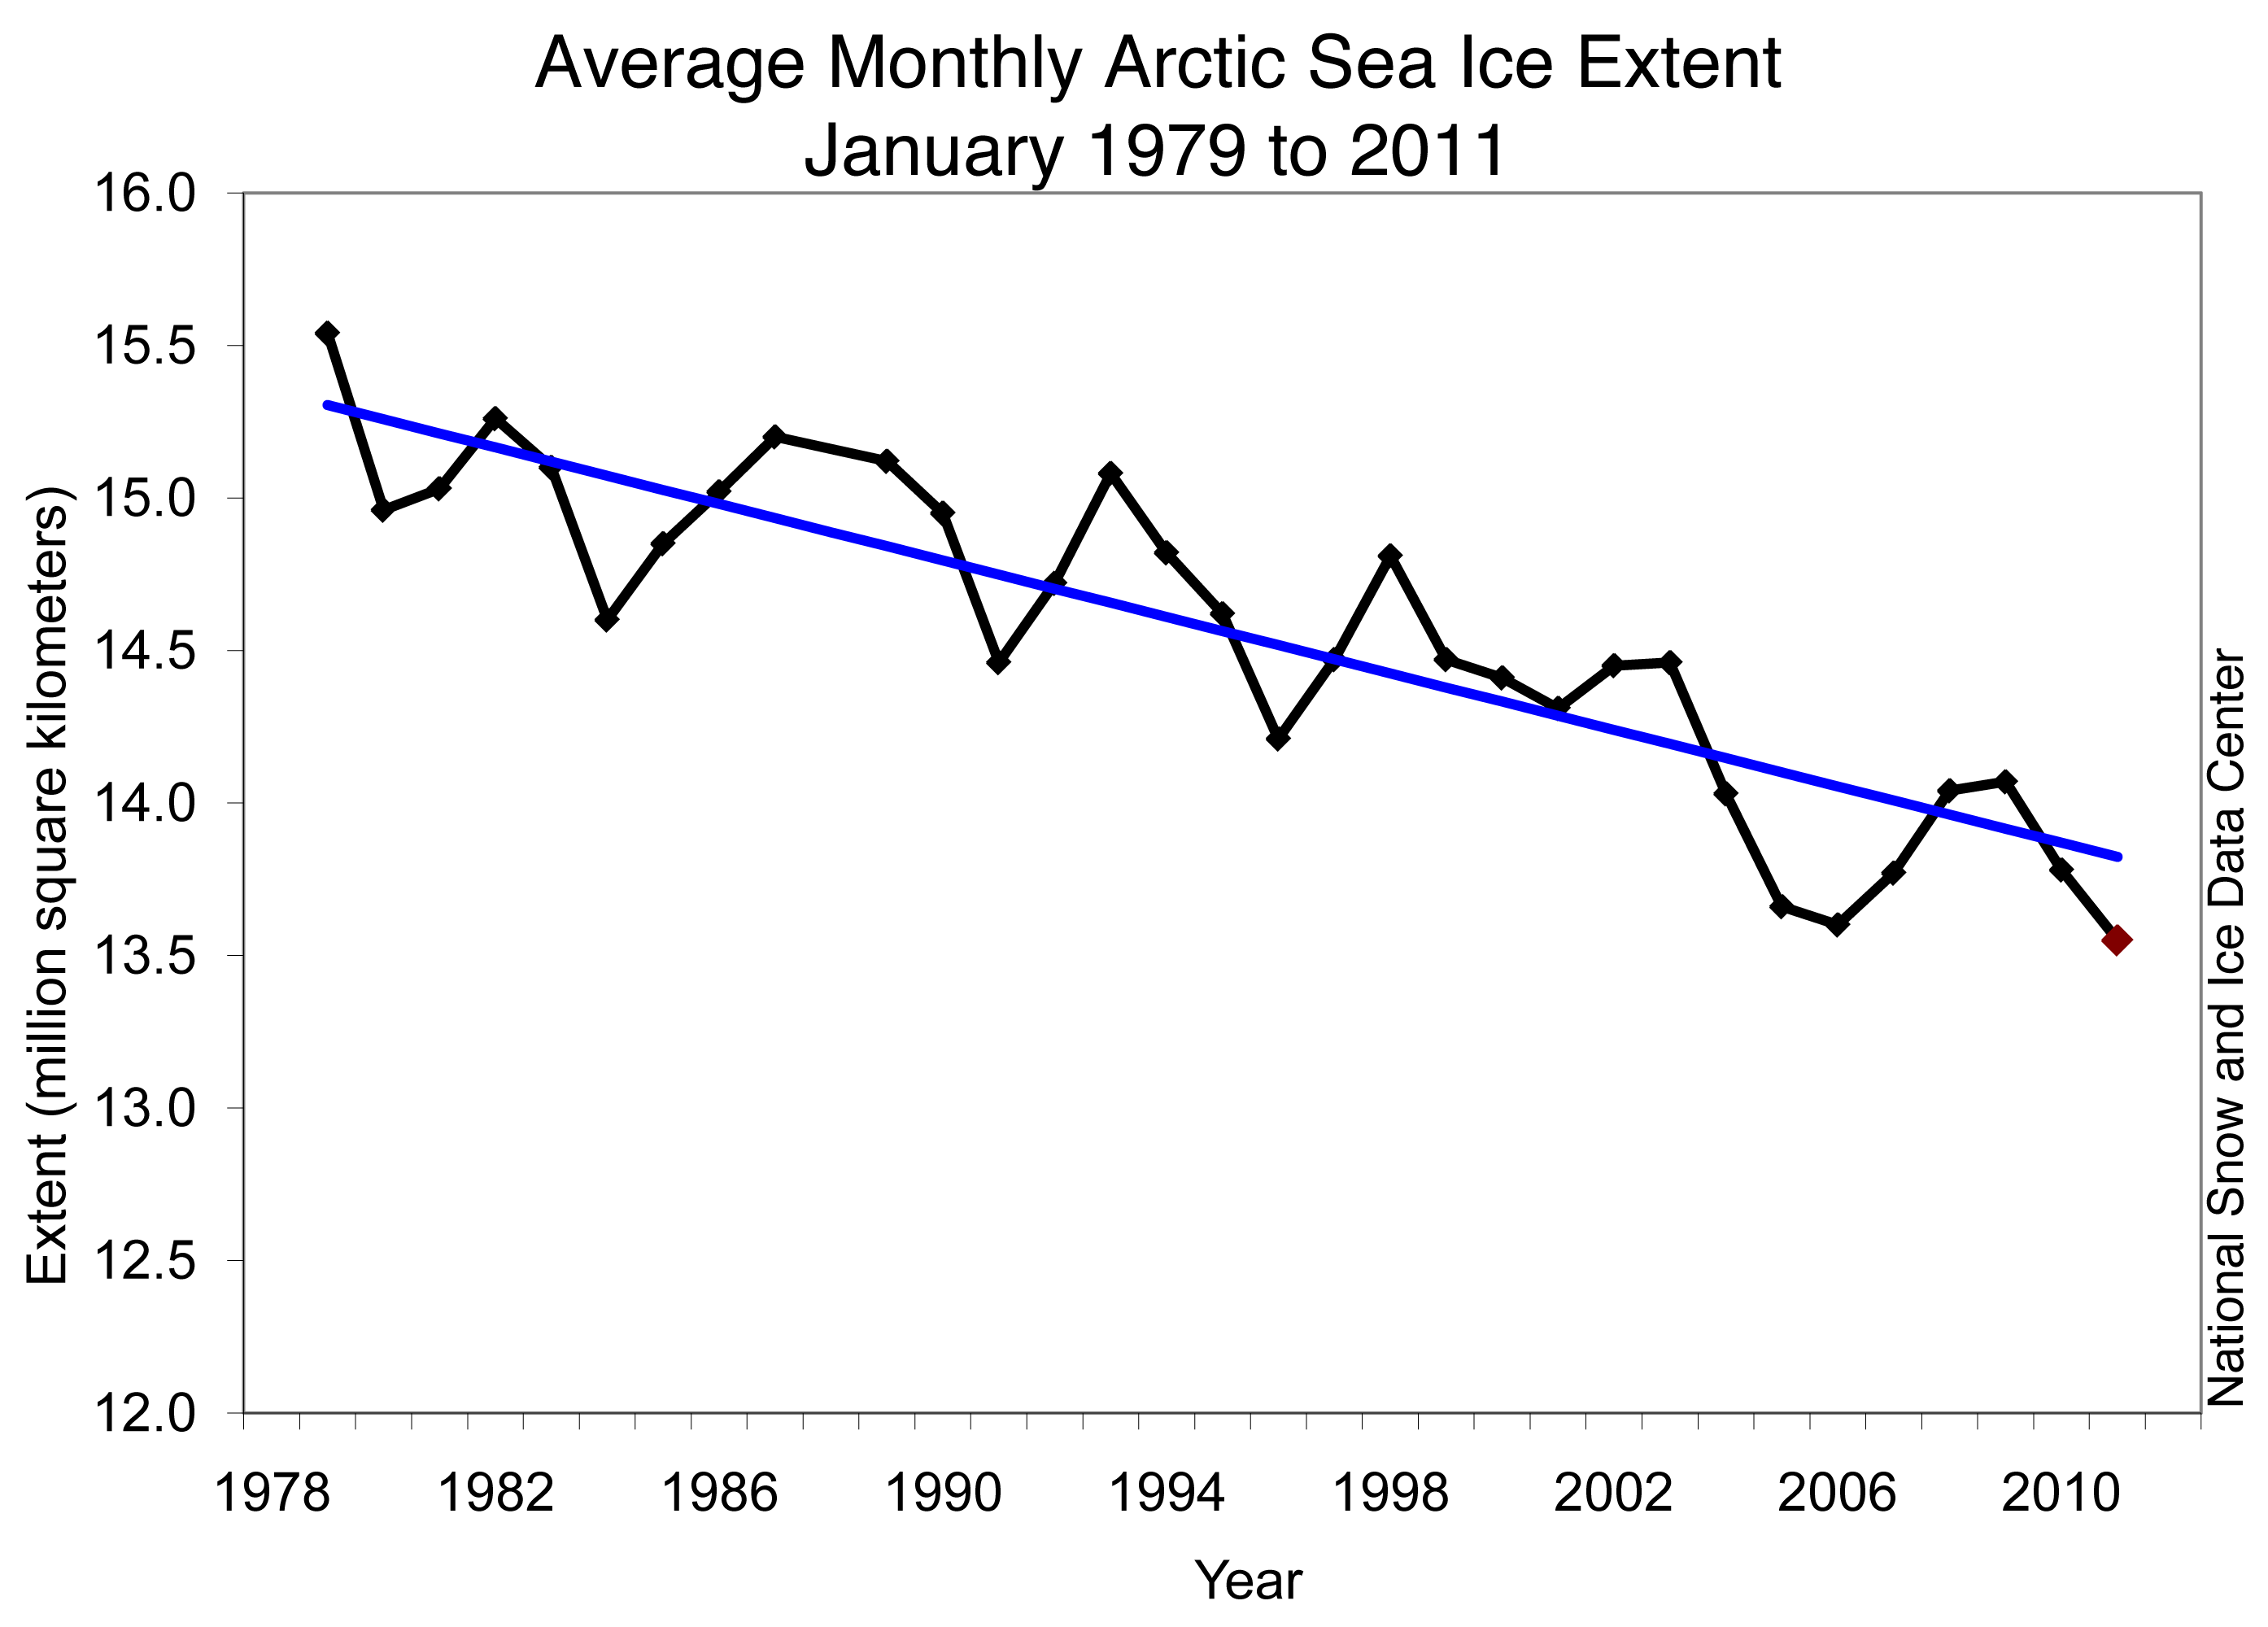
Monthly January ice extent for 1979 to 2011 shows a decline of 3.3% per decade. [Click to enlarge]
I know, the records broken this winter are supposed to be for cold weather. But the National Snow and Ice Data Center
reports:
January 2011 had the lowest ice extent for the month since the beginning of satellite records.
Why? Because while it’s been coolish in parts of the United States, it’s been very mild in the Arctic, especially northern Canada:
Hudson Bay did not completely freeze up until mid-January, about a month later than normal according to Canadian Ice Service analyses. The Labrador Sea region is still largely free of ice, except in protected bays along the coast. Normally at this time of year, ice extends several hundred kilometers from the coast all the way to northern Nova Scotia.
I have previously noted that
Canada was seeing staggering mildness as the planet’s high-pressure record is “obliterated”:

Surface temperature anomalies for the period December 17, 2010, to January 15, 2011, show impressive warmth across the Canadian Arctic….
The largest anomalies here exceed 21 °C (37.8 °F) above average, which are very large values to be sustained for an entire month.
In Coral Harbour, at the northwest corner of Hudson Bay
- After New Year’s Day, the town went 11 days without getting down to its average dailyhigh.
- On the 6th of the month, the low temperature was –3.7 °C (25.3 °F). That’s a remarkable 30 °C (54 °F) above average.
Now imagine how warm it is going to be in the Arctic when during these kinds of heat waves are compounded by several decades of global warming:
NSIDC asks the question:
While the Arctic has been warm, cold and stormy weather has affected much of the Northeast U.S. and Europe. Last winter also paired an anomalously warm Arctic with cold and snowy weather for the eastern U.S. and northern Europe. Is there a connection?
Their answer:
Warm conditions in the Arctic and cold conditions in northern Europe and the U.S. are linked to the strong negative mode of the Arctic oscillation. Cold air is denser than warmer air, so it sits closer to the surface. Around the North Pole, this dense cold air causes a circular wind pattern called the polar vortex, which helps keep cold air trapped near the poles. When sea ice has not formed during autumn and winter, heat from the ocean escapes and warms the atmosphere. This may weaken the polar vortex and allow air to spill out of the Arctic and into mid-latitude regions in some years, bringing potentially cold winter weather to lower latitudes.
Some scientists have speculated that more frequent episodes of a negative Arctic Oscillation, and the stormy winters that result, are linked to the loss of sea ice in the Arctic. Dr. James Overland of NOAA Pacific Marine Environmental Laboratory (PMEL) recently noted a link between low sea ice and a weak polar vortex in 2005, 2008, and the past two winters, all years with very low September sea ice extent. Earlier work by Jennifer Francis of Rutgers University and colleagues also suggested a relationship between autumn sea ice levels and mid-latitude winter conditions. Judah Cohen, at Atmospheric and Environmental Research, Inc., and his colleagues propose another idea—a potential relationship between early snowfall in northern Siberia, a negative phase of the Arctic Oscillation, and more extreme winters elsewhere in the Northern Hemisphere. More research on these ideas may shed light on the connections and have the potential to improve seasonal weather forecasting.
The more important three-dimensional metric of ice volume also continues its long-term decline (see
Navy’s oceanographer tells Congress, “the volume of ice as of last September has never been lower…in the last several thousand years”):

Researchers often look at ice age as a way to estimate ice thickness. Older ice tends to be thicker than younger, one- or two-year-old ice.
Wikipedia has a nice
plot of the long-term Arctic sea ice trend (via PIOMAS):
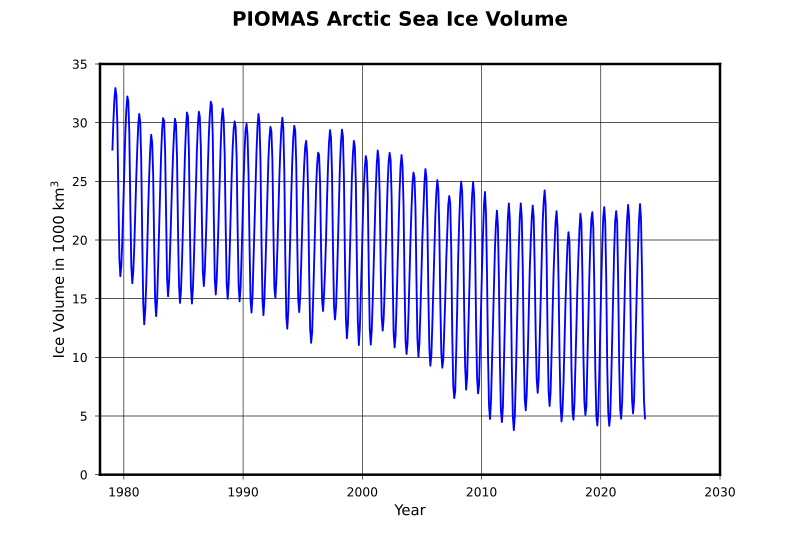
The Arctic sea ice death spiral lives.
Share
 Printhttp://climateprogress.org/2011/02/03/record-breaking-winter-arctic-lowest-sea-ice-extent/#more-41473


No comments:
Post a Comment