NSIDC Arctic Sea Ice Report, July 6, 2009: Melt season in high gear
Sign up for the Arctic Sea Ice News RSS feed for automatic notification of analysis updates. Updates are also available via Twitter.
 The Arctic is now in the midst of the summer melt season. Through most of June, ice extent tracked below the 1979-2000 average, and slightly above the levels recorded during June 2007. Warm temperatures and southerly winds led to quickly declining ice concentration in some regions, such as the Laptev Sea.
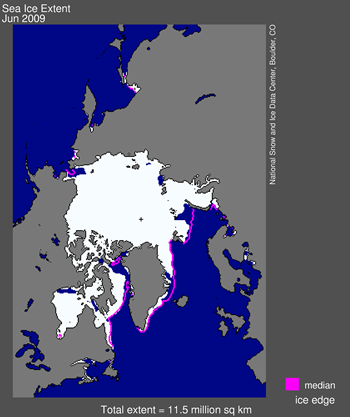 Figure 1. Arctic sea ice extent for June 2009 was 11.48 million km² (4.43 million sq. miles). The magenta line shows the 1979-2000 median extent for that month. The black cross indicates the geographic North Pole. Sea Ice Index data. About the data. —Credit: National Snow and Ice Data Center. High-resolution image
 Overview of conditions
Sea ice extent averaged over the month of June 2009 was 11.48 million km² (4.43 million sq. miles). This was 420,000 km² (162,000 sq. miles) above the record low for that month, which occurred in June 2006, and 700,000 km² (270,000 sq. miles) below the 1979-2000 average.
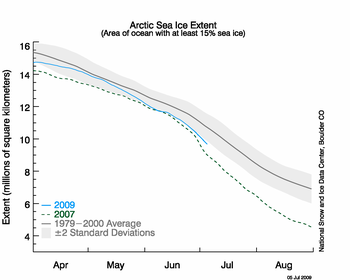 Figure 2. The graph above shows daily sea ice extent as of July 6, 2009. The solid blue line indicates 2009; the dashed green line shows 2007; and the solid gray line indicates average extent from 1979 to 2000. The gray area around the average line shows the two standard deviation range of the data. Sea Ice Index data. —Credit: National Snow and Ice Data Center. High-resolution image
 Conditions in context
Through most of June, ice extent tracked close to two standard deviations below the long-term mean and just above the levels observed in 2007. By the end of June 2009, ice extent was 337,000 km² (130,000 sq. miles) higher than extent at the end of June 2007.
During June, the Arctic Ocean lost a total of 2.05 million km² (792,000 sq. miles) of ice, an average decline of 68,300 km² (26,400 sq. miles) per day.
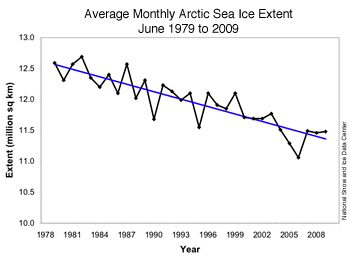 Figure 3. Monthly June ice extent for 1979-2009 shows a decline of 3.3% per decade. —Credit: National Snow and Ice Data Center .
High-resolution image
June 2009 compared to past Junes
Compared to previous Junes, ice extent in June 2009 was extremely close to the last two years, falling within 30,000 km² (12,000 sq. miles) of the June extent in 2007 and 2008. The long-term trend indicates a decline of 3.3% per decade, an average of 40,100 km² (15,500 sq. miles) of ice per year.
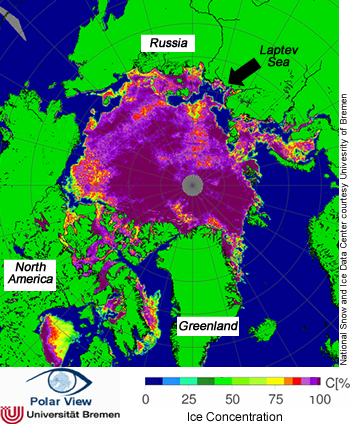 Figure 4. The map of sea ice concentration from AMSR-E from July 5, 2009 shows low ice concentrations in the Laptev Sea, where atmospheric temperatures have been particularly warm in the month of June. NASA AMSR-E data. —Credit: From National Snow and Ice Data Center courtesy IUP, University of Bremen, Germany. High-resolution image
 Warm conditions speed regional melt
In June, the Arctic saw warm temperatures over the Laptev Sea and the northern Beaufort Sea, while the Atlantic sector of the Arctic was slightly cooler than normal. The warm temperatures in the Laptev Sea corresponded to quickly declining ice concentrations in the area. The decline can be seen in sea ice concentration analyses produced at the University of Bremen using NASA Advanced Microwave Sounding Radiometer-Earth Observing System (AMSR-E) data. We expect this region to become largely ice-free in the next few weeks.
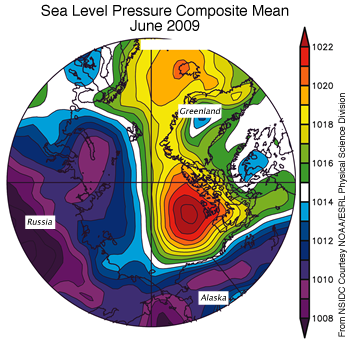 Figure 5. The map of sea level pressure (in millibars) from June 1 to 30, 2009 shows high pressure (red) over the northern Beaufort Sea and a weak low (purple) centered over Novaya Zemlya. —Credit: From National Snow and Ice Data Center courtesy NOAA/ESRL Physical Sciences Division. High-resolution image
 Southerly winds promote warmth
The warmth in the Laptev Sea is consistent with a pattern of southerly winds in these areas, which can be linked to the area of low atmospheric pressure centered just north of Novaya Zemlya Island. Note also the strong high-pressure cell (an anticyclone) over the northern Beaufort Sea.
This contrast between high and low pressure is broadly similar to the atmospheric circulation pattern that set up in 2007. In 2007, that pattern contributed to a significantly accelerated decline in ice extent during July, and a record minimum low in September. Will the same acceleration in ice melt occur this year? If so, a new record low minimum extent becomes more likely. So far, an acceleration has not been observed. As July progresses, the Arctic sun gets lower on the horizon, incoming solar energy decreases, and the chances of such a rapid decline become less likely.


No comments:
Post a Comment