Blog Archive
Saturday, July 25, 2015
Wednesday, July 22, 2015
"Linking interannual variability in extreme Greenland blocking episodes to the recent increase in summer melting across the Greenland ice sheet," by J. T. McLeod & T. L. Mote, International Journal of Climatology, 19 July 2015: doi: 10.1002/joc.4440
International Journal of Climatology, 19 July 2015; doi: 10.1002/joc.4440
Linking interannual variability in extreme Greenland blocking episodes to the recent increase in summer melting across the Greenland ice sheet
Jordan T. McLeod and Thomas L. Mote
Abstract
Linking interannual variability in extreme Greenland blocking episodes to the recent increase in summer melting across the Greenland ice sheet
Jordan T. McLeod and Thomas L. Mote
Abstract
Atmospheric blocking commonly occurs over the high latitudes of the Northern Hemisphere, resulting from the development of persistent areas of high pressure that lead to warmer-than-average surface temperatures west of the high centre. While the variability and trends in anticyclonic circulation patterns (including blocking) over Greenland have been previously documented, an analysis of the most extreme blocking events within the observational record is lacking. In this study, a historical climatology of extreme Greenland blocking episodes (GBEs) from 1958 to 2013 is examined within the context of anomalous anticyclonic circulation patterns over the North Atlantic region during recent years. Based on a combination of the ERA-40 (1958–1978) and ERA-Interim (1979–2013) reanalysis data sets, the Greenland Blocking Index (GBI) is used to quantify 500-hPa geopotential-height anomalies for the identification of extreme GBEs. The annual rate of extreme blocking days has doubled since 1958, reaching an average of approximately 20 days per year by 2013. The frequency and, to some extent, duration of extreme GBEs were unprecedentedly high from 2007 to 2013 compared to the 56-year period of record, with a majority of the increase occurring during the spring (MAM) and summer (JJA). A multiple linear regression analysis reveals that interannual variability in extreme blocking and the Atlantic Multidecadal Oscillation (AMO) are the two predominant drivers of surface meltwater production across the entire Greenland ice sheet (GrIS), but Arctic sea ice extent and North Atlantic cyclone activity can also influence the extent of summer melting over portions of the GrIS. Thus, in addition to the larger-scale atmospheric and oceanic variability, smaller-scale features such as extratropical cyclones can play a significant role in modulating GrIS surface melting each summer.
Key words: atmospheric blocking, Greenland ice sheet, extratropical cyclones, North Atlantic, Arctic amplification, cryosphere, Arctic sea ice, climate change
http://onlinelibrary.wiley.com/doi/10.1002/joc.4440/abstract
Key words: atmospheric blocking, Greenland ice sheet, extratropical cyclones, North Atlantic, Arctic amplification, cryosphere, Arctic sea ice, climate change
http://onlinelibrary.wiley.com/doi/10.1002/joc.4440/abstract
James Hansen: ‘Emergency Cooperation Among Nations’ Is Needed to Prevent Catastrophic Sea Level Rise
If a new scientific paper is proven accurate, the international target of limiting global temperatures to a 2 °C rise this century will not be nearly enough to prevent catastrophic melting of ice sheets that would raise sea levels much higher and much faster than previously thought possible.
According to the new study—which has not yet been peer-reviewed, but was written by former NASA scientist James Hansen and 16 other prominent climate researchers—current predictions about the catastrophic impacts of global warming, the melting of vast ice sheets and sea level rise do not take into account the feedback loop implications of what will occur if large sections of Greenland and the Antarctic are consumed by the world’s oceans.
A summarized draft of the full report was released to journalists on Monday, with the shocking warning that such glacial melting will “likely” occur this century and could cause as much as a 10 foot sea-level rise in as little as 50 years. Such a prediction is much more severe than current estimates contained in reports issued by the Intergovernmental Panel on Climate Change (IPCC) — the UN-sponsored body that represents the official global consensus of the scientific community.
“If the ocean continues to accumulate heat and increase melting of marine-terminating ice shelves of Antarctica and Greenland, a point will be reached at which it is impossible to avoid large scale ice sheet disintegration with sea level rise of at least several meters,” the paper states.
Separately, the researchers conclude that “continued high emissions will make multi-meter sea level rise practically unavoidable and likely to occur this century. Social disruption and economic consequences of such large sea level rise could be devastating. It is not difficult to imagine that conflicts arising from forced migrations and economic collapse might make the planet ungovernable, threatening the fabric of civilization.”
The Daily Beast‘s Mark Hertsgaard, who attended a press call with Dr. Hansen on Monday, reports that the work presented by the researchers is
"...warning that humanity could confront “sea level rise of several meters” before the end of the century unless greenhouse gas emissions are slashed much faster than currently contemplated.
This roughly 10 feet of sea level rise—well beyond previous estimates—would render coastal cities such as New York, London, and Shanghai uninhabitable. “Parts of [our coastal cities] would still be sticking above the water,” Hansen said, “but you couldn’t live there.”
This apocalyptic scenario illustrates why the goal of limiting temperature rise to 2 degrees Celsius is not the safe “guardrail” most politicians and media coverage imply it is, argue Hansen and 16 colleagues in a blockbuster study they are publishing this week in the peer-reviewed journal Atmospheric Physics and Chemistry. On the contrary, a 2C future would be “highly dangerous.”
If Hansen is right—and he has been right, sooner, about the big issues in climate science longer than anyone—the implications are vast and profound.
In the call with reporters, Hansen explained that time is of the essence, given the upcoming climate talks in Paris this year and the grave consequences the world faces if bold, collective action is not taken immediately. “We have a global crisis that calls for international cooperation to reduce emissions as rapidly as practical,” the paper states.
Hansen said he has long believed that many of the existing models were under-estimating the potential impacts of ice sheet melting, and told the Daily Beast: “Now we have evidence to make that statement based on much more than suspicion.”
Though he acknowledged the publication of the paper was unorthodox, Hansen told reporters that the research itself is “substantially more persuasive than anything previously published.”
For his part, Eric Holthaus, a meteorologist who writes about weather and climate for Slate, said the “bombshell” findings are both credible and terrifying. Holthaus writes:
To come to their findings, the authors used a mixture of paleoclimate records, computer models, and observations of current rates of sea level rise, but “the real world is moving somewhat faster than the model,” Hansen says.
[…] The implications are mindboggling: In the study’s likely scenario, New York City—and every other coastal city on the planet—may only have a few more decades of habitability left. That dire prediction, in Hansen’s view, requires “emergency cooperation among nations.”
In response to the paper, climate scientist Michael Oppenheimer of Princeton University affirmed: “If we cook the planet long enough at about two degrees warming, there is likely to be a staggering amount of sea level rise. Key questions are when would greenhouse-gas emissions lock in this sea level rise and how fast would it happen? The latter point is critical to understanding whether and how we would be able to deal with such a threat.”
The new research, Oppenheimer added, “takes a stab at answering the ‘how soon?’ question but we remain largely in the dark. Giving the state of uncertainty and the high risk, humanity better get its collective foot off the accelerator.”
And as the Daily Beast‘s Hertsgaard notes, Hansen’s track record on making climate predictions should command respect from people around the world. The larger question, however, is whether humanity has the capacity to act.
“The climate challenge has long amounted to a race between the imperatives of science and the contingencies of politics,” Hertsgaard concludes. “With Hansen’s paper, the science has gotten harsher, even as the Nature Climate Change study affirms that humanity can still choose life, if it will. The question now is how the politics will respond—now, at Paris in December, and beyond.”
Alun Hubbard, Jason Box: Heavy summer rain in Greenland speeds up ice melt
Rapid ice melt in Greenland is driven by intense late summer rainfall, making the vast ice sheet even more vulnerable as the earth warms, new research shows
Formation of lakes on the Greenland Ice Sheet after the main melt-season due to warm wet weather and heavy rain. Later this water drains to the bottom of the ice sheet enabling it to move and melt faster. This makes the ice sheet more vulnerable to such rapid melt events as the climate warms, scientists say in a new study. (Photo: Sam Doyle)
by Catherine Jex, ScienceNordic, July 13, 2015
You may think that warmer temperatures alone were enough to drive the melting of the Greenland Ice Sheet, and you would not be alone -- many glaciologists thought roughly the same.
But a new study shows for the first time that the Greenland Ice Sheet melts rapidly, not just with warm summer temperatures, but also after intense late-summer rain.
The new study shows that these heavy rain events have occurred frequently due to the warmer, wetter weather of the last 20 years, penetrating deeper into the ice sheet, making it move and melt faster.
“We saw 10 to 15 % of the total annual surface melt occur in this unusual week of warm, wet weather in late summer 2011. When this water reached the bed, the ice sheet lifted up and moved faster,” says Sam Doyle, from Aberystwyth University, UK, lead author of the new study, which has just been published in Nature Geoscience.
According to his colleague and co-author, professor Jason Box of the Geological Survey of Denmark and Greenland, their results add more weight to scientists’ concerns of the sensitivity of the entire Greenland Ice Sheet to melting.
“We’re seeing that warm wet weather, that is increasing with climate change, is driving more melt of the Greenland Ice Sheet than we thought. And worryingly, this melt is reaching further into the ice sheet,“ says Box, speaking via satellite phone, along with Doyle, as they work together on another field trip on Greenland.
Scientist: An interesting, thorough, and novel study
Edward Hanna, professor in climate change with the University of Sheffield, UK, is impressed with the new study.
“This is an interesting, thorough and novel study based on a wealth of robust meteorological and glaciological datasets, and is based on meteorological models as well as observations,” says Hanna, who was not involved in the research.
“The study adds to an already complex story of how Greenland Ice Sheet dynamics appear to be influenced by changes in weather conditions, sometimes on a daily timescale,” he says.
Heavy rain makes the Greenland Ice Sheet move
The study began after observing exceptionally warm wet weather in late summer 2011, causing huge amounts of melt at the ice surface. At this time of the year, there was no snow on the surface of the ice to absorb and act as a buffer for all this rain and melt water, which then moved very quickly through the ice sheet.
“At first our observations of this late-August intense rainfall and melt event were met with the attitude of 'hey big deal, it’s summer, it melts,’ ” says professor Alun Hubbard from the Center for Arctic Gas Hydrate, Environment and Climate at the Arctic University of Norway, and principle investigator of the project that led to the study.
A monster moulin on the Russell Glacier, Greenland. You can see a helicopter for scale. These large gaping holes allow rain and melt water to drain quickly into the ice sheet. (Photo: Alun Hubbard)
“But this new data, shows these periods of rapid movement of the ice are in fact tied to a particular type of rainfall event, the kind of storm you would expect to see in the mid-latitudes -- UK or Scandinavia -- and not so much in Greenland where high-pressure systems are more common.”
“We can now reinterpret these big late summer melt events to get a much better understanding of what is going on -- what is affecting the ice sheet system and how it is responding,” he says.
Imagine a storm drainage system after heavy rain
Hubbard uses the analogy of a storm drainage system, to explain how the rain and melted ice moves through the ice sheet so quickly.
“Imagine a big downpour in a city. You get so much rain so quickly, on to an impermeable concrete surface that the water is immediately shunted into the city's drainage system -- which due to the huge volumes of water -- can't cope. Drains back up and it floods. Basically, the same thing happens on the bare ice sheet surface, which like the city is literally comprised of pipes, conduits and cavities,” he says.
According to him, when these pipes back up, the hydraulic pressure lifts the ice sheet up, like a gigantic iceberg. There is less friction at the bed and so it moves faster.
Melting extends far into glacier interior
But observing one event was not enough to convince some glaciologists that this process is important over longer periods of time, or that rain could cause melting over such a wide area.
Doyle and his team analysed the strange event in more detail.
They monitored the ice-movement by GPS, set up their own weather stations on the ice, and measured how much water was being discharged from the ice sheet.
According to Hubbard, the rain event covered a huge area, and melting extended deep into the interior of the ice sheet, by about 140 km. This is where you would expect it to be frozen, and for rain to fall as snow.
They also gathered rainfall data for the last 20 years and compared it with other known melt events across Greenland.
“We saw these August rainfall events were in fact quite common, a major one occurring once every couple of years, and hence could explain some of the other rapid flow acceleration events recorded by other research groups working on the ice sheet,” says Hubbard.
Timely rainfall catches the ice sheet off guard
A scientist watches melt water drain from the Russell glacier catchment in Greenland. Scientists do not yet know just how often these rapid melt events may occur in the future as the earth warms and Greenland receives more rain. (Photo: Sam Doyle)
According to Doyle, it is not only the amount of rainfall that is important, but also the precise timing of this rain.
“The late-summer timing was critical. The event occurred after the end of the melt season and the ice sheet's drainage system had started to close down,” he says.
“In this closed-down state the ice sheet's drainage system just couldn’t cope with the exceptional water inputs from melt and rain, and this is why the ice sheet reacted so dramatically, lifting off its bed and accelerating the flow of the ice towards the sea,” he says.
Scientists expect more melt due to rain
Box emphasizes how climate change will continue to drive this process in the future.
“It is rain and warmer temperatures that cause melt, and we show that this melting trend has been underway for the last two decades as the atmosphere has warmed,” he says.
According to Hubbard, a succession of these rain events would have a big impact on the ice sheet -- allowing it to melt more and move faster.
“By speeding up the ice sheet, we are effectively turning up the tap -- opening the sluice gate and hastening the speed at which the ice moves and melts and hence ends up in the ocean. But we don’t yet know for sure how frequent or how intense these late-season rainfall events will be in the future,” he says.
Hanna echoes this caution.
“The trouble is we don't really have a clear prediction of how such events will change in frequency and intensity over Greenland with ongoing climate change,” he says.
“But certainly this is another, now well-evidenced potential feedback that should be included in studies of ice sheet change during the rest of this century,” says Hanna.
Country Denmark
Related content
http://sciencenordic.com/heavy-summer-rain-greenland-speeds-ice-melt
Monday, July 20, 2015
Updated ice sheet model matches wild swings in past sea levels: Changes make Antarctica lose more ice, faster
by Scott K. Johnson, arstechnica, January 25, 2015
Map showing portions of Antarctica's land surface that are actually below sea level, which makes the glacial ice there (which is much too thick to float) more vulnerable to retreat.
It has been a bit of a head scratcher. Records of sea level during the last few million years tell us that there have been some warm periods where sea level may have been as much as 20 meters higher than it is today. When fed the conditions that prevailed at the time, however, our computer models of ice sheets haven’t been able to reproduce such a swelling of the ocean.
The models can simulate that much sea level rise, but it requires temperatures much higher than were seen during those warm periods. Realistic losses of ice from Greenland and the fragile, western part of Antarctica (the West Antarctic Ice Sheet) could only provide something in the neighborhood of 3 to 10 meters of sea level rise. That leaves 10 to 17 meters for the East Antarctic Ice Sheet—the largest and most stable ice sheet—to chip in. Convincing the miserly East Antarctic Ice Sheet to be that generous with its contents isn’t easy, which is why the models required such high temperatures.
Updating the models
So what are the models missing? Penn State’s David Pollard and Richard Alley, and University of Massachussetts, Amherst’s Robert DeConto had an idea for something to try. Two things to try, really. They added a pair of physical processes to an ice sheet model that weren’t simulated previously. The first was hydrofracturing. When water reaches the ice sheet from rain or ice melt at the surface, it fills crevasses in the ice.
If they're filled to a great enough depth, the water pressure forces the crevasse to open even deeper—that's termed hydrofracturing. The other process results from the simple fact that a sheer cliff of ice can only be so tall before it collapses under its own weight—a condition not encountered in too many places today.
One place it does occur is where floating glaciers calve large icebergs. These occur on the coastal outlet glaciers at the edges of ice sheets that are the most vulnerable to warming. The glacier thins towards its outer edge, and at some point it grows thin enough that it begins to float. The point at which it floats off the bottom is called the “grounding line”—from there out to the end of the ice is called an ice shelf. Ice shelves that grind against the shore (think of it floating in a bay or fjord) act to hold back the flow of ice behind them. These shelves gradually melt from below as they float in their seawater bath. But they can also melt from above and shed large bergs of ice at their outer edge.
Both hydrofracturing and cliff failure can increase the shedding of icebergs from shelves, hastening their demise and uncorking the glacier behind them. Once these things are happening near the grounding line, though, they can really accelerate its retreat if it's in an unstable configuration where the ground surface drops as you head inland. (Significant portions of Antarctica match that description.) Once you start retreating in that situation, the glacier may have to retreat a long way to find a stable position again.
A hasty retreat
Having added representations of these two processes to the model, the researchers simulated a sudden change from modern conditions to warmer conditions like those past periods of very high sea level. Then they watched the virtual Antarctic glaciers respond.
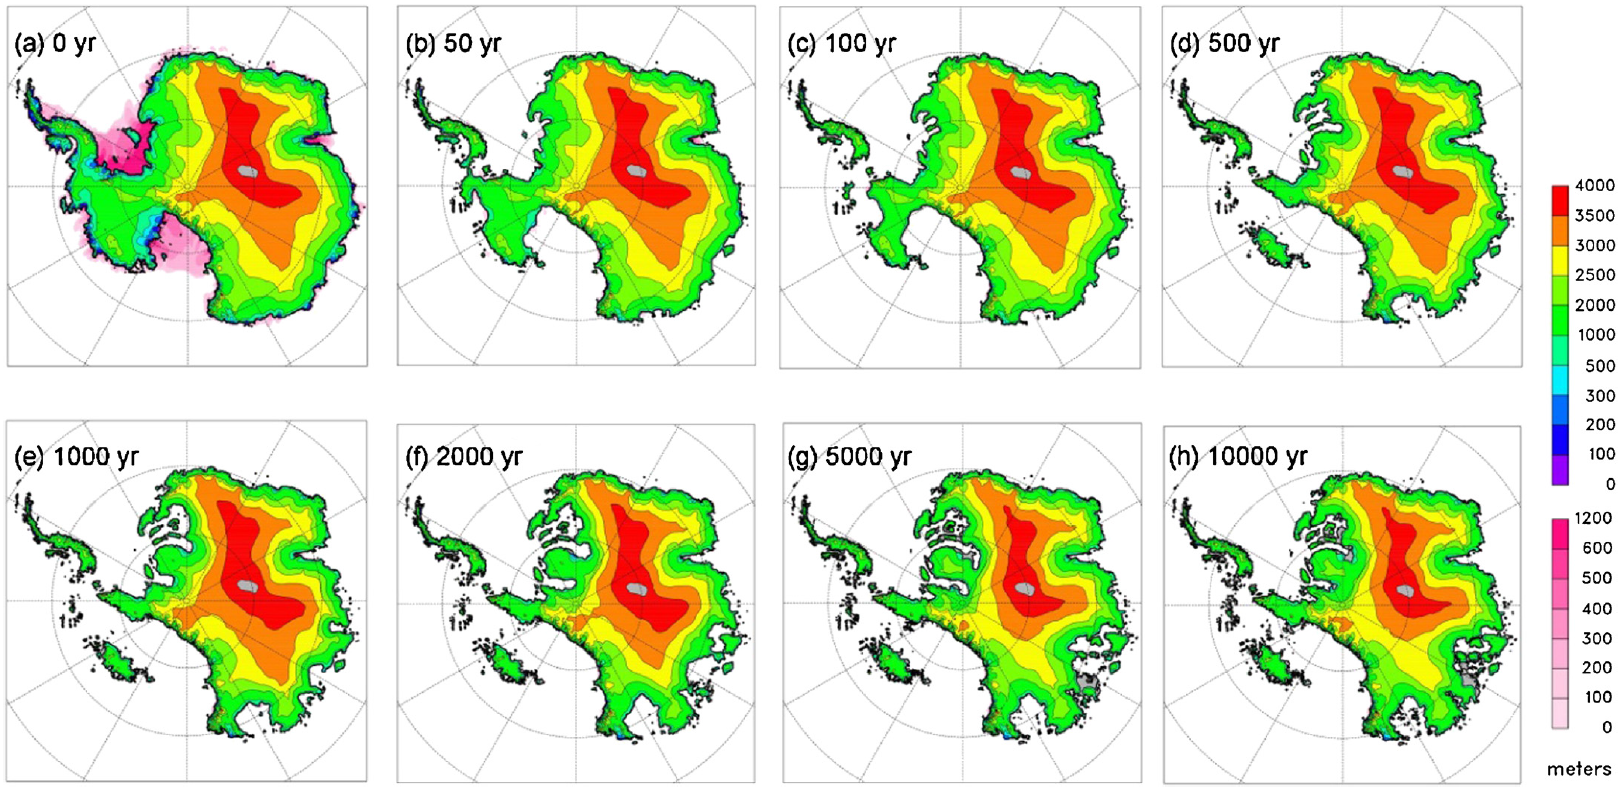
The results were dramatic. The new processes combined to have a huge impact. Instead of about 2 meters of sea level rise, Antarctica lost enough ice to raise global sea level 17 meters over several thousand years. The fragile West Antarctic Ice Sheet collapses in a matter of decades, rather than centuries or millennia. There’s 5 meters of sea level rise in the first two centuries, after which retreat in portions of the East Antarctic Ice Sheet really get going.

Enlarge / Results after the change to warmer conditions in the model. The rainbow color scale shows the elevation of the ice surface on land, while the pink scale shows thickness of floating ice. Pollard, DeConto, and Alley, Earth and Planetary Science Letters
Much more work will be required to make sure these new processes are being simulated accurately, but the early returns show it could put researchers in the ballpark of solving the puzzle of past high sea levels.
The relevance for our present situation is less direct, as the warming in the simulation was not realistic, but the possibility that West Antarctica could lose ice faster than we thought is a serious one. Richard Alley, whose work on this possibility we’ve covered before, explained to Ars via email, “I believe (and I suspect many people do) that it is important for us as scientists to provide not only the most-likely future outcome, but also the range of possibilities, including some sort of assessment of best-case and worst-case outcomes. Best-case is fairly easy, I believe, but worst-case is not; however, providing both is likely to be useful to many people.”
“The physical knowledge that too-tall cliffs fail is very old and familiar to every miner or quarry-worker. The physical knowledge that ice is not the strongest rock on the planet is also rather old. And, the suggestion that cliff failure could affect West Antarctic stability dates back to 1962,” Alley wrote. “We now have stronger evidence that sufficient West Antarctic retreat could lead to a higher calving front than any on Earth today, and higher than a stability limit suggested by recent papers. Putting that understanding into projections of the future, as in our new paper, has implications for the worst-case scenario. And, testing against the paleoclimatic record provides support for that understanding.”
He continued, “It is still too early to say that this is an accurate worst-case scenario. Step-application of the [warming] is too extreme, clearly… but, it is within the realm of possibility that for the time-scale of collapse, the true worst worst-case scenario could be even a bit faster than modeled here; the renewed interest in this topic is recent, and the number of scientific papers exploring the physics remains low.”
Earth and Planetary Science Letters, 2014. DOI: 10.1016/j.epsl.2014.12.035
Beneath the permafrost, fountains wait to burst forth
Wilderness guide Garrett Jones takes a photo of water fountaining from the tundra near the middle fork of the Chandalar River. (Photo: Ned Rozell)
by Ned Rozell, Alaska Dispatch, June 27, 2015
While tight-roping on tussock heads in a bog off the Chandalar River, two companions and I heard a waterfall. Strange.
Looking through binoculars, we saw a knee-high fountain of clear water in the tundra. The flow was as thick as your leg. We squished over to investigate.
The three of us had never seen water spewing from the ground in such a way. The clear water was so cold it burned, forcing us to pull our hands back after a second or two.
A few days later, on our flight out of the Bush, pilot Dirk Nickisch said yes, he had seen tundra "hydrants" in a few Arctic valleys. When I got back, local experts watched this video.
A fountain in a tussock bog near the Middle Fork Chandalar River.
They theorized that we had seen the effect of high-pressure groundwater finding a way through permafrost.
Permafrost pressure
Dan White is a hydrologist by trade who wears his Xtratuf boots less often now as the University of Alaska's vice president of academic affairs and research. He thinks the hydrant may be an artesian well pressurized by a permafrost barrier.
"Looks like water entering the subsurface from higher on the mountain," he wrote in an email. "That is just the place it found to get out through the frozen ground. My guess is that water is channeling though a thawed ice wedge or something."
The gusher is about 75 miles north of the Arctic Circle, on the south slope of the Brooks Range. That part of northern Alaska has remained cold enough to preserve permafrost — ground that remains frozen through the heat of at least two summers (it often has endured thousands of summers). The area featured other permafrost-related landforms, such as a house-size pingo. We ate lunch on top of the mound one day, noticing the birch trees that grew on it were rare in the surrounding spruce forest.
Permafrost researcher Kenji Yoshikawa said sometimes pingos and frost blisters generate fountains. He thinks what we saw might be related to a frost blister, a pimple caused when freezing ground in early winter blocks groundwater already restricted from beneath by permafrost. The fountain we saw might be what happened when the pimple popped.
'Uncontrolled artesian well'
Water held under pressure by permafrost can be a problem if we try to use it. In 1946, workers for the Army Corps of Engineers drilled a well near the eastern end of Farmers Loop in Fairbanks. They penetrated a permafrost layer and the non-frozen layer beneath it. At about 100 feet, they hit water. It was under so much pressure that a 4-foot gusher erupted from the drill hole.
Water flowed around the well casing in what engineers called an "uncontrolled artesian well." Corps workers pumped cement down the casing to seal the well. They topped it with a 10-foot square of concrete that was 1 foot thick.
"In August 1948, the final loss of control occurred," wrote geologist Troy Péwé in the chilling publication Geologic Hazards of the Fairbanks Area. "Water began escaping from beneath the 10-foot square, and during the summer of 1949 the slab collapsed into an enormous, water-filled thermokarst cavity. Eventually the slab sank as much as 50 feet below the surface."
Two years later, engineers injected refrigerant brine in the ground and installed freeze probes around the wellhead. That refroze the well shaft and reestablished the permafrost seal.
Thirty years later, a drilling company sunk a well in the same area. It flowed out of control all winter, covering a portion of Farmers Loop with 2 feet of ice and inspiring lawsuits from local homeowners whose houses and cars became glaciated.
Ned Rozell is a science writer at the University of Alaska Fairbanks Geophysical Institute. Used with permission.
Robert Schribbler: Concern Over Catastrophic Methane Release — Overburden, Plumes, Eruptions, and Large Ocean Craters
by Robert Schribbler,
The amount of methane in the Arctic hydrates alone is estimated as 400 times more than the global atmospheric CH4 burden. The question is timescale of the methane liberation: gradual, abrupt, or something in between. Satellite monitoring of methane over the Arctic Ocean is necessary. — Dr. Leonid Yurganov
* * * *
Depending on who you listen to, it’s the end of the world, or it isn’t. A loud and lively debate that springs up in the media every time a new sign of potential methane instability or apparent increasing emission from methane stores is reported by Arctic observational science.
On one side of this debate are those declaring the apocalypse is nigh due to, what they think, is an inevitable catastrophic methane release driven by an unprecedentedly rapid human warming of the Arctic. A release large enough to wipe out global human civilization. These doomsayers are fueled by a number of scientists (usually Arctic observational specialists) who continue to express concern — due to an increasing number of troubling, if not yet catastrophic, rumblings coming from the Arctic carbon store. The Arctic is warming faster than it ever has, they accurately note. And this very rapid rate of warming is putting unprecedented and dangerous stresses on carbon stores, including methane, that have lain dormant for many millions of years. The risk of catastrophic release, therefore, is high enough to sound the alarm.
On the other side are a number of mainstream news outlets backed up by a group of established scientists. This group claims that there’s generally no reason to worry about a methane apocalypse. The methane releases so far are relatively small (on the global scale) and there are all sorts of reasons why future releases will be moderate, slow in coming, and non-catastrophic. The methane store most pointed toward by methane catastrophists — a frozen water methane known as hydrate — tends to self-regulate release, in most cases, acting as a kind of pressure valve that would tend to moderate emission rates and prevent instances of catastrophic eruption (please see The Long Thaw).
A third group appears to have somewhat sidestepped an otherwise polarized discourse. Outlets like ThinkProgress and others have continued to quietly report observations without drawing conclusions, one way or the other, on the issue of near-term methane apocalypse. They point, instead, to what are, admittedly, some rather odd and scary methane rumblings going on near the pole. Among this ‘middle ground’ group are a survey of about 100 researchers who’ve identified a likely carbon release (including both methane and CO2) from the Arctic equaling between 10 and 35 percent of the human emission by the end of this century (please see High Risk of Permafrost Thaw). It is a ‘middle ground’ that is troubling enough. For 10-35% of the human carbon emission coming from the Arctic is a massive release in the range of 1 to 3.5 gigatons of carbon (with a fraction as volatile methane). If such an emission does materialize, it will equal (on the low end) or exceed the annual rate of environmental carbon release last seen during the PETM — a hothouse extinction 55 million years ago that turned the oceans into killers and forced life on land to shrink in size and burrow to avoid the awful heat and stifling atmosphere of that age.
Regardless of where you stand in this discourse, the Arctic itself continues to provide cause for both debate and appropriate concern.
Methane Overburden
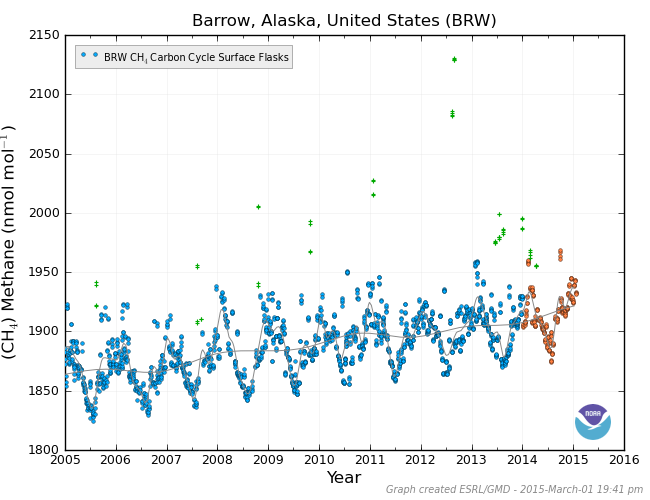
Barrow surface methane observations by NOAA ESRL show methane readings that range about 60 ppb above the global average. Note the 50 ppb increase over the past decade coincident with numerous ‘outlier’ spikes [green cross hatches] from local sources. Image source: NOAA ESRL.
Perhaps the most obvious sign that there’s something not quite right going on in the Arctic is a large overburden of both methane and CO2 in the region. Looking at NOAA’s ESRL site, we find that methane levels at Barrow, Alaska (one of just a handful of Arctic sensor stations in the ESRL network), are in the range of 1,910 parts per billion. By comparison, NOAA’s Mauna Loa Station, on the edge of the tropics and well away from the polar overburden, records about 1,850 parts per billion (ppb).
At current rates of atmospheric methane increase, it will take about 9 years for Mauna Loa to catch up to where Barrow is now. But by that time Barrow may be pushing 1,970 ppb or more. In addition, all Arctic stations record numerous anomalous spikes in methane from local sources. The ESRL site lists these spikes as outliers. But, for all the ESRL reporting stations, the Arctic stations are the ones that host by far the most numerous such outliers. The local methane sources, therefore, appear to be quite active in the Arctic. An observation that polar scientist, Dr Jason Box, admits keeps him awake at night.
Global distribution of methane averaged over 2011 by NASA/AIRS. Note the very high concentrations in the Arctic region. For this map, the highest concentrations occur in the Yedoma region of Russia, a region of multiplying methane emitting tundra melt and thermokarst lakes [see below]. Image source: NASA/AIRS.
Perhaps the most reliable way to sample the Arctic methane overburden is to get a full view of it through satellite sensors. The above NASA image taken in 2011 shows a massive methane overburden in the upper latitudes that slowly diffuses southward. Note the highest concentrations in this image are near the permafrost zones in Yedoma in northeastern Russia.
NOAA also provides its METOP array which frequently finds methane concentrations at above 2,400 parts per billion at the 10,000 to 20,000 foot level in broad blankets over the Arctic region — especially in the months of September through November and then again in January. Again, these measures are the highest in any region of the globe, and they occur directly over the Arctic.
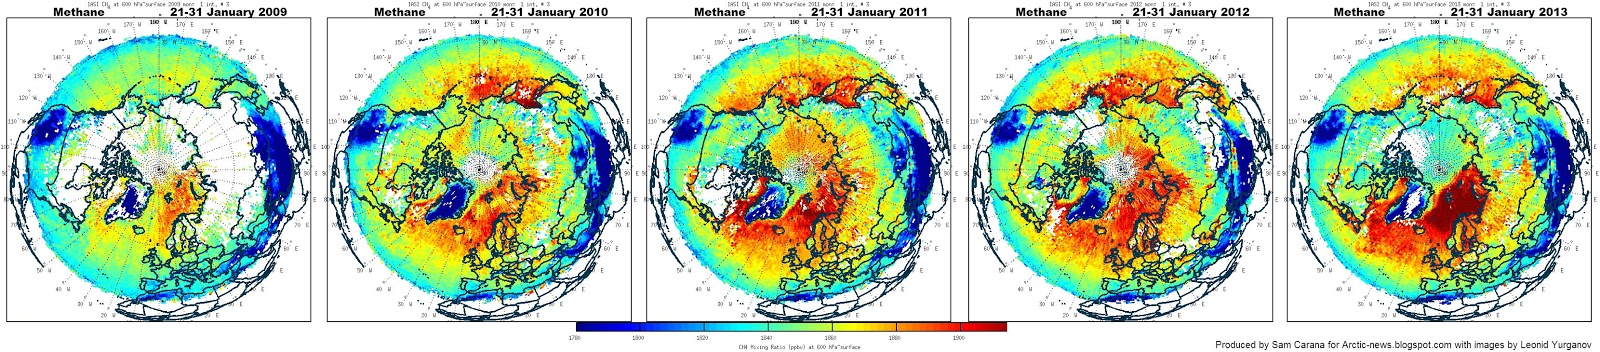
Dr. Leonid Yurgonov uses the AIRS/AQUA satellite sensor to provide a record of Arctic methane overburden. One that is clearly visible here:
In the above image we see methane measurements at the 18,000 foot altitude above the Arctic and upper latitudes. The progression is from January of 2009 (furthest left) to January of 2013 (furthest right). Orange coloration represents methane readings in the range of 1,850 to 1,950 parts per billion. Deep red coloration is in the range of 2,000 parts per billion. Note the shift from blues and yellows (1,700-1,800 ppb) to oranges and reds (1,850-2,000 ppb) during the 5 years from 2009 to 2013.
So not only does the AIRS sensor show overburden, but it also finds methane build-up over the period measured.
These combined measures alone provide more than enough evidence of a methane overburden in the far northern region, together with a rate of buildup that maintains the overburden and leads the global methane measure. Cause for enough concern among Arctic researchers that they have tended to make statements like this:
The amount of methane in the Arctic hydrates alone is estimated as 400 times more than the global atmospheric CH4 burden! The question is timescale of the methane liberation: gradual, abrupt, or something in between. Satellite monitoring of methane over the Arctic Ocean is necessary! — Dr. Leonid Yurganov, AGU, 2012
Steady Increase So Far
But even if we do have both a buildup of methane in the polar region together with what looks like an ominous overburden, we should be quick to point out that the rate of increase, especially on the global scale, has been mostly steady so far.
Under any catastrophic methane release scenario, we would expect Arctic methane to rapidly jump higher, dragging the global measure along with it. In general, we’d expect almost all sensors to pick up the signal of an exponentially ramping curve. And we don’t see that as yet.
To this point, Dr. Yurganov’s statement from the 2012 AGU presentation is informative:
Current methane growth in the Arctic, including 2012, is gradual… If a sudden venting (bubbling) of methane would happen due to intense hydrates destruction, IASI would be able to detect it NRT.
Though there has been a bit of an uptick in global and Arctic methane increase rates during recent years, they have maintained about a 4-7 ppb annual increase since ending a decade-long pause from 1995 to 2005.
It is worth noting, however, that the global methane measure increasing at an exponential rate would be a trailing measure indicator — occurring only in the wake of any catastrophic or large-scale release. So, as a predictor, the global methane measure isn’t very useful.
Thermokarst Lakes
Which brings us to the key question — what are the leading indicators of major methane releases or of catastrophic releases of the kind some have feared?
Since we have never directly observed one, and since large-scale or catastrophic releases are merely theoretical at this time, we can only point toward evidence of past large scale releases, and an ongoing, but apparently growing, smaller scale release happening now.
The first such related observation may well have come in the form of an increasing methane emission from thermokarst lakes. Thermokarst lakes form when sections of permafrost thaw and collapse, creating a depression. In wet regions, water soon pools within these hollows. Organic material at the bottom of the pool is provided by thawing permafrost. In the anaerobic lake bottom environment, methane is generated as the organic material is broken down.
Over recent years, this increasingly widespread thermokarst thaw and formation has resulted in a number of Arctic ‘fire lakes’ popping up — lakes whose methane emissions are so great that bubble concentrations are high enough to burn. During winter, these bubbles are trapped beneath ice and when released, create an explosive mixture.
Methane production in a thermokarst lake. Image source: The Royal Society.
From the 1970s through the mid 2000s, it is estimated that some regions of the Arctic experienced as much as a 58% increase in methane release due to thermokarst lake formation alone. An important measure since a number of studies found that thermokarst lake formation was one of the primary drivers of methane release from the Arctic at the end of the last ice age.
But as a catastrophic release driver, thermokarst lake formation is relatively mild, even if it is capable of pushing Arctic methane release levels higher. As such, the next indicator — a discovery of large methane releases from the ocean floor in the Arctic — was somewhat more concerning.
Oceanic Plumes
For as of 2011 an expedition to the East Siberian Arctic Shelf (ESAS) found massive plumes of methane, as large as one kilometer across, emitting from the shallow sea bed region off northeastern Siberia. The researchers, Shakhova and Semiletov, seemed very concerned that this might be a sign of a potential, impending, large-scale release on the order of 1 to possibly 50 gigatons. The methane stores for the ESAS alone were massive — in the range of hundreds of gigatons. So even a fractionally small release from this source could be devastating. For reference, a 1-gigaton release would more than double the annual methane release from all global human and natural sources. A 5-gigaton release, on its own, would be enough to more than double atmospheric methane concentrations. And since methane traps heat more than 20 times as efficiently as CO2 over a century time-scale, such a release would result in far more rapid warming than previously predicted by scientific bodies such as the IPCC -- a very rapid rate of warming that would be extraordinarily difficult for human civilizations to adapt to.
Of course this announcement set off amazing controversy. We couldn’t be certain what the source of this methane was, some said. Was it submerged permafrost methane? Was it hydrate? Was it free gas methane? And how could we be certain that this release hasn’t been ongoing for some time?
If such a methane release was building up to a catastrophic event, what mechanism would be the cause? In other words, how might gigatons of methane suddenly blow up from the sea bed?
Lower troposphere methane concentrations over the Kara, Laptev, and East Siberian Seas during September-November of 2009-2012 show overburden in active oceanic release zones. Image source: Dr. Leonid Yurganov.
This point is worth a bit of further exploration. The issue is that the most unstable form of methane when warmed is the methane hydrate store mentioned above. Methane hydrate is a frozen combination of gas methane and water. It crystallizes into a kind of fire ice under high pressure and in low temperature environments. It typically forms about 200-600 feet below the sea bed as methane bubbling up from warmer regions below contacts seawater, high pressure and cold. If the layer is warmed under human heat forcing, the hydrate thaws, releasing its gas. The gas now becomes stored in pockets under high pressure. The gas below pushes against the sea bed above and some of it bubbles out (and these releases are found in the large plumes along the ESAS and elsewhere). But most of it, so far, has remained entombed.
What, then, could cause the large stores of entombed gas releasing from destabilizing hydrate, to break through hundreds of feet of seabed — hitting first ocean water and then atmosphere?
Over the past four years conjecture over this issue has raged on. Swelling at points when Shakhova and Semiletov would make a new announcement and then ebbing as a wave of reassurances would rush in from scientific critics and mainstream media.
By summer of 2014, a discovery of new, large-scale plumes in the Laptev Sea by the SWERUS C3 expedition set off another wave of media speculation and controversy. But as the dust settled, it became clear that the Laptev sea floor had been added to the list of methane hot spots in the Arctic, following in the footsteps of the ESAS region as an area to watch for potential increasing rates of release.
Tundra Blowholes
In nature, gasses under high and increasing pressure often find pathways for escape. Typically, the escape is gradual — we see this in volcanic regions in the release of magma gasses through cracks in the earth and through vent pathways. And sometimes the escape is far more violent — with hot volcanic gasses blowing away even hills or mountainsides in spontaneous eruption, or bubbling out, en masse, through volcanic lakes to spill toxic plumes over a countryside.
The gas source in question for Arctic methane release — hydrate — is very large. Even at the low end, it is estimated that hundreds of gigatons of the stuff lie buried beneath frozen tundra ground or in ocean stores beneath the seabed. A gigaton is one billion tons. A billion tons of frozen hydrate would cover roughly one cubic kilometer. One cubic kilometer of a flammable gas under high pressure.
And in the Arctic, hundreds of billions of tons lie under rapidly warming permafrost both on land and in the submerged seabed.
Graphic of permafrost and gas hydrate methane by Carolyn Ruppel. Note that 75% of the ESAS sea floor is in the range of 50 meters in depth or shallower and that buried hydrate deposits can be found in the range of 200-300 feet. Image source: Methane Hydrates and Contemporary Climate Change.
As of 2011, some scientists were warning that we were seeing a slow release from some of this submerged hydrate store in the ESAS. By 2014, the potential slow release had expanded into the Laptev Sea.
But that year, 2014, also saw something else. A potential catastrophic release of methane. For in the frozen region of Yamal, Russia, the earth near a remote Siberian village began to destabilize. Soon after, according to eyewitness accounts, the area began to smoke. Then, with a bright flash, the ground erupted.
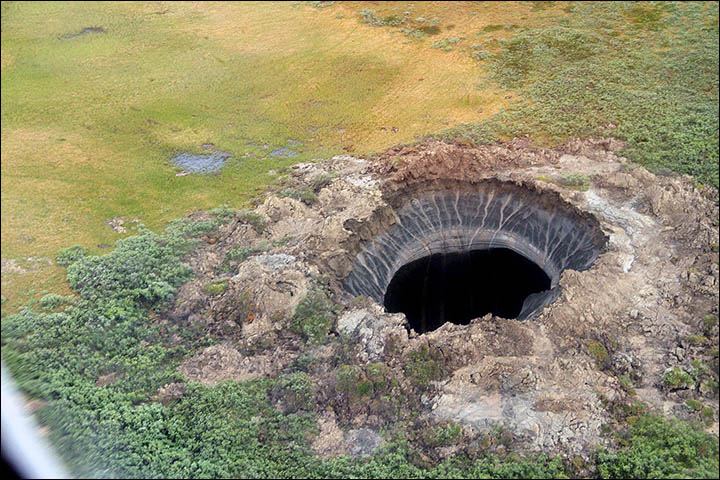
When the smoke cleared, a massive crater was found where only flat, frozen tundra had been before. A giant plug of frozen earth had been ejected violently. And all that remained was an ominous gray-black crater.
Yamal Crater as seen from the air. Image source: The Siberian Times.
Researchers investigating the crater found 10% atmospheric methane concentrations at its bottom.
Overall, it was estimated that about 11 tons of TNT equivalent explosive force was enough to remove this 100+ foot wide and 220 foot deep plug from the Earth. Exploding and burning methane in the range of about 10 tons would have been enough to generate the crater. Gas under high pressure in the hundred+ ton range may have been able to explosively excavate this hole.
As a result, the amount of methane in question for this single event was relatively small, especially when one considers the hundreds of billions of tons in the still frozen store.
It appeared that the rapidly warming Yamal territory and a broad region of nearby northwestern Siberia may be seeing tundra warming extending deep enough to begin to destabilize pockets of relic hydrate. The hydrate in some of these pockets is beginning to thaw and catastrophically erupt to the surface.
By early 2015, a total of seven primary craters and scores of secondary craters of this kind had been discovered throughout this section of Siberia. Local Russian authorities were very concerned — moving seismographs into the area to monitor ground stability in a region that includes one of their largest natural gas developments.
A large upheaval of this kind in the wrong place would easily rupture a pipeline or destroy sections of a gas production operation. But the deeper irony was that continued gas production in this region was contributing to a problem that may well be making the ground far, far less stable and setting up the risk for even larger-scale eruptions.
For the Yamal crater wasn’t important due to the relative size of its methane release — the release was very small in the global context. A mere drop in an ocean of greenhouse gasses being emitted now by humans. It was important due to two other, and perhaps more stark, reasons.
The first was the very violent nature of its release — an eruption similar to that of a volcano — representing a severe geophysical upheaval that was all too likely triggered by a rapid human warming of the tundra. This kind of release, as the Russians in the region were quick to realize, represented a danger to both inhabitants and to infrastructure.
But the second reason is, perhaps, more important. It is the fact that the Yamal crater may well be evidence of the kind of mechanism for catastrophic methane release some of the more conservative scientists have been demanding. It’s possible, then, that the Yamal crater is in microcosm, what a truly catastrophic methane release might look like on a much larger scale. And the critical question to ask here is — could there be a connection between the methane blowholes we are now observing in the Arctic and a number of mysterious and gigantic craters discovered on the sea bed around the world?
Giant Craters on the Seabed
In 2013, marine geophysicist Dr. Bryan Davy from GNS Science found what may be the world’s largest gas eruption craters on the seafloor, about 310 miles east of Christchurch, New Zealand.
The craters, which the researchers called ‘pockmarks,’ formed in an active gas zone along the ocean bottom. They measured from 250 meters to 7 miles in diameter and about 300 feet deep, with the largest crater able to encompass all of lower Manhattan.
Giant craters off Christchurch, New Zealand, are thought to have formed due to large gas eruptions during previous episodes of sea bed warming. Could human warming be setting off something similar for the Arctic? Image source: Mysterious Giant Crater Like Structure Found Near New Zealand.
The craters are thought to have formed during ice ages when sea levels lowered off New Zealand causing the sea bed to warm and gas hydrate to thaw. Eventually, the gas is thought to have erupted into the surrounding water with a portion bubbling up into the atmosphere.
GEOMAR seismic records indicated active gas pockets beneath the crater zones. Dr. Joerg Bialas, a GEOMAR scientist, noted:
Gas release from the larger pockmarks may have been sudden and possibly even violent, with a massive volume being expelled into the ocean and atmosphere within hours or days.
The 300 foot depth of the craters touched the hydrate stability zone, even as their large size indicated that massive pockets of the gas lifted away large sections of sea bed suddenly and violently. It’s the kind of rapid destabilized gas release that may well represent a worst-case Arctic warming scenario.
Cause for Appropriate Concern
So the question must be asked — is the Yamal crater physical validation of a catastrophic methane hydrate release mechanism that has circulated, as theory, through the geophysical sciences for decades? One that involves large eruptions that displace massive sections of earth and seabed during a violent release process. Are the Siberian methane blowholes smaller examples of what can happen on a much greater scale? And does the methane overburden in the Arctic, the documented increasing thermokarst lake release, the sea bed methane release in the Laptev and ESAS, and the new formation of methane blow holes in Yamal, in the context of a rapidly warming Arctic tundra and sea bed (seeing unprecedented rates of warming), represent a growing risk for this kind of release?
Under even a ‘moderate’ 1 to 3.5 gigaton Arctic carbon release rate by end century given by the survey of 100 Arctic scientists, there will likely be more than enough potential freed methane to include large-scale catastrophic releases similar to the kind seen off New Zealand and elsewhere (250-meter to 7-mile-wide cratering events).
In this context, the issue is not one of ‘apocalypse now’ or ‘apocalypse not.’ That framing is all wrong. This issue is one of how much or how little geophysical upheaval and related methane release we will see — and how soon. One of how rapidly humans can stop making the situation even worse, by drawing down their own catastrophic emission rates as rapidly as possible.
There is, therefore, more than enough cause for appropriate concern and continued monitoring of what appears to be an ongoing destabilization of Arctic carbon stores — large enough to represent a variety of hazards both terrestrial and atmospheric.
Links:
Scientific hat tips to Dr. Leonid Yurganov, Dr. Gavin Schmidt, Dr. David Archer, Dr. Igor Semiletov, Dr. Natalia Shakhova, Dr. Carolyn Ruppel, Dr. Jason Box, Dr. Peter Wadhams, Dr. Bryan Davy, Dr. Joerg Bialas, SWERUS C3, GEOMAR, and The Russian Center of Arctic Exploration.
Subscribe to:
Posts (Atom)