Blog Archive

Saturday, August 22, 2009

J. L. Lean & D. H. Rind, GRL, 36 (2009): How will Earth's surface temperature change in future decades?

Geophysical Research Letters, 36 (2009) L15708; doi: 10.1029/2009GL038932

How will Earth's surface temperature change in future decades?

Judith L. Lean (Space Science Division, Naval Research Laboratory, Washington, DC, U.S.A.) and David H. Rind (NASA Goddard Institute for Space Studies, New York, NY, U.S.A.)

Abstract

Reliable forecasts of climate change in the immediate future are difficult, especially on regional scales, where natural climate variations may amplify or mitigate anthropogenic warming in ways that numerical models capture poorly. By decomposing recent observed surface temperatures into components associated with ENSO, volcanic and solar activity, and anthropogenic influences, we anticipate global and regional changes in the next two decades. From 2009 to 2014, projected rises in anthropogenic influences and solar irradiance will increase global surface temperature 0.15 ± 0.03 °C, at a rate 50% greater than predicted by IPCC. But as a result of declining solar activity in the subsequent five years, average temperature in 2019 is only 0.03 ± 0.01° C warmer than in 2014. This lack of overall warming is analogous to the period from 2002 to 2008 when decreasing solar irradiance also countered much of the anthropogenic warming. We further illustrate how a major volcanic eruption and a super ENSO would modify our global and regional temperature projections.

(Received 29 April 2009, accepted 9 July 2009, published 15 August 2009.)

Lean, J. L., & D. H. Rind (2009), How will Earth's surface temperature change in future decades?, Geophysical Research Letters, 36, L15708; doi: 10.1029/2009GL038932.

Link to abstract: http://www.agu.org/pubs/crossref/2009/2009GL038932.shtml

Friday, August 21, 2009

Highest ever winter water temperatures recorded off Tasmania

Highest ever winter water temperatures recorded off Tasmania

ScienceDaily, August 20, 2009 — Tasmania’s east coast is recording its highest-ever winter water temperatures of more than 13 ºC – up to 1.5 ºC above normal – due to a strengthening of an ocean current originating north of Australia.

Satellites have given oceanographers an insight into a remarkable phenomenon – a significant extension of the Leeuwin Current curling around the southern tip of Tasmania and reaching as far north as St Helens.

Remote sensing specialists at CSIRO's Wealth from Oceans Flagship have been observing the current in recent days using satellite data, and ocean measurements made near Maria Island on Tasmania’s east coast.

CSIRO oceanographers Katy Hill, David Griffin and George Cresswell study ocean behaviour in the Australian region. Dr Cresswell says that scientists use ocean observations from satellite, ocean instruments and research vessels – such as the Marine National Facility, RV Southern Surveyor – to track the currents but there are also other indicators such as tropical species reaching Tasmania.

“It’s important for us to monitor these changes in the ocean, as they can have consequences for marine ecosystems, fisheries, aquaculture, coastal communities and more,” Dr Cresswell says.

The Leeuwin Current forms north of Australia and flows right around the western half of the country, meeting its better known cousin, the East Australian Current (EAC), at Tasmania. The exact location of this meeting point varies both seasonally and from year-to-year, depending on how strongly each current is flowing.

Oceanographers believe the EAC has gradually been getting stronger, and the Leeuwin Current weaker. Changes in the EAC are among the most significant in the global ocean, with a continuous record of monthly measurements one of Australian oceanography’s most valuable indicators for climate and environmental monitoring.

Observations of temperature, salinity and nutrients have been collected monthly just east of Maria Island since 1944, showing how the influence of both the EAC and Leeuwin Current systems varies in Tasmanian waters. As part of the Integrated Marine Observing System (IMOS), a National Reference Station mooring has been deployed at the same site, and data is now available online every 10 minutes. Monthly samples are taken by boat to measure nutrients, phytoplankton, and zooplankton (biomass and species composition).

Satellite images indicate the surface water temperature over the continental shelf current is around 13 degrees, a degree or two warmer than at this time in recent years. The EAC has been a research focus for Katy Hill since 2005 as part of her PhD in the Quantitative Marine Science program – a joint initiative of CSIRO and the University of Tasmania.

The St Helens-based Chief Executive of the Tasmanian Rock Lobster Association, Rodney Treloggen, said he was not aware of any reports of Indian Ocean species but he said fishers were concerned at what he described as a “bad year” for the industry in the south-east and east coast.

"We know the warmer waters have an impact, but we're not sure how much," Mr Treloggen said.

Adapted from materials provided by CSIRO Australia.

Complete video of Dr. Richard Alley's talk on climate change at Penn State

Penn State, August 19, 2009

Complete video of Dr. Richard Alley's talk on climate change at Penn State

Dr. Richard Alley -- leading expert on climate change shares his findings


University Park, Pa. (August 7, 2009) – Experts say regulating earth's climate is arguably one of the most important issues of modern day. However, the key to understanding the future of our environment is to examine the past. Researchers are learning important lessons about earth’s climate history from an unlikely source: ice cores. Penn State professor Richard Alley is one of the world's leading climate researchers and he'll explain his theories about changing temperatures on the next "Conversations from Penn State."

Dr. Alley uses ice cores to understand climate change and study how it has progressed over time.

"If we continue 'business as usual,' burning lots of fossil fuel, when you look ahead two, three, or four generations, we will have made life harder for a whole lot of people because of changes in the climate," said Alley. "We will have made life harder for a whole lot of ecosystems because of that."

See YouTube video:

P.A. O'Gorman & T. Schneider, PNAS, 2009: The physical basis for increases in precipitation extremes in simulations of 21st-century climate change

Proceedings of the National Academy of Sciences,

The physical basis for increases in precipitation extremes in simulations of 21st-century climate change

Paul A. O'Gorman* (Massachusetts Institute of Technology, Cambridge, MA 02139, U.S.A.) and Tapio Schneider (California Institute of Technology, Pasadena, CA 91125, U.S.A.)

Communicated by Kerry A. Emanuel, Massachusetts Institute of Technology, Cambridge, MA; July 14, 2009 (received for review March 24, 2009).

Abstract

Global warming is expected to lead to a large increase in atmospheric water vapor content and to changes in the hydrological cycle, which include an intensification of precipitation extremes. The intensity of precipitation extremes is widely held to increase proportionately to the increase in atmospheric water vapor content. Here, we show that this is not the case in 21st-century climate change scenarios simulated with climate models. In the tropics, precipitation extremes are not simulated reliably and do not change consistently among climate models; in the extratropics, they consistently increase more slowly than atmospheric water vapor content. We give a physical basis for how precipitation extremes change with climate and show that their changes depend on changes in the moist-adiabatic temperature lapse rate, in the upward velocity, and in the temperature when precipitation extremes occur. For the tropics, the theory suggests that improving the simulation of upward velocities in climate models is essential for improving predictions of precipitation extremes; for the extratropics, agreement with theory and the consistency among climate models increase confidence in the robustness of predictions of precipitation extremes under climate change.

*Correspondence e-mail: pog@mit.edu

Link to abstract: http://www.pnas.org/content/early/2009/08/19/0907610106.abstract

Thursday, August 20, 2009

Seth Borenstein, Assoc. Press: World's Oceans Set Temperature Record

World's Oceans Set Temperature Record

by Seth Borenstein, Associated Press, August 20, 2009

Record Highs
Record Highs | Discovery News Video

Aug. 20, 2009 -- July marked the hottest the world's oceans have been in almost 130 years of record-keeping. Meteorologists said a combination of forces are at work: A natural El Nino

system on top of worsening man-made global warming and a dash of random weather variations.

The resulting ocean heat is already harming threatened coral reefs. It could also hasten the melting of Arctic sea ice and help hurricanes strengthen.

The average water temperature worldwide in July was 62.6 degrees, according to the National Climatic Data Center, the branch of the U.S. government that keeps world weather records.

June was only slightly cooler, while August could set another record, scientists said.

The previous record was set in July 1998 during a powerful El Nino weather pattern.

Related Content:

The Gulf of Mexico, where warm water fuels hurricanes, has temperatures dancing around 90. Most of the water in the Northern Hemisphere has been considerably warmer than normal. The Mediterranean is about three degrees warmer than normal. Higher temperatures rule in the Pacific and Indian Oceans.

The heat is most noticeable near the Arctic, where water temperatures are as much as 10 degrees above average. The tongues of warm water could help melt sea ice from below and even cause thawing of ice sheets on Greenland, said Waleed Abdalati, director of the Earth Science and Observation Center at the University of Colorado.

Breaking heat records in water is more ominous as a sign of global warming than breaking temperature marks on land, because water takes longer to heat up and does not cool off as easily as land.

"This warm water we're seeing doesn't just disappear next year; it'll be around for a long time," said climate scientist Andrew Weaver of the University of Victoria in British Columbia. It takes five times more energy to warm water than land.

The warmer water "affects weather on the land," Weaver said. "This is another yet really important indicator of the change that's occurring."

Georgia Institute of Technology atmospheric science professor Judith Curry said water is warming in more places than usual, something that has not been seen in more than 50 years.

Add to that an unusual weather pattern this summer where the warmest temperatures seem to be just over oceans, while slightly cooler air is concentrated over land, said Deke Arndt, head of climate monitoring at the climate data center.

The pattern is so unusual that he suggested meteorologists may want to study that pattern to see what's behind it.

The effects of that warm water are already being seen in coral reefs, said C. Mark Eakin, coordinator of the National Oceanic and Atmospheric Administration's coral reef watch. Long-term excessive heat bleaches colorful coral reefs white and sometimes kills them.

Bleaching has started to crop up in the Florida Keys, Puerto Rico and the Virgin Islands -- much earlier than usual. Typically, bleaching occurs after weeks or months of prolonged high water temperatures. That usually means September or October in the Caribbean, said Eakin. He found bleaching in Guam, Wednesday. It's too early to know if the coral will recover or die. Experts are "bracing for another bad year," he said.

The problems caused by the El Nino pattern are likely to get worse, the scientists said.

An El Nino occurs when part of the central Pacific warms up, which in turn changes weather patterns worldwide for many months. El Nino and its cooling flip side, La Nina, happen every few years.

During an El Nino, temperatures on water and land tend to rise in many places, leading to an increase in the overall global average temperature. An El Nino has other effects, too, including dampening Atlantic hurricane formation and increasing rainfall and mudslides in Southern California.

Warm water is a required fuel for hurricanes. What's happening in the oceans "will add extra juice to the hurricanes," Curry said.

Hurricane activity has been quiet for much of the summer, but that may change soon, she said. Hurricane Bill quickly became a major storm and the National Hurricane Center warned that warm waters are along the path of the hurricane for the next few days.

Hurricanes need specific air conditions, so warmer water alone does not necessarily mean more or bigger storms, said James Franklin, chief hurricane specialist at the National Hurricane Center in Miami.

Link: http://dsc.discovery.com/news/2009/08/20/ocean-temperature.html

Joseph Romm: YouTube, Sinclair prove Anthony Watts knows as much about copyright laws as about climate science

YouTube, Sinclair prove Anthony Watts knows as much about copyright laws as about climate science

by Joseph Romm, Climate Progress blog, August 19, 2009

When we last left our favorite former TV weatherman, he was offering the ‘inanity defense’ for his effort to censor Peter Sinclair’s Climate Denial “Crock of the Week” video.

The man behind the top anti-scientific website WattsUpWithThat regularly defames top climate scientists and pushes the most seemingly detailed but ultimately nonsensical analyses (see here) — yet he could not even be bothered to spend one minute googling “copyright laws” or “fair use.” The result: Not only did he publish the most embarrassing, torturous and self-revealing defense of censorship ever seen on the blogosphere but, YouTube has now (inevitably) sided with Sinclair and reposted the original video:

Sinclair explained to me the process for reinstatement on YouTube — and thanked Watts for the publicity boom — in an email:

In July, as part of my “Climate Denial Crock of the Week” video series, (http://www.youtube.com/user/greenman3610) I published a piece that criticized and parodied the work of well known climate denier Anthony Watts, and his “SurfaceStations.org” project.

On July 26, Watts made what I regard as an improper “DMCA” claim against the video, and had it removed from YouTube.

The DMCA, (Digital Millenium Copyright Act), was originally intended to protect copyright owners from internet abuse, but has been occasionally used improperly, notoriously by authoritarian religious groups and cults, in order to restrain criticism and free speech on the internet.

After some investigation of related cases and obtaining additional opinions as to relevant copyright law, I confirmed my original belief that my videos in no way violate copyright law, especially in light of the principles of critical review, parody, and transformational use of material.

In accordance with established YouTube guidelines, I filed a “counternotice”, affirming that, “under penalty of perjury, that I have a good faith belief that the material was removed or disabled as a result of a mistake or misidentification of the material to be removed or disabled.”

As of today, I have received the following confirmation from YouTube:

“In accordance with the Digital Millennium Copyright Act, we’ve completed processing your counter-notification regarding your video:

http://www.youtube.com/watch?v=dcxVwEfq4bM

This content has been restored and your account will not be penalized.”

I wish to extend my sincerest gratitude to YouTube, to all those who advised and supported me in this effort, and most especially, to Anthony Watts and SurfaceStations.org, for providing invaluable exposure to my video series, and greatly increasing my traffic and visibility.

WattsUpWithThat who regularly defames top

Sediment and nutrient delivery from thermokarst features in the foothills of the North Slope, Alaska: Potential impacts on headwater stream ecosystems

Journal of Geophysical Research -- Biological Sciences, 113 (2008) G02026; doi: 10.1029/2007JG000470.

Sediment and nutrient delivery from thermokarst features in the foothills of the North Slope, Alaska: Potential impacts on headwater stream ecosystems

W. B. Bowden (The Rubenstein School of Environment and Natural Resources, University of Vermont, Burlington, VT, U.S.A.), M. N. Gooseff (Department of Geology and Geological Engineering, Colorado School of Mines, Golden, CO, U.S.A.), A. Balser (Institute of Arctic Biology, University of Alaska, Fairbanks, AK, U.S.A.), A. Green (The Ecosystem Center, Marine Biological Laboratory, Woods Hole, MA, U.S.A.), B. J. Peterson (The Ecosystem Center, Marine Biological Laboratory, Woods Hole, MA, U.S.A.), and J. Bradford (Center for Geophysical Investigation of the Shallow Subsurface, Boise State University, Boise, ID, U.S.A.)

Abstract

Permafrost is a defining characteristic of the Arctic environment. However, climate warming is thawing permafrost in many areas leading to failures in soil structure called thermokarst. An extensive survey of a 600 km2 area in and around the Toolik Lake Natural Research Area (TLNRA) revealed at least 34 thermokarst features, two thirds of which were new since ∼1980 when a high resolution aerial survey of the area was done. Most of these thermokarst features were associated with headwater streams or lakes. We have measured significantly increased sediment and nutrient loading from thermokarst features to streams in two well-studied locations near the TLNRA. One small thermokarst gully that formed in 2003 on the Toolik River in a 0.9 km2 subcatchment delivered more sediment to the river than is normally delivered in 18 years from 132 km2 in the adjacent upper Kuparuk River basin (a long-term monitoring reference site). Ammonium, nitrate, and phosphate concentrations downstream from a thermokarst feature on Imnavait Creek increased significantly compared to upstream reference concentrations and the increased concentrations persisted over the period of sampling (1999–2005). The downstream concentrations were similar to those we have used in a long-term experimental manipulation of the Kuparuk River and that have significantly altered the structure and function of that river. A subsampling of other thermokarst features from the extensive regional survey showed that concentrations of ammonium, nitrate, and phosphate were always higher downstream of the thermokarst features. Our previous research has shown that even minor increases in nutrient loading stimulate primary and secondary production. However, increased sediment loading could interfere with benthic communities and change the responses to increased nutrient delivery. Although the terrestrial area impacted by thermokarsts is limited, the aquatic habitat altered by these failures can be extensive. If warming in the Arctic foothills accelerates thermokarst formation, there may be substantial and wide-spread impacts on arctic stream ecosystems that are currently poorly understood.

(Received 19 April 2007, accepted 28 January 2008, published 3 June 2008.)

Bowden, W. B., M. N. Gooseff, A. Balser, A. Green, B. J. Peterson, & J. Bradford (2008), Sediment and nutrient delivery from thermokarst features in the foothills of the North Slope, Alaska: Potential impacts on headwater stream ecosystems, J. Geophys. Res., 113, G02026; doi: 10.1029/2007JG000470.

Link to abstract: http://www.agu.org/pubs/crossref/2008/2007JG000470.shtml

Thermokarst forming in Arctic tundra changing albedo, emitting methane

Trouble in the Tundra

by Lisa Jarvis, C&EN (Chemical and Engineering News), August 17, 2009

There is a profound quietude north of Alaska’s Brooks Range, the string of mountains separating the boreal forest from the Arctic tundra. Traveling along the Dalton Highway, the one road to the Arctic Ocean, one sees little visible movement in the landscape aside from the trucks barreling up to the oil fields, an occasional camper, or subtle signs of wildlife. Every angle, every turn offers stillness and beauty; it is like driving straight into a postcard.

Yet the tranquility belies the dramatic change under way. The climate in the Arctic is warming more rapidly than nearly anywhere else. Sea ice is disappearing faster than models had predicted—everyone has seen the images of a polar bear stranded on a shrinking ice floe—and the frozen soil is warming as far as 65 feet below Earth’s surface, points out Syndonia Bret-Harte, a plant community and ecosystem ecologist at the University of Alaska’s Institute of Arctic Biology.

No one is more keenly aware of how quickly the environment is changing than the scientists at Toolik Field Station, the National Science Foundation’s Arctic long-term ecological research site, where Bret-Harte is the associate scientific director. Since the camp was established in the 1970s, researchers have returned summer after summer to conduct long-term studies of the plants, lakes, rivers, and wildlife. They see firsthand that in the carefully balanced environment of Alaska’s North Slope, small changes can have major consequences.

Now, a large group of scientists are collaborating to understand how the consequences of a warmer Arctic could impact its landscape and feed back into global warming. With a grant from NSF, they are studying the mechanics of thermokarsts, or features created when permafrost, or soil that has been frozen for years, melts, then collapses like a soufflé. Each scientist brings a different kind of expertise that can help create a complete picture of how a thermokarst changes the surrounding environment.

“The Arctic is a place where everything is about the minutest change in energy balance,” says William (Breck) Bowden, an aquatic ecologist at the University of Vermont, who has been coming to Toolik for more than 20 years.

Just how delicate is that balance? Consider a set of tire tracks visible in the tundra near a pump station off the Dalton Highway on Alaska’s North Slope. The tracks look freshly made, but are actually a relic from the 1940s, when a single vehicle passed over the surface of the tundra. All it takes is the weight and friction of the truck to expose the soil, making a small change to the albedo, or the amount of light being reflected away from the ground’s surface, and the area begins to melt. “And as it continues to melt, a new community of vegetation starts to grow there, and now we have a scar,” Bowden says.

Imagine, now, the impact of an all-out failure in the Arctic permafrost, which has been rock solid for hundreds, even thousands of years. If you were to cut deep into the ground, you’d find the permafrost looks a lot like brown concrete; fittingly, it serves as the structural foundation for the far north. But it only takes a small change—a little water winding its way down into the ground, warming the soil or melting ice buried deep within, for example—and that foundation gives way and a thermokarst forms.

The failure can happen in various ways: a slump on a hillside, a gulley, detachment of a top layer of tundra, or a ground collapse when glacial ice melts. After the initial breakdown, the feature continues to evolve for a period until it starts to stabilize and eventually heals over.

Scientists are suddenly more interested in thermokarsts because, well, there simply seem to be more of them. From photographs taken from a low-altitude flyover of the entire state in the early 1980s and data gathered in 2006, scientists believe the number of thermokarsts in the Alaskan landscape has doubled in that time. “This is a natural phenomena, but it appears to be accelerated by warming in the Arctic,” Bowden notes.

The thawing of soil that has been frozen for so many years and is chock-full of organic material has an immediate impact on the local environment. Nutrient-carrying sediment can be dumped into nearby lakes or streams, changing the water chemistry and stream dynamics; microbes and vegetation have access to more food, meaning different plants can thrive in the nutrient-rich soil; the albedo in that area changes, potentially allowing more permafrost to melt. And from a climate-change perspective, carbon that was locked away in the ice for hundreds or thousands of years could be rapidly released.

With $5 million in funding from NSF’s Arctic System Science Program, a group of roughly 25 scientists at Toolik, led by Bowden, have embarked on an expansive study of the short- and long-term impact thermokarsts could have on the Arctic landscape. By pooling their collective expertise, they want to understand how long it takes for ice to melt, how dramatic the changes to the local environment could be, and how long those changes might persist once the landscape begins to heal.

The project, which currently has four years of funding, was officially launched this summer. This year, the group is focusing its research on three thermokarsts that are readily accessible to the field station. A rather sizable number of the principal investigators (PIs)—there are 17—and graduate and postdoctoral students involved in the project had their first group meeting at Toolik this summer to pound out the details of what should be studied.

From a coordination perspective, it’s a bear of an undertaking. Although PIs usually spend a few weeks at Toolik at the start of the summer, their students are responsible for keeping up the daily grind of sample collection. And data are generally analyzed long after everyone has returned to civilization.

But there is one major factor working in the scientists’ favor: the Toolik culture. The station sits on a pristine lake about 350 miles north of Fairbanks—in other words, smack in the middle of nowhere. When camp is full, there are about 120 researchers and support staff on site, and with the nearest bar or shopping mall an eight-hour drive away, it’s hard not to get to know most everyone. During the hour when dinner is served, anyone not out in the field can be found in the camp’s one dining hall; inevitably, over an Alaskan beer and a hot meal, the conversation turns to the day’s work.

It’s no surprise, then, that an accidental discovery of a thermokarst several years ago by two Toolik scientists would eventually spark the interest of a number of researchers at the camp.

As with many scientific discoveries, the thermokarst project was a product of serendipity. In July 2003, Bowden and Michael N. Gooseff, an environmental engineer at Pennsylvania State University, were in a helicopter, scanning the landscape for potential research sites for a project to study thawed zones along the edges of rivers. Flying down the Kuparuk, a river just west of the field station that snakes its way from the North Slope up to the Arctic Ocean, the researchers noted that the water was as beautiful and blue as ever. They decided to head over the next ridge to check out the Toolik River. But instead of a clear blue stream, they were greeted by muddy, brown, all-around nasty-looking water.

The idea of a chocolate-brown river might not seem odd to someone living in the lower 48, where water is constantly moving and rain can easily wash sediment into it. But as Gooseff points out, when the ground is frozen solid, even heavy rain doesn’t disturb much.

After flying up about 25 miles, they came to a water track that was pouring tons of sediment into the Toolik River. As they followed the stream, they saw a large rip in the tundra: a freshly formed thermokarst. “We flew over it a couple of times and were just amazed by this gash,” Gooseff recalls.

The helicopter set down, and the pair saw that a huge gulley had formed. The hole in the ground was so deep that Bowden, who is at least 6’2”, was fully immersed as he stood on a small carpet of tundra that had surfed to the bottom. As the earth wrung itself out, so much water was released that a small waterfall had even formed.

The scientists believe the ground had collapsed somewhere from hours up to a few days before they stumbled upon it. Their discovery provided an amazing opportunity to study the feature in depth from its genesis.

The vast collaboration around thermokarsts that subsequently came together has several broad objectives. The researchers want to know how and why thermokarsts occur and to generate a predictive model that could help identify environments where a failure is more likely.

“It’s easy to say there was a failure of the ice, but it doesn’t mean we know the mechanics,” Gooseff says. For Alaskans, ground stability is critical when assessing both new and old infrastructure. “The Dalton Highway certainly has met some of those challenges in various ways—there wasn’t a specific landscape model of permafrost stability when they built that road back in the ’70s,” he adds.

Gooseff is part of that “how and why” team. Along with Antoni Lewkowicz, a permafrost expert and geography professor at the University of Ottawa, he will be responsible for coming up with the model of how thermokarsts form and how long one might persist in a given environment.

Gooseff is trying to figure out the dynamics of heating and cooling at different locations inside and out of the three thermokarsts near Toolik. On a basic level, this means keeping careful track of the temperature at various points along and down into the permafrost. By drilling a hole into the ground and inserting a simple polyvinyl chloride pipe with temperature sensors situated at various depths, then planting those pipes across the feature, he can develop a profile of how the ground temperature is changing.

Meteorological stations are set up to track the wind direction and speed, air temperature, relative humidity, and barometric pressure—all the variables the scientists will need to plug into their model.

The data will help scientists understand the relationship between fluxes of water and energy, as well as permafrost and landscape stability in the Arctic. For example, they want to know how water from a rainstorm moves into the subsurface at different locations inside and outside the thermokarst. “Is there something that has changed because you don’t have that organic mat anymore inside the thermokarst?” Gooseff asks.

Eventually, they will use those measurements to develop numerical models of heat and water transport in the subsurface and try to “virtually” force the landscape to fail.

Another goal of the project is to understand how the ecology will change as a result of this sudden rift in the tundra. For example, Bowden and Gooseff published a paper in the Journal of Geophysical Research last summer showing that the thermokarst dumped more sediment into the Toolik River than would have been delivered over the course of 18 years from the vast Kuparuk River basin (2008, 113, 2026). Now, they want to know how a river and the community living in it will be affected by a sudden influx of sediment.

Bowden is focused on streams, specifically studying how an influx of sediment and nutrients from a thermokarst can change the water-stream chemistry and, as a consequence, alter life in the stream.

On a basic level, it is clear that dumping a bunch of dirt into an Arctic stream smothers the benthic community, the things living at the bottom of the stream. It also makes it harder for fish to see and irritates their gills.

But carbon, nitrogen, and phosphorus—the food of life, so to speak—also adhere to the surfaces of the sediment. The thermokarst, by proxy, becomes “a mechanism for transporting nutrients through the system,” Bowden adds.

His group is trying to determine exactly how much of each element is being released into the water, and how far downstream its effect is seen. Bowden has placed automated samplers above and below where the sediment flows into the Toolik River. The machine collects water samples four times a day, then combines them into a 1-L bottle that gives a daily snapshot of the stream’s activity.

There are also nearby sensors for precipitation, light level, and the flow rate of the river, all necessary for figuring out how nutrients will behave in the river. Another instrument sits in the river and records temperature and electrical conductivity, and it uses an optical sensor to measure dissolved oxygen, which can be used to calculate the carbon balance of the stream.

Though it all sounds rather automated, retrieving data is no joke. By all accounts, life at the field station has gotten much cushier in recent years than it was in the early days of the camp. The food at the station is so good that people talk about gaining “the Toolik 10” during a summer stay. There are showers, albeit with strict rules about how often and for how long they can be used (two minutes, twice a week), and a large sauna that can be followed by a dip in the chilly lake to fill the cleanliness gaps.

Those comforts are a much-needed reward for long days in the field. Getting out to the Toolik thermokarst, for example, involves a short drive followed by a one-and-a-half-mile hike. Part of that walk is along a gravel path, but part is through the tundra: The verdant moss is like walking uphill on soft mattresses; the tough tussocks that dot the area are about the size of a baseball—and are about as easy to balance on. As Bowden likes to say: “Step on a tussock, break an ankle, step in-between, break an ankle.” Now, imagine making that hike while in waders, rain boots, and a mosquito net, and carrying more than 50 lbs. of samples and equipment.

Bowden’s students go out several times a week, rain or shine, to pick up samples. They are collecting so much water that it is easier for them to do some of the lab work right there in the field rather than carry it all back to camp. At the field station, they do some good old-fashioned chemistry to determine the concentration of each nutrient in the water.

Even before they determined the concentration of the elements being released into the stream over time, the team members already have a sense of what the environment could look like in the coming years. Scientists at Toolik had been conducting long-term studies of the effects of adding nutrients to the Kuparuk. By dripping ammonium, nitrate, and phosphate into the river, they showed algal biomass increased 10-fold, while fish grew faster and the insect population shifted.

The thermokarst team is also trying to understand how that influx of nutrients and warmer soil could affect plant life in the surrounding area. From looking at the scars of healing thermokarsts, it is clear that 20 or 30 years after a feature is formed, the landscape “is very much dominated by shrubs” rather than the usual tussocks, says Michelle Mack, a plant ecologist at the University of Florida.

A shrubbier environment may not sound like a big deal to those of us walking the tree-lined streets of the lower 48, but small changes matter in the Arctic. “Shrub tundra has different energy-exchange characteristics” compared with the tussock tundra that dominates the North Slope, Mack says. Shrubs reflect more radiation in the summer, trapping more heat in the atmosphere, but they also act as insulation for the tundra in the winter, keeping the soil warmer.

Shrub tundra also tends to store less carbon belowground than tussock, or nonacidic, tundra. “When you think of a shrubbier landscape, it’s one where more of the carbon is aboveground, where you don’t have these long-term accumulations of soil organic matter,” she adds. In other words, it suddenly becomes much harder to rebuild the permafrost that was lost when the feature formed.

As a result, more carbon dioxide is exhaled into the atmosphere. Gaius R. Shaver, a senior scientist at the Marine Biological Laboratory’s Ecosystems Center, has conducted a long-term experiment at Toolik, where plots of tundra are given extra nutrients and compared with undisturbed tundra. The hip-level shrubs in the plots with extra food are a stark contrast to the stubby tussock tundra in the area. Yet even though there is more plant material to breathe in carbon dioxide, he found the carbon uptake was more than offset by the loss of carbon and nitrogen from deep within the soil in that area. Shaver and several colleagues reported that the nutrient-rich system exhaled nearly 2 kg more carbon per sq meter over the course of 20 years than in the control plots (Nature 2004, 431, 440).

Mack is now studying the three core thermokarst sites near Toolik, as well as three other thermokarsts, to figure out how vegetation comes back after that disruption and whether the newly arrived shrubs will persist even after the ground has completely healed.

Within the sites, there are areas that have slumped just this year and others where the collapse happened 20 or 30 years ago. The variety allows her group to carefully survey which plants are growing in each area and compare variables like leaf concentration and area, soil pH and texture, and soil availability.

While understanding the changes a thermokarst can bring about on a local level is important, the project is also interested in the features’ impact beyond the Arctic environment. If climate change is leading to more thermokarsts, the scientists want to know whether those features could then feed back into further warming.

There is twice as much organic carbon stored in the soil and permafrost as there is in the atmosphere, says Ted Schuur, an ecosystem ecologist at the University of Florida whose broad studies of permafrost thaw thermokarsts in the steppe tundra of Siberia and Alaska led to an estimate of the carbon packed away across the Arctic (Science 2006, 312, 1612).

Understanding whether thermokarsts will lead to the release of that carbon is critical, particularly because it’s a feedback mechanism that has been ignored. The public tends to think about fossil fuel usage and tropical deforestation as the two main contributors to a changing carbon cycle. And in theory, people can control the amount of oil and gas they burn or how many acres of trees they cut down.

Yet permafrost contains layers upon layers of carbon that has been locked away for tens of thousands of years. “If you think about carbon coming out of the permafrost, it’s far from where people are, it’s created by a warming world, but once it is kind of going, it’s going with its own positive feedback, far from our influence,” Schuur says. “I think it really does represent this emissions source kind of out of our control. That’s different than what’s going on right now.”

As Bret-Harte, Toolik’s associate scientific director, puts it, “We can’t make a treaty to say, ‘Let’s stop thermokarsts and fires,’ like you can with fossil fuels.”

Schuur is trying to understand how quickly that carbon might be released by looking at the age of the organic material coming out of thermokarsts.

To capture the carbon being emitted by the tundra, Schuur encloses an area of the ground with a covered chamber, simulating total darkness to shut off photosynthesis in order to measure ecosystem respiration. “Everything that is metabolizing is adding carbon dioxide to your chamber,” he notes.

Carbon dioxide is collected on a trap—a molecular sieve—that is sent back to Schuur’s lab at the University of Florida. There, the sieve is heated to desorb the CO2, which is purified and frozen. That purified CO2 is then reduced to graphite, which is pounded into a “target” that is sent to the University of California, Irvine, where Schuur’s collaborators analyze the carbon-14 content with an accelerator mass spectrometer.

It is too early to say how old the material is that is coming out of the thermokarsts near Toolik, but preliminary results should be in by this winter. The scientists hope there will be an opportunity to meet in person to discuss their early findings at a conference in December.

Those first results should provide the fuzzy outlines of a picture of how thermokarsts impact the Arctic landscape. But even then, the researchers point out, there’s no easy solution to slowing down that release. “We’re not going to be here rolling out insulation mats over the tundra,” Schuur says. “There won’t be a direct mitigation. Our best mitigation is slowing down overall warming.”

Link: http://pubs.acs.org/cen/science/87/8733sci1.html

Wednesday, August 19, 2009

NSIDC Report of August 18, 2009: A change in ice motion slows seasonal decline

NSIDC Report of August 18, 2009: A change in ice motion slows seasonal decline

During the first half of August 2009, Arctic ice extent declined more slowly than during the same period in 2007 and 2008. The slower decline is primarily due to a recent atmospheric circulation pattern, which transported ice toward the Siberian coast and discouraged export of ice out of the Arctic Ocean. It is now unlikely that 2009 will see a record low extent, but the minimum summer ice extent will still be much lower than the 1979 to 2000 average.

Note: This mid-monthly analysis update shows a single-day extent value for Figure 1, rather than the usual monthly average. While monthly average extent images are more accurate in understanding long-term changes, the daily images are helpful in monitoring sea ice conditions in near-real time.

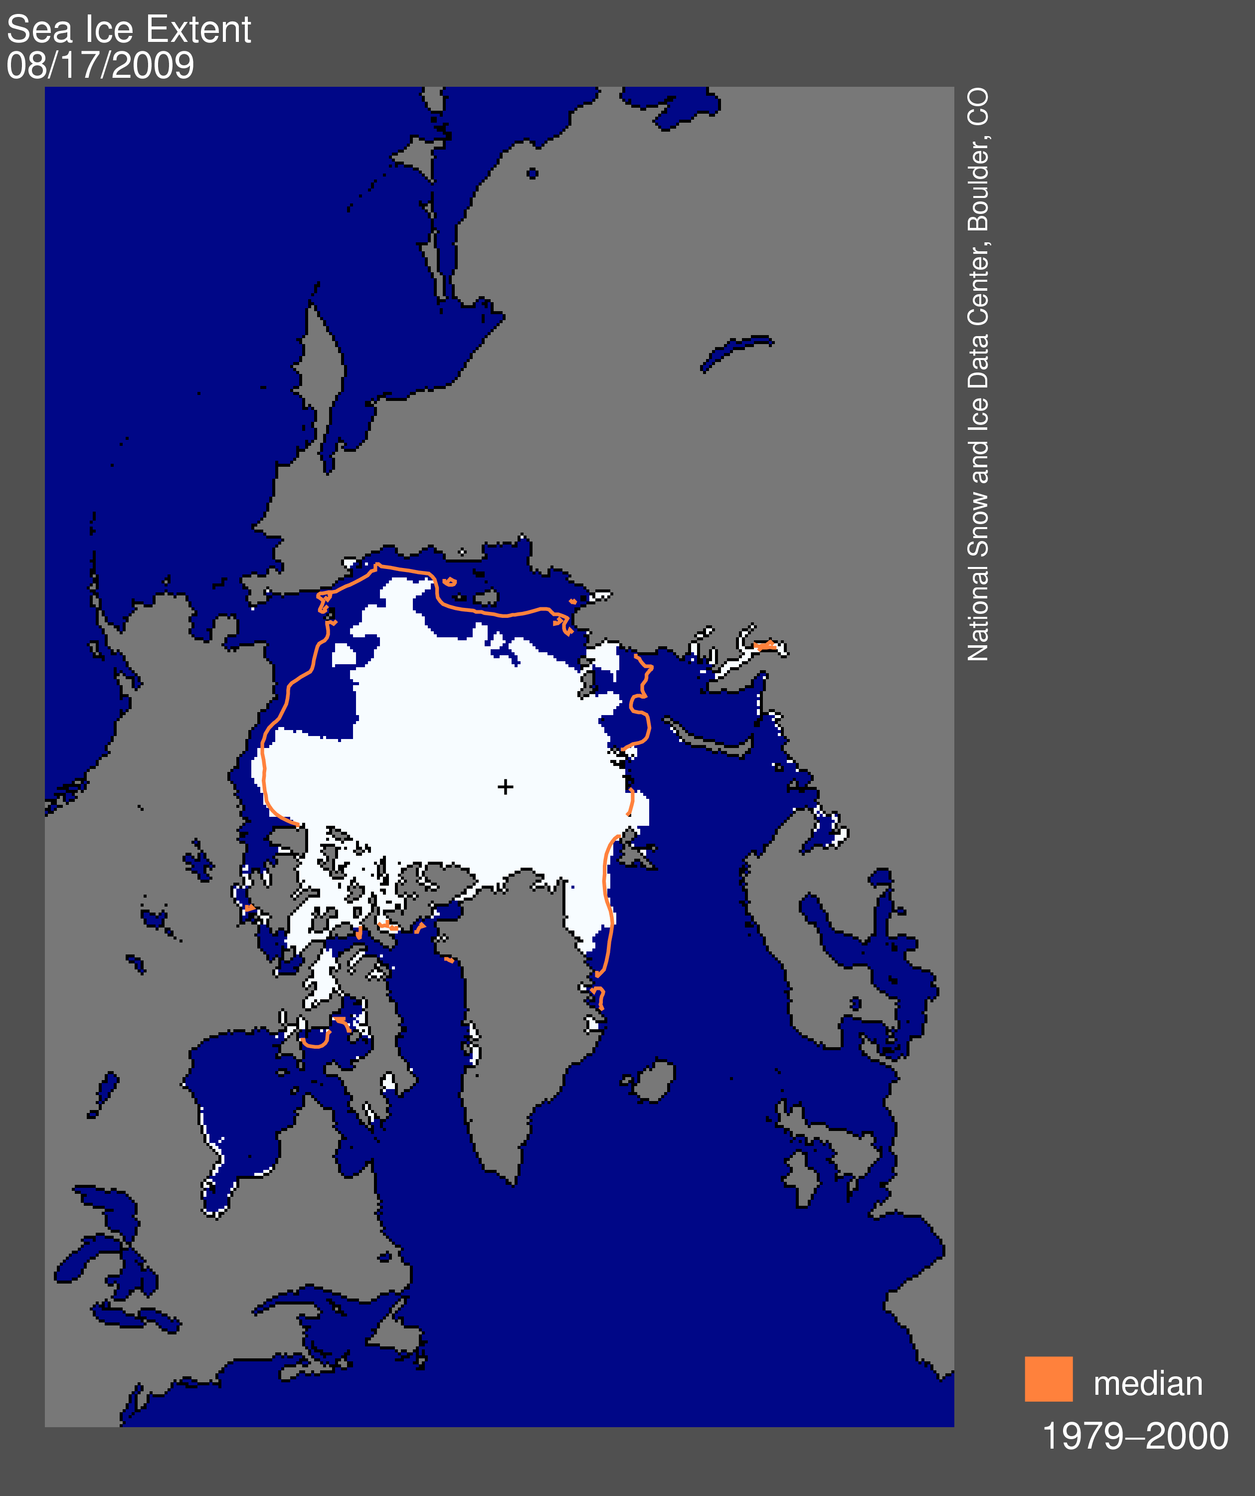
map from space showing sea ice extent, continentsFigure 1. Daily Arctic sea ice extent on August 17, 2009, was 6.26 million km² (2.42 million sq. miles). The orange line shows the 1979-2000 median extent for that day. The black cross indicates the geographic North Pole. Sea Ice Index data. About the data. —Credit: National Snow and Ice Data Center. High-resolution image

Overview of conditions

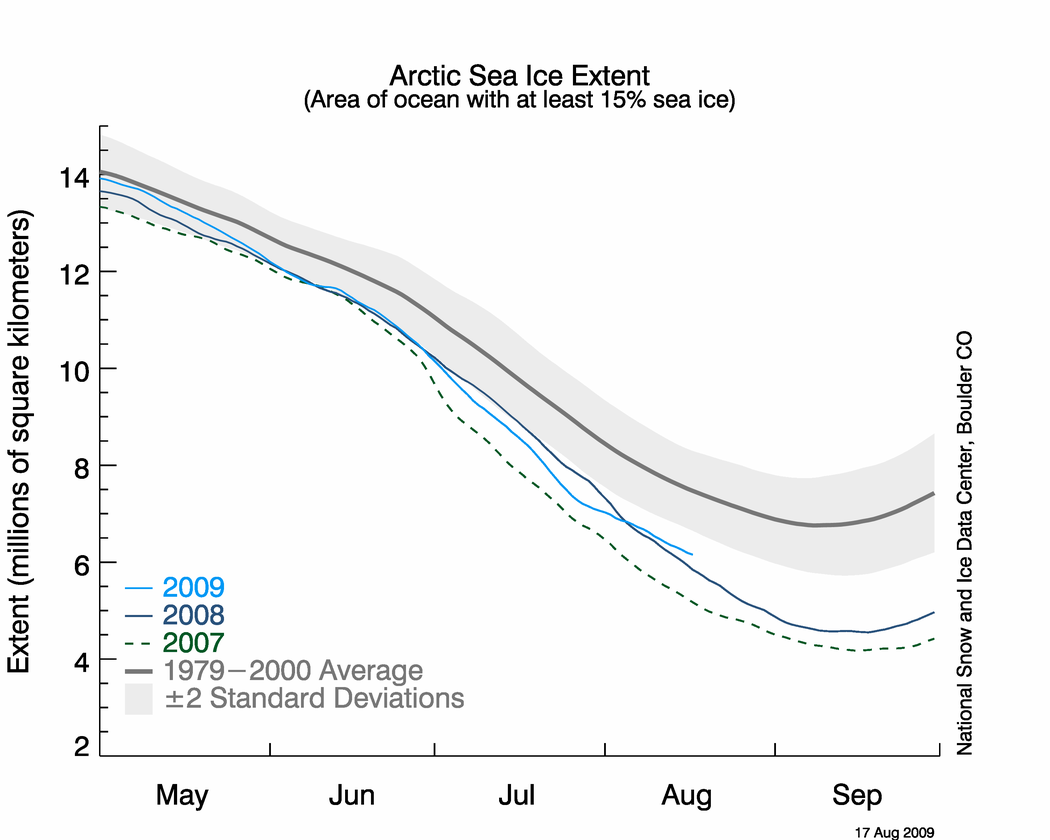
On August 17, 2009, Arctic sea ice extent was 6.26 million km² (2.42 million sq. miles). This is 960,000 km² (370,000 sq. miles) more ice than for the same day in 2007, and 1.37 million km² (530,000 sq. miles) below the 1979-2000 average. On August 8, the 2009 extent decreased below the 1979-2000 average minimum annual extent, with a month of melt still remaining.

graph with months on x axis and extent on y axis Figure 2. The graph above shows daily sea ice extent as of August 17, 2009. The solid light blue line indicates 2009; the solid dark blue line shows 2008; the dashed green line shows 2007; and the solid gray line indicates average extent from 1979 to 2000. The gray area around the average line shows the two standard deviation range of the data. Sea Ice Index data. —Credit: National Snow and Ice Data Center. High-resolution image

Conditions in context

From August 1 to 17, Arctic sea ice extent declined at an average rate of 54,000 km² (21,000 sq. miles) per day. This decline was slower than the same period in 2008, when it was 91,000 km² (35,000 sq. miles) per day, and for the same period in 2007, when ice extent declined at a rate of 84,000 km² (32,000 sq. miles) per day. The recent rate of ice loss has slowed considerably compared to most of July. Arctic sea ice extent is now greater than the same day in 2008.

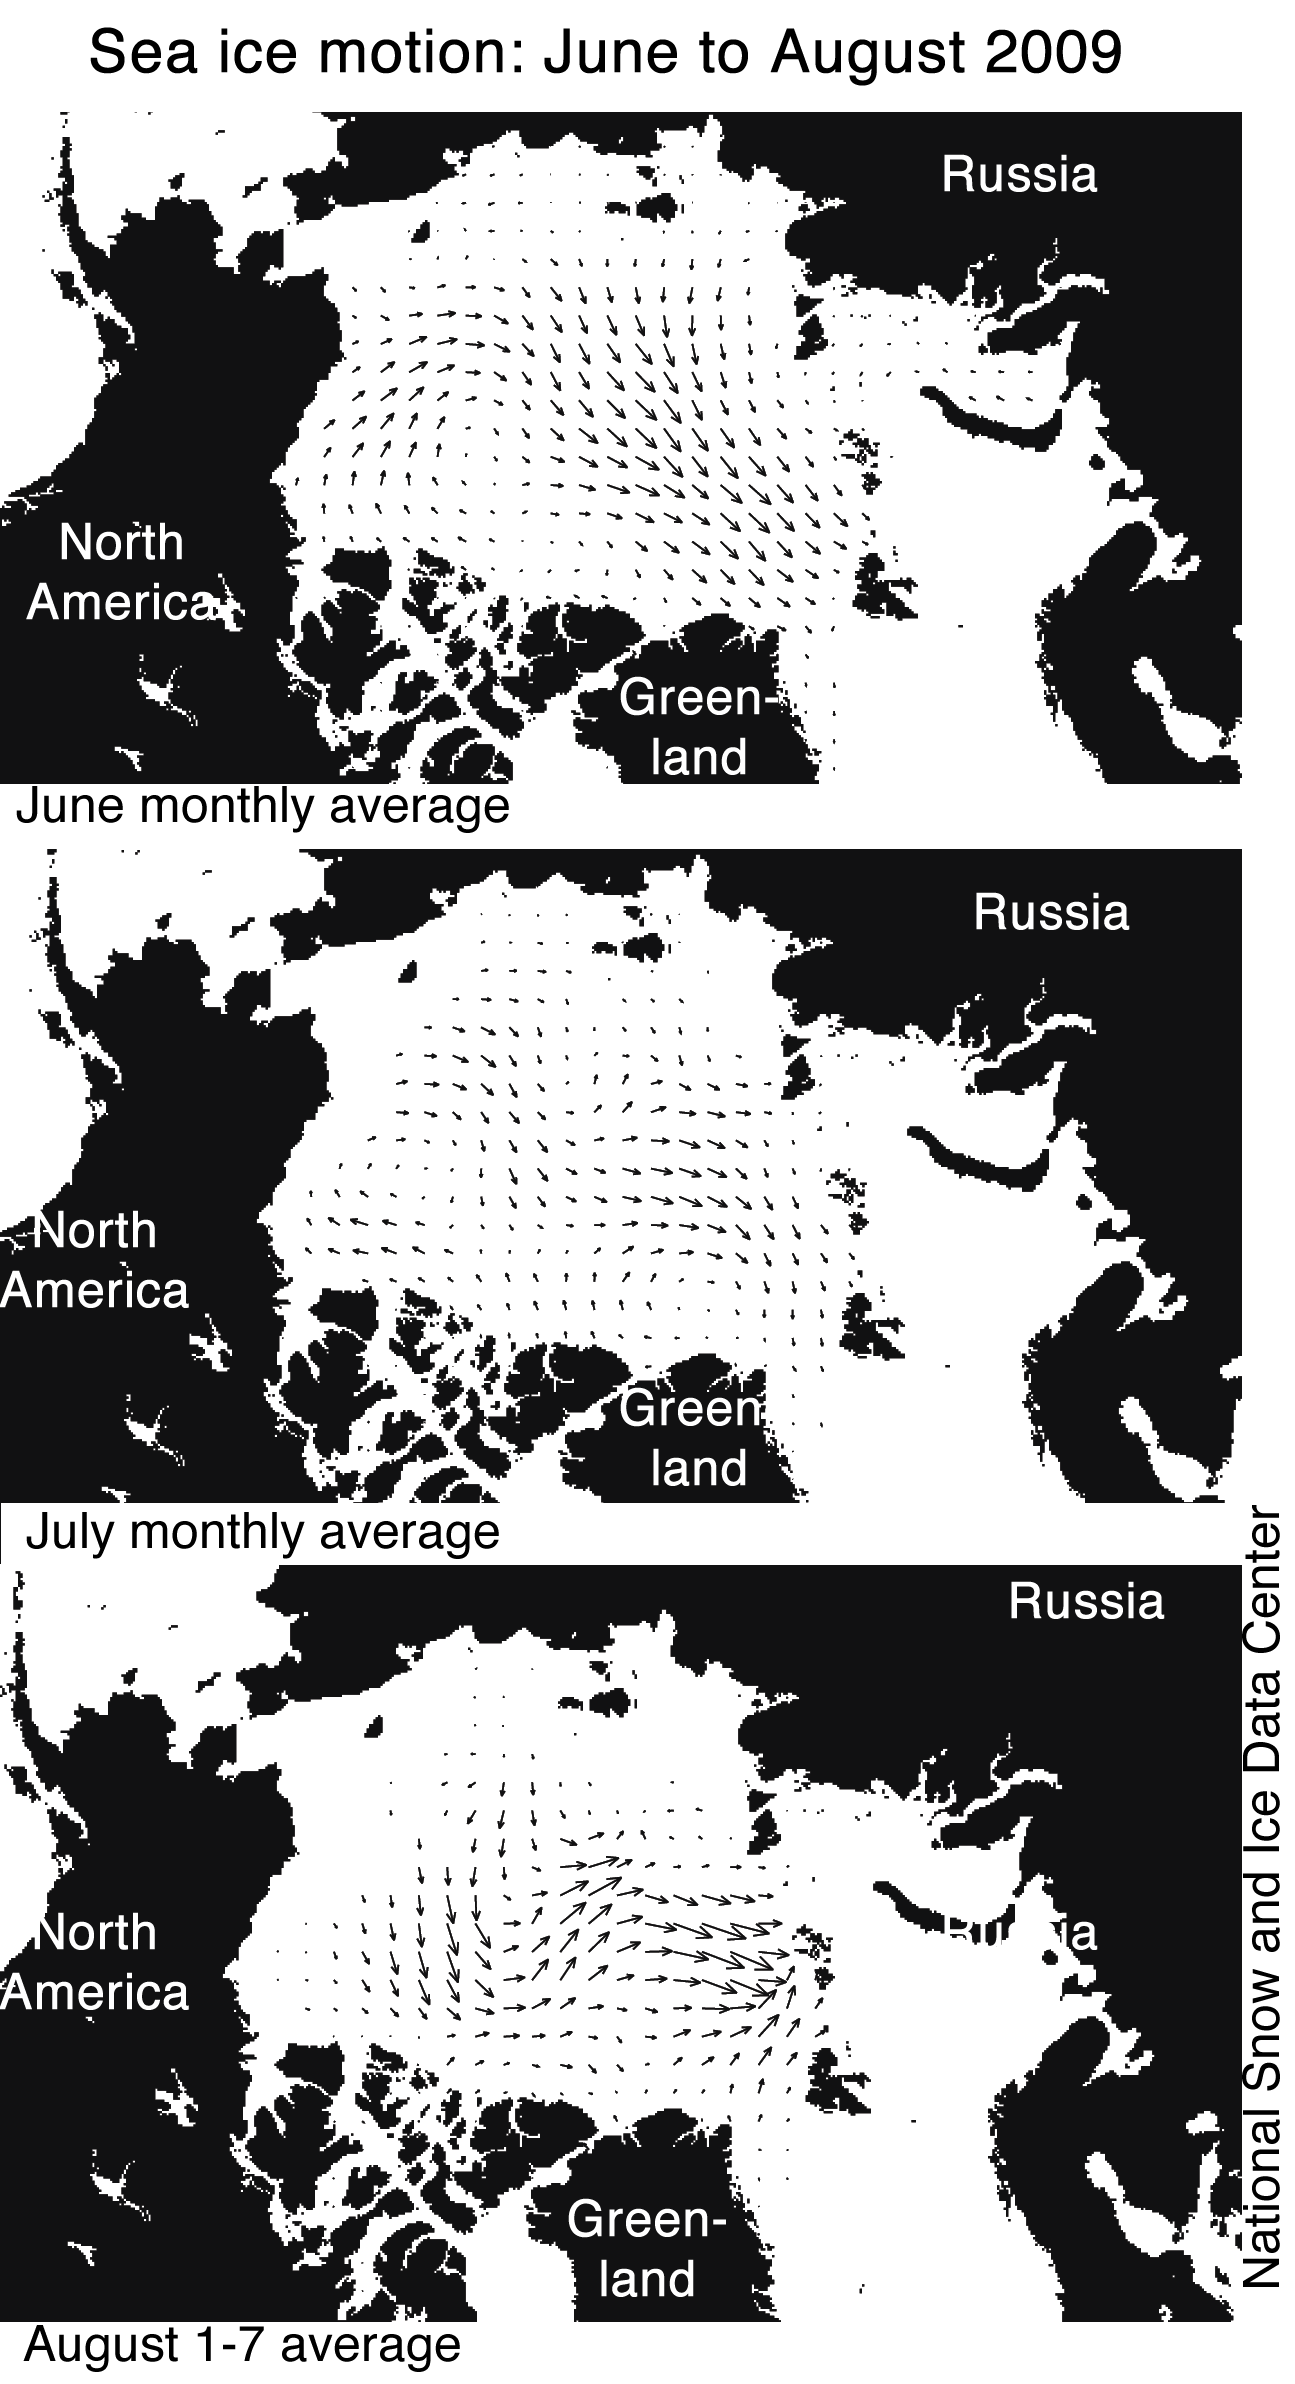
average monthly data from 1979-2009 for July Figure 3. Sea ice motion, derived from AMSR-E data and averaged for June, July, and the first week of August 2009 (the most recent data available), shows a recent change, with ice motion towards the eastern Siberian coast and little export of ice out of the Arctic Ocean via Fram Strait. —Credit: National Snow and Ice Data Center. High-resolution image

Ice motion changes in August

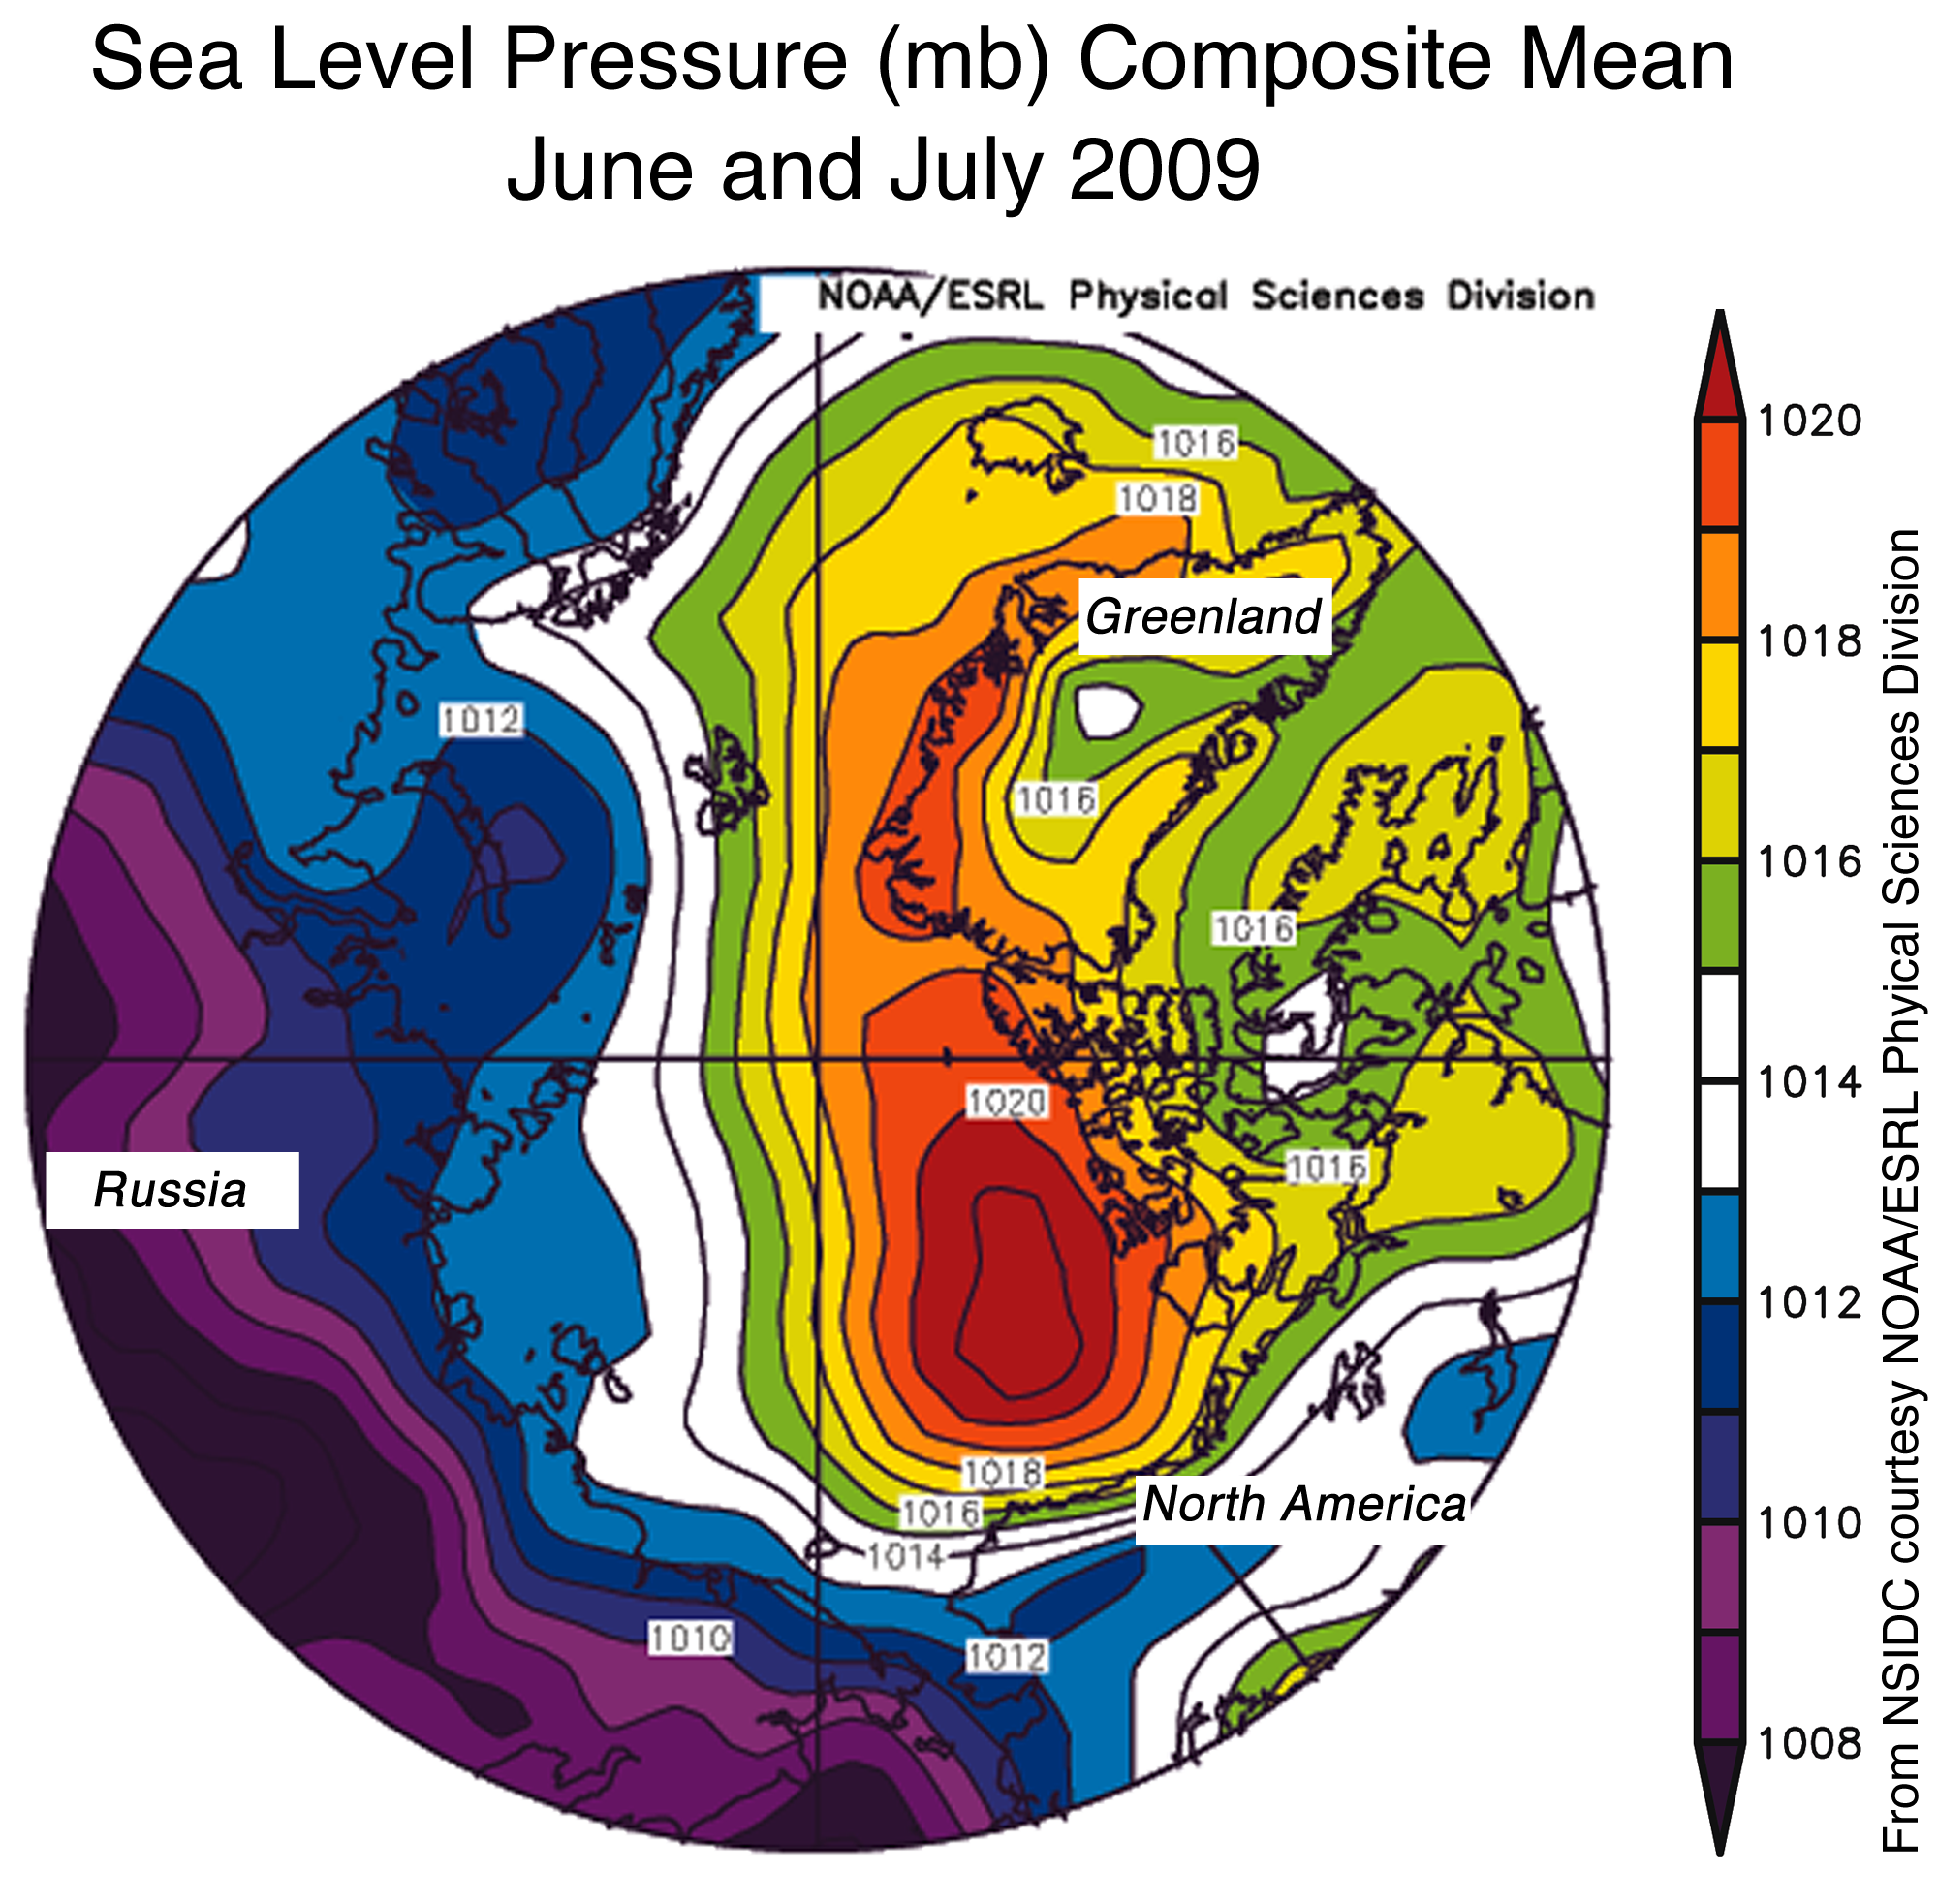
A recent atmospheric circulation pattern, which led to a change in ice motion, caused the ice loss rate to slow down significantly in the first two weeks of August. As discussed in the August 4 post, during much of June and July, a strong Beaufort Sea high-pressure pattern promoted winds that helped push ice out of the Siberian coastal seas, and also brought clear skies and warm temperatures that helped induce melt.

Toward the end of July, the atmospheric pattern changed. Averaged over the past two weeks, a high-pressure system has been centered over the Barents Sea, with low pressure centered over the Laptev Sea. In accordance with Buys Ballot's Law, this pattern led to winds that redirected the motion of the ice cover, pushing the ice edge outward toward the Siberian coast and discouraging ice from exiting the Arctic Ocean through Fram Strait.

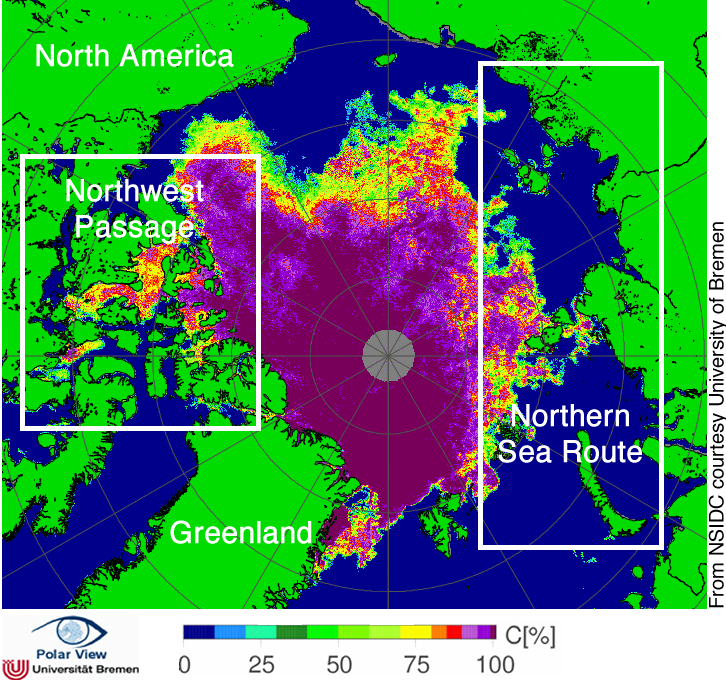
map of arctic showing sea level pressure and atmospheric circulation patterns Figure 4. The map of sea ice concentration from AMSR-E from August 16, 2009, shows ice clogging many of the channels of the Canadian Archipelago. The Northern Sea Route may be clear in the next few weeks. NASA AMSR-E data. —Credit: From National Snow and Ice Data Center, courtesy IUP, University of Bremen, Germany. High-resolution image

The Northwest Passage and Northern Sea Route

So far this year, neither the Northwest Passage nor the Northern Sea Route has opened. The Northern Sea Route appears likely to open soon, but ice still clogs many of the channels in the Northwest Passage.

Whether or not the navigational passages through the Arctic Ocean will open in a given summer depends on atmospheric circulation and ice thickness. For example, although 2007 was a record low extent in the Arctic and the Northwest Passage was nearly completely open, the Northern Sea Route was still choked with ice because of a circulation pattern that pushed a tongue of ice against the Siberian coast. Recent research by Stephen Howell at the University of Waterloo in Canada shows that whether the Northwest Passage clears depends less on how much melt occurs, and more on whether multi-year sea ice is pushed into the channels. Counterintuitively, as the ice cover thins, ice may flow more easily into the channels, preventing the Northwest Passage from regularly opening in coming decades.

ice thickness from submarinesFigure 4. The map of sea level pressure (in millibars) from June and July 2009 shows a strong high-pressure cell over the Beaufort Sea, similar to the pattern in 2007. In the past, such patterns were rare. —Credit: From National Snow and Ice Data Center, courtesy NOAA/ESRL Physical Sciences Division. High-resolution image

Comment on atmospheric circulation patterns

James Overland of the NOAA Pacific Marine Environmental Laboratory in Seattle, Washington, has taken a close look at patterns of atmospheric circulation in recent summers. Overland notes that the periods June through August 2007 and June and July 2009 both saw an unusual atmospheric pattern of sea level pressure, with higher pressure on the Alaskan side of the Arctic and lower pressure on the Eurasian side. This pressure difference brought warm air into the central Arctic and transported sea ice towards the Atlantic. Historically, such a pattern is a rare event—before 2007, it only occurred twice in 30 years. Normally, there is little difference in pressure across the Arctic during summer, and winds are slack.

This rare condition may result from the convergence of the three main patterns of climate variability: the Arctic Oscillation (AO) climate pattern, which features either high or low pressure over most of the Arctic; the positive phase of the Pacific North American (PNA) pattern, which is characterized by low pressure over the Bering Sea and high pressure over the Canadian Rockies; and the Arctic dipole pattern, which features high pressure on one side of the Arctic and low pressure on the other. In 2007 and 2009 all three patterns have been in play. A clue to the cause of these unusual conditions comes from the wind flow in the middle atmosphere. Normally winds flow in a counter-clockwise direction around the central Arctic Ocean, a flow known as the polar vortex. In the summers of 2007 and 2009 the polar vortex shifted to mostly to the Eurasian side of the Arctic, allowing higher pressures to develop on the Alaskan side. Scientists are now studying whether this dipole pattern will become more common in the future and whether the loss of summer sea ice itself is helping to make this pattern more frequent.

References

Howell, S. E. L., C. R. Duguay, & T. Markus. 2009. Sea ice conditions and melt season duration variability within the Canadian Arctic Archipelago: 1979–2008, Geophys. Res. Lett., 36, L10502; doi: 10.1029/2009GL037681.

Overland, J. E., & M. Wang. 2005. The third Arctic climate pattern: 1930s and early 2000s. Geophys. Res. Lett., 32(23), L23808; doi: 10.1029/2005GL024254.

Wang, M., N. A. Bond, & J. E. Overland. 2007. Comparison of atmospheric forcing in four sub-arctic seas. Deep-Sea Research II, 54, 2543-2559; doi: 10.1016/j.dsr2.2007.08.014

Tuesday, August 18, 2009

J. Ettema et al., GRL 36 (2009), Higher surface mass balance of the Greenland ice sheet revealed by high-resolution climate modeling

Geophysical Research Letters, 36 (2009) L12501; doi: 10.1029/2009GL038110.

Higher surface mass balance of the Greenland ice sheet revealed by high-resolution climate modeling

Janneke Ettema, Michiel R. van den Broeke (Institute for Marine and Atmospheric Research, Utrecht University, Utrecht, Netherlands), Erik van Meijgaard (Royal Netherlands Meteorological Institute, De Bilt, Netherlands), Willem Jan van de Berg (Institute for Marine and Atmospheric Research, Utrecht University, Utrecht, Netherlands), Jonathan L. Bamber (Bristol Glaciology Centre, School of Geographical Sciences, University of Bristol, Bristol, U.K.), Jason E. Box (Department of Geography, Byrd Polar Research Center, Ohio State University, Columbus, OH, U.S.A.), and Roger C. Bales (Sierra Nevada Research Institute, University of California, Merced, CA, U.S.A.)

Abstract

High-resolution (∼11 km) regional climate modeling shows total annual precipitation on the Greenland ice sheet for 1958–2007 to be up to 24% and surface mass balance up to 63% higher than previously thought. The largest differences occur in coastal southeast Greenland, where the much higher resolution facilitates capturing snow accumulation peaks that past five-fold coarser resolution regional climate models missed. The surface mass balance trend over the full 1958–2007 period reveals the classic pattern expected in a warming climate, with increased snowfall in the interior and enhanced runoff from the marginal ablation zone. In the period 1990–2007, total runoff increased significantly, 3% per year. The absolute increase in runoff is especially pronounced in the southeast, where several outlet glaciers have recently accelerated. This detailed knowledge of Greenland's surface mass balance provides the foundation for estimating and predicting the overall mass balance and freshwater discharge of the ice sheet.

(Received 10 March 2009, accepted 13 May 2009, published 16 June 2009.)

Ettema, J., M. R. van den Broeke, E. van Meijgaard, W. J. van de Berg, J. L. Bamber, J. E. Box, & R. C. Bales (2009), Higher surface mass balance of the Greenland ice sheet revealed by high-resolution climate modeling, Geophys. Res. Lett., 36, L12501, doi:10.1029/2009GL038110.

Link to abstract: http://www.agu.org/pubs/crossref/2009/2009GL038110.shtml

Monday, August 17, 2009

Greenland's melt ponds (lakes) disappearing from the ice sheet on the western edge near Jakobshavn Glacier

Dear Readers,

Many of you know that I spend a lot of time looking at satellite images of Greenland, almost on a daily basis.

In the past few months, I have spent a lot more time looking in detail at the edges of the ice sheet, all around Greenland, but in particular in the north and the west.

With no little dismay, I noted the increasing number of melt ponds (lakes) all around the edges, even in the far north where we non-scientists might assume that such things could not occur due to the very low temperatures in the far north. However, even in the far north, these melt lakes are occurring with greater and greater frequency.

But, today, I want to write about western Greenland and in particular about the edge of the ice sheet near the Jakobshavn Glacier.

OK, anyone can see that the edge of the ice sheet is retreating. But, lately, there was something else going on, and I just could not put my finger on it -- until today.

A few weeks ago, an enormous number of melt lakes were there in bright blue on the white ice.

Now, many or most of them have emptied out.

You can see the pits they formed as little grayish outlines on the ice sheet.

I have darkened the MODIS satellite photo so that you can see these outlines better. As always, just click on the photo to enlarge the details.


The full image can be found here:
http://rapidfire.sci.gsfc.nasa.gov/realtime/single.php?2009228/crefl1_143.A2009228150500-2009228151000.250m.jpg

1993-2008 global mean sea level changes recorded by the Jason-2 and -1 and TOPEX/Poseidon satellites

Historical sea level changes

Last two decades

High-quality measurements of (near)-global sea level have been made since late 1992 by satellite altimeters, in particular, TOPEX/Poseidon (launched August, 1992) and Jason-1 (launched December, 2001) and Jason-2 (launched June, 2008). This data has shown a more-or-less steady increase in Global Mean Sea Level (GMSL) of around 3.3 ± 0.4 mm/year over that period. This is more than 50% larger than the average value over the 20th century. Whether or not this represent a further increase in the rate of sea level rise is not yet certain.

The two plots below show the GMSL measured from TOPEX/Poseidon, Jason-1 and Jason-2.

This one shows it with the seasonal signal removed:

Plot of global sea level from 1993 to 2008


And this shows it with the seasonal signal left in:


Regional trends

Sea level does not rise (or fall) uniformly over the oceans. This is illustrated by the map (below) showing sea-level trends from 1993 to 2008. There is a clear pattern of sea-level change that is also reflected in patterns of ocean heat storage.

Plot of sea level trends from 1993 to 2008


This pattern primarily reflects interannual climate variability associated with the El Niño/La Niña cycle. During El Niño years sea level rises in the eastern Pacific and falls in the western Pacific, whereas in La Niña years the opposite is true, as is shown (below) by the trends from two subsets of the same dataset.

Plot of sea level trends from 1993 to 2000 and 2001 to 2008


Movie of sea-level changes (2.2-Mb animated gif) over the last 16 years - this version has had the seasonal (annual+semi-annual) signal removed at each point. This is comparable to the top figure (above).

Click on the map below to see a movie of monthly-mean sea-surface height from January 1993 to December 2008 with the seasonal signal removed. The plot at the top of the page shows the time series of the means of these fields.

The data that is displayed here can be downloaded from the "Sea level data>Data downloads" page on this site.

Note the 1997/98 El Niño event!

Sea surface height 1993-2008


Another movie of sea-level changes (2.3 Mb animated gif) over the last 16 years

Click on the map below to see a movie of monthly-mean sea-surface height from January 1993 to December 2008. The seasonal signal has not been removed from this, so you should see the pumping as the water in each hemisphere warms and expands in Spring and Summer and cools and shrinks in Autumn and Winter. The second plot (above) shows the time series of the means of these fields.

The data that is displayed here can be downloaded from the "Sea level data>Data downloads" page on this site.

Note especially the 1997/98 El Niño event!

Website owner: Neil White 31/07/09


CMAR Home | Wealth from Oceans Flagship | ACE CRC
Legal Notice and Disclaimer | Copyright

Sunday, August 16, 2009

Tropical storm/hurricane Bill storm track site

Just found a pretty cool site for tracking the upcoming hurricanes:

http://www.stormpulse.com/tropical-storm-bill-2009

McCabe, Clark & Serreze, J. Climate, Trends in Northern Hemisphere surface cyclone frequency and intensity

Journal of Climate, Vol. 14, No. 12, pp. 2763-2768 (June 2001); DOI: 10.1175/1520-0442(2001)014<2763:tinhsc>2.0.CO;2

Trends in Northern Hemisphere surface cyclone frequency and intensity

Gregory J. McCabe (U.S. Geological Survey, Denver Federal Center, Denver, CO, U.S.A.), Martyn P. Clark and Mark C. Serreze (Cryospheric and Polar Processes Division, Cooperative Institute for Research in Environmental Sciences, University of Colorado, Boulder, CO, U.S.A.)

(Manuscript received July 27, 2000, in final form November 20, 2000.)

Abstract

One of the hypothesized effects of global warming from increasing concentrations of greenhouse gases is a change in the frequency and/or intensity of extratropical cyclones. In this study, winter frequencies and intensities of extratropical cyclones in the Northern Hemisphere for the period 1959–97 are examined to determine if identifiable trends are occurring. Results indicate a statistically significant decrease in midlatitude cyclone frequency and a significant increase in high-latitude cyclone frequency. In addition, storm intensity has increased in both the high and midlatitudes. The changes in storm frequency correlate with changes in winter Northern Hemisphere temperature and support hypotheses that global warming may result in a northward shift of storm tracks in the Northern Hemisphere.

Link to abstract: http://ams.allenpress.com/perlserv/?request=get-abstract&doi=10.1175%2F1520-0442(2001)014%3C2763:TINHSC%3E2.0.CO%3B2&ct=1

No, sorry, the oceans are not cooling

See ocean temperature anomalies at this link:

http://data.giss.nasa.gov/gistemp/tabledata/GLB.Ts+dSST.txt

Michael E. Mann et al., Nature 460 (2009), Atlantic hurricanes and climate over the past 1,500 years

Nature, 460, 880-883 (13 August 2009); doi: 10.1038/nature08219; received 6 March 2009, accepted 14 June 2009.

Atlantic hurricanes and climate over the past 1,500 years

Michael E. Mann*1, Jonathan D. Woodruff2, Jeffrey P. Donnelly3 and Zhihua Zhang1

  1. Department of Meteorology and Earth and Environmental Systems Institute, Pennsylvania State University, University Park, PA 16802, U.S.A.
  2. Department of Geosciences, University of Massachusetts, Amherst, MA 01003, U.S.A.
  3. Department of Geology and Geophysics, Woods Hole Oceanographic Institution, Woods Hole, MA 02543, U.S.A.
Abstract

Atlantic tropical cyclone activity, as measured by annual storm counts, reached anomalous levels over the past decade1. The short nature of the historical record and potential issues with its reliability in earlier decades, however, has prompted an ongoing debate regarding the reality and significance of the recent rise2, 3, 4, 5. Here we place recent activity in a longer-term context by comparing two independent estimates of tropical cyclone activity over the past 1,500 years. The first estimate is based on a composite of regional sedimentary evidence of landfalling hurricanes, while the second estimate uses a previously published statistical model of Atlantic tropical cyclone activity driven by proxy reconstructions of past climate changes. Both approaches yield consistent evidence of a peak in Atlantic tropical cyclone activity during medieval times (around ad 1000) followed by a subsequent lull in activity. The statistical model indicates that the medieval peak, which rivals or even exceeds (within uncertainties) recent levels of activity, results from the reinforcing effects of La-Niña-like climate conditions and relative tropical Atlantic warmth.

*Correspondence and requests for materials should be addressed to M.E.M. (e-mail: mann@psu.edu).

Link to abstract: http://www.nature.com/nature/journal/v460/n7257/full/nature08219.html

Saturday, August 15, 2009

B. D. Santer et al., PNAS (2009), Incorporating model quality information in climate change detection and attribution studies

Proceedings of the National Academy of Sciences, published online before print August 14, 2009; doi: 10.1073/pnas.0901736106

Incorporating model quality information in climate change detection and attribution studies

  1. B. D. Santera,1,
  2. K. E. Taylora,
  3. P. J. Glecklera,
  4. C. Bonfilsa,
  5. T. P. Barnettb,
  6. D. W. Pierceb,
  7. T. M. L. Wigleyc,
  8. C. Mearsd,
  9. F. J. Wentzd,
  10. W. Brüggemanne,
  11. N. P. Gillettf,
  12. S. A. Kleina,
  13. S. Solomong,
  14. P. A. Stotth and
  15. M. F. Wehneri
  1. aProgram for Climate Model Diagnosis and Intercomparison, Lawrence Livermore National Laboratory, Livermore, CA 94550;
  2. bScripps Institution of Oceanography, La Jolla, CA 92037;
  3. cNational Center for Atmospheric Research, Boulder, CO 80307;
  4. dRemote Sensing Systems, Santa Rosa, CA 95401;
  5. eInstitut für Unternehmensforschung, Universität Hamburg, 20146 Hamburg, Germany;
  6. fCanadian Centre for Climate Modelling and Analysis, University of Victoria, Victoria, BC, Canada V8W 3V6;
  7. gChemical Sciences Division, National Oceanic and Atmospheric Administration Earth System Research Laboratory, Boulder, CO 80305;
  8. hHadley Centre, U.K. Meteorological Office, Exeter EX1 3PB, United Kingdom; and
  9. iLawrence Berkeley National Laboratory, Berkeley, CA 94720

Abstract

In a recent multimodel detection and attribution (D&A) study using the pooled results from 22 different climate models, the simulated “fingerprint” pattern of anthropogenically caused changes in water vapor was identifiable with high statistical confidence in satellite data. Each model received equal weight in the D&A analysis, despite large differences in the skill with which they simulate key aspects of observed climate. Here, we examine whether water vapor D&A results are sensitive to model quality. The “top 10” and “bottom 10” models are selected with three different sets of skill measures and two different ranking approaches. The entire D&A analysis is then repeated with each of these different sets of more or less skillful models. Our performance metrics include the ability to simulate the mean state, the annual cycle, and the variability associated with El Niño. We find that estimates of an anthropogenic water vapor fingerprint are insensitive to current model uncertainties, and are governed by basic physical processes that are well-represented in climate models. Because the fingerprint is both robust to current model uncertainties and dissimilar to the dominant noise patterns, our ability to identify an anthropogenic influence on observed multidecadal changes in water vapor is not affected by “screening” based on model quality.

*Correspondence e-mail: santer1@llnl.gov

Link to abstract: http://www.pnas.org/content/early/2009/08/13/0901736106.abstract

Link to free, open-access, full article: http://www.pnas.org/content/early/2009/08/13/0901736106.full.pdf+html

Friday, August 14, 2009

Pine Island Glacier, Antarctica, thinning rapidly, 400% faster than 10 years ago

Large Antarctic glacier thinning 4 times faster than it was 10 years ago: “Nothing in the natural world is lost at an accelerating exponential rate like this glacier.”

by Joseph Romm, Climate Progress blog, August 13, 2009

A BBC story on the new study, “The spatial and temporal evolution of Pine Island Glacier thinning, 1995 – 2006,” (subs. req’d) explains:

Calculations based on the rate of melting 15 years ago had suggested the glacier would last for 600 years. But the new data points to a lifespan for the vast ice stream of only another 100 years.

The rate of loss is fastest in the centre of the glacier and the concern is that if the process continues, the glacier may break up and start to affect the ice sheet further inland.

One of the authors, Professor Andrew Shepherd of Leeds University, said that the melting from the centre of the glacier would add about 3cm to global sea level.

“But the ice trapped behind it is about 20-30 cm of sea level rise and as soon as we destabilise or remove the middle of the glacier we don’t know really know what’s going to happen to the ice behind it,” he told BBC News.

When we last left Antarctic research, it turned out that the great ice sheet’s temperature had risen by up to about 3 °C (5.4 °F) in the past 50 years, which is the fastest increase in the southern hemisphere (see “Antarctica has warmed significantly over past 50 years, revisited“):

antarctica2.jpg

Antarctica is disintegrating much faster than almost anybody imagined. In 2001, the IPCC “consensus” said neither Greenland nor Antarctica would lose significant mass by 2100. They both already are. As Penn State climatologist Richard Alley said in March 2006, the ice sheets appear to be shrinking “100 years ahead of schedule.”

http://www.open.ac.uk/port/images/z_Antarctica.gifPine Island Glacier is where the first “A” in “Antarctica” in the figure above [see figure on right, click to enlarge]. It is of special interest, as the BBC notes:

Pine Island glacier has been the subject of an intense research effort in recent years amid fears that its collapse could lead to a rapid disintegration of the West Antarctic ice sheet.

The rest of this post will survey what we now know about the increasingly unstable West Antarctic ice sheet (WAIS) and the threat it poses to humanity — or is that the threat humanity poses to it? — if we continue on our current suicidal emissions path. Regular readers can skip the rest of this post since I’m mostly excerpting, “Q: How much can West Antarctica plausibly contribute to sea level rise by 2100?” [A: 3-5 feet].

A 2007 study found “The current loss of mass from the Amundsen Sea embayment of the West Antarctic ice sheet [WAIS] is equivalent to that from the entire Greenland ice sheet” (see the new survey report Antarctic Climate Change and the Environment draft here). And WAIS’s 2007’s ice loss was 75% higher than 2006’s (see “The Antarctic ice sheet hits the fan“).

The warming of the WAIS is most worrisome (at least for this century) because it’s going to disintegrate long before the East Antarctic Ice Sheet does — since WAIS appears to be melting from underneath (i.e. the water is warming, too), and since, as I wrote in the “high water” part of my book, the WAIS is inherently less stable:

Perhaps the most important, and worrisome, fact about the WAIS is that it is fundamentally far less stable than the Greenland ice sheet because most of it is grounded far below sea level. The WAIS rests on bedrock as deep as two kilometers underwater. One 2004 NASA-led study found that most of the glaciers they were studying “flow into floating ice shelves over bedrock up to hundreds of meters deeper than previous estimates, providing exit routes for ice from further inland if ice-sheet collapse is under way.” A 2002 study in Science examined the underwater grounding lines–the points where the ice starts floating. Using satellites, the researchers determined that “bottom melt rates experienced by large outlet glaciers near their grounding lines are far higher than generally assumed.” And that melt rate is positively correlated with ocean temperature.

The warmer it gets, the more unstable WAIS outlet glaciers will become. Since so much of the ice sheet is grounded underwater, rising sea levels may have the effect of lifting the sheets, allowing more-and increasingly warmer-water underneath it, leading to further bottom melting, more ice shelf disintegration, accelerated glacial flow, and further sea level rise, and so on and on, another vicious cycle. The combination of global warming and accelerating sea level rise from Greenland could be the trigger for catastrophic collapse in the WAIS (see, for instance, here).

You can read every thing a laymen could possibly want to know about what the recent study on Antarctic warming does and doesn’t show at RealClimate here.

A couple of new papers published by Nature in March have been portrayed as suggesting the WAIS as a whole may be stabler than was previously thought. Yet the first paper, “Obliquity-paced Pliocene West Antarctic ice sheet oscillations” (subs. req’), concludes:

Our data provide direct evidence for orbitally induced oscillations in the WAIS, which periodically collapsed, resulting in a switch from grounded ice, or ice shelves, to open waters in the Ross embayment when planetary temperatures were up to approx3 °C warmer than today and atmospheric CO2 concentration was as high as approx400 p.p.m.v.

We’ll be at 400 ppm by 2020. We’re on track to be more than 5 °C warmer by 2100. So the first paper doesn’t seem terribly reassuring.

The second paper by Pollard and DeConto (the one that got all the attention), “Modelling West Antarctic ice sheet growth and collapse through the past five million years,” (subs. req’), notes, “Recent melt rates under small Antarctic ice shelves are inferred to be increasing dramatically” and concluded:

the WAIS will begin to collapse when nearby ocean temperatures warm by roughly 5 °C. Global climate and regional ocean modelling is needed to predict when and if future ocean temperatures and melt rates under the major Antarctic ice shelves will increase by these amounts, and if so, for how long.

Are you reassured yet?

I would note that West Antarctica land temperatures have risen up to 3 °C over the past 50 years — some 4 times what the planet as a whole has warmed. And both Hadley and MIT say the planet will warm more than 5 °C by 2100, with a 10% chance of warming more than 7 °C (see M.I.T. doubles its projection of global warming by 2100 to 5.1 °C and “Hadley Center warns of “Catastrophic” 5-7 °C warming by 2100 on current emissions path. And while the ocean warms less than the nearby land, the new study Antarctic Climate Change and the Environment warns: “UP TO one-third of all Antarctic sea ice is likely to melt by the end of the century.” So we may yet see polar amplifacation near the South Pole (see “What exactly is polar amplification and why does it matter?“).

Dr. Robert Bindschadler of NASA, who has been an active Antarctic field researcher for the past 25 years, commented on the new study (here):

I’m familiar with the Pollard/DeConto work. They previewed it last fall at an annual science workshop I organize on West Antarctic research. Their model lacks the detail to get the fastest dynamic responses, so the 0.5 m/century rate for sea level rise should only be viewed as a lower bound (and a poor one, at that).

Their model is better at getting the longer-term quasi-equilibrium response (it just takes their model a little longer to get there), so it ’s very interesting that they demonstrate the sensitivity to the ocean temperature. That thinking is certainly where Antarctic scientists are being led by both data and models.

Moreover, the entire WAIS need not collapse for it to contribute to catastrophic sea level rise this century.

The Antarctic Peninsula alone contains “a total volume of 95,200 km³ (equivalent to 242 mm of sea-level; Pritchard & Vaughan, 2007), roughly half that of all glaciers and ice caps outside of either Greenland or Antarctica” (see Chapter 5 here) — that would be more than 9 inches of sea level rise from a region of WAIS losing its protective ice shelves on both sides at an alarming pace.

But it is westernmost part of WAIS, that borders on the Amundsen Sea, and that includes Pine Island, that we need to worry most about, as AP reported earlier this year:

Glaciers in Antarctica are melting faster and across a much wider area than previously thought, a development that threatens to raise sea levels worldwide and force millions of people to flee low-lying areas, scientists said Wednesday.

Researchers once believed that the melting was limited to the Antarctic Peninsula, a narrow tongue of land pointing toward South America. But satellite data and automated weather stations now indicate it is more widespread.

The melting “also extends all the way down to what is called west Antarctica,” said Colin Summerhayes, executive director of the Britain-based Scientific Committee on Antarctic Research.

“That’s unusual and unexpected,” he told the Associated Press in an interview.

By the end of the century, the accelerated melting could cause sea levels to climb by 3-5 feet — levels substantially higher than predicted by a major scientific group just two years ago….

The biggest of the western glaciers, the Pine Island Glacier, is moving 40% faster than it was in the 1970s, discharging water and ice more rapidly into the ocean, said Summerhayes, a member of International Polar Year’s steering committee.

The Smith Glacier, also in west Antarctica, is moving 83% faster than in 1992, he said.

The glaciers are slipping into the sea faster because the floating ice shelf that would normally stop them — usually 650-980 feet thick — is melting. And the glaciers’ discharge is making a significant contribution to increasing sea levels.

So we have the serious potential for 3-5 feet of sea level rise just from WAIS this century — and that is on top of whatever we get from thermal expansion of the ocean and Greenland. And on top of whatever we get from the melting of the inland glaciers, whose contribution was recently increased:

New research published this month in the journal Geophysical Research Letters found that melting glaciers will add at least 7 inches to the world’s sea level — and that’s if carbon dioxide pollution is quickly capped and then reduced.

Far more likely is an increase of at least 15 inches and probably more just from melting glaciers, the journal said.

So it increasingly looks like we are facing a very serious risk of more than 5 feet of total sea level rise by 2100 on our current emissions path.

But this is almost not news anymore — see Startling new sea level rise research: “Most likely” 0.8 to 2.0 meters by 2100. Indeed, an important Science article from 2007 used empirical data from last century to project that sea levels could be up to 5 feet higher in 2100 and rising 6 inches a decade (see Inundated with Information on Sea Level Rise. Another 2007 study from Nature Geoscience came to the same conclusion (see “Sea levels may rise 5 feet by 2100“). Leading experts in the field have a similar view (see “Amazing AP article on sea level rise” and “Report from AGU meeting: One meter sea level rise by 2100 “very likely” even if warming stops?“). Even a major report signed off on by the Bush administration itself was forced to concede that the IPCC numbers are simply too out of date to be quoted anymore (see US Geological Survey stunner: Sea-level rise in 2100 will likely “substantially exceed” IPCC projections).

Did I mention the time to act is now!

Related Posts: